As the World Turns – Global Markets Perspective
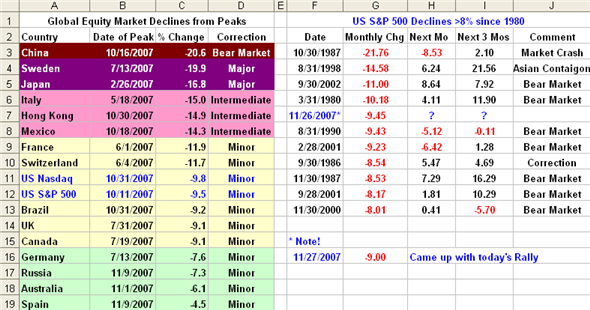
By way of a change, I felt it might be worthwhile to show where the US Markets sit in their corrections relative to the World Markets to get some perspective of the extent of the corrections worldwide. In addition, on the right hand side of the chart below I show the S&P 500 Corrections greater than 8% since 1980. You can see that the U.S. market sits in the middle of the pack and again in the middle of the range of corrections given that we had a bounce today and are currently sitting at 9% down from the high and for the month…between friends.
- Note that although China has had a huge gain this year, it has already dropped over 20% from its high and is therefore in a Bear Market. Likewise, Sweden and Japan are knocking on the door with a Major Correction. I have used the same color code as in other notes so you can peruse the rest of the world easily as to their correction status. As we can see, most corrections greater than 8% in one month relate to a bear market where most corrections occur together with the dreaded “R” word…a recession. Goldman Sachs put the chances at 40 to 45%.
- It goes without saying that there are two schools of thought on what the Fed should do in their Middle of December meeting. Those who believe that the last shoe has not dropped yet on the Credit Crunch and Housing problems believe a further shot in the arm of a reduction of 50 basis points is what the doctor ordered. Others feel that any further rate cuts can cause a further run on the weak dollar, that the cost of living is ever increasing and that gas and food are the main criteria that measures how the masses are suffering at the lower end of the income scale. As my blog of three weeks ago on November 8th indicated the FOMC is caught between a rock and a hard place.
- All is not gloom and doom. Today looked like we were due for more on the downside, but up strides the Sheiks from Abu Dhabi to provide a $7 Billion injection to Citigroup…mind you at a hefty 15% rate…if my understanding is correct. That caused the big bounce at the onset, and then we had the usual late fade about two hours before the close. It looked like the party for today was over as one could hardly not notice that many were selling into the bounce. For the first time in ages when there has been a late sell off near the close, the market came back to finish up 215 points on the DOW, nearly 40 points on the Nasdaq and 21 points on the S&P 500, all over 1.5% gain from yesterday.
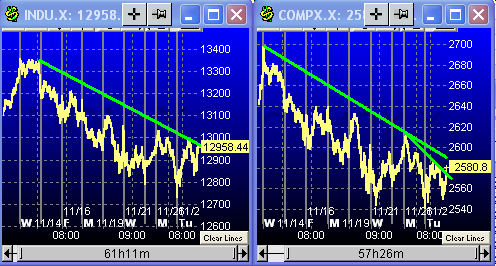
- That’s the good news. Now the bad news is that the DOW and all the other Indexes are on a sell signal. The DOW needs to close above 13100 or higher to reverse the last dip into the lows and could trigger a year-end rally attempt. Likewise, the Nasdaq needs to get above 2640. However, we need another 1000 points up to reverse the sell signal on the DOW. This implies a 10% bounce play and that is wishful thinking at this stage of events and would be reserved for a major new set of news for such a change to occur. The thumb nail charts for the DOW and Nasdaq are shown below for the past week. We have lost a lot of ground as we can see:
Best Regards, Ian.
 Ian Woodward's Investing Blog


