Ian Woodward's Investing Blog

Archive for November, 2007

The $64,000 Question – When will we find a Bottom?

Monday, November 19th, 2007

You can see that we still need three “Dotted Red Ovals to turn to Green”, before we have a chance of seeing a Bottom.  Note that I did not say “THE Bottom”.  However we are getting more and more into oversold territory and unless we have a major melt down due to some surprise news, we do not have far to go to find a bottom for a Bounce Play.  The one we had with a 300 point up day and a Eureka signal fizzled, so maybe once we get the stars to line up as shown by my friend Sherlock Holmes we will see a Bounce.

bottom

It requires three things to happen:

  1. We need the NYSE Index to break the 3 Std. Dev. Line convincingly as shown at the bottom.
  2. Simultaneously we must have RSI 14 Periods come down to 30 or lower.
  3. We need Capitulation where the New Lows for the day are around 1000 on the NYSE

At that point the Bongo drums should be beating out “Bingo”.  We shall see.  For those of you who have the HGSI Software and have downloaded the latest charts, make sure to go to Major Market Indexes, Select the NYSE Composite and the 4K 50-dma Bands 1, 2, 3 std. dev chart. Best Regards, Ian.  

P.S. Don’t all shout at once…I modified that view to include the %A/D.  The red oval at the top was an additional item to watch which is to see if the Limbo Bar comes down at least -5% from the 50-dma for good measure.


Gunfight at the OK Corral – Round #2

Sunday, November 18th, 2007

I have been busy these last few days getting the Monthly Newsletter done and holding the Saturday once a month meeting.  Now that these events are behind us, the question in everyone’s mind is what are the alternative scenarios from here and what do we do about them.  So, as they say in Bridge, let’s review the bidding before we make the call.  Always start with the “Stakes in the Ground”, which are indisputable facts.  We are all familiar with the picture below by now.  They are the Stakes in the Ground, with the demarcations for a Minor Correction of 8% to 12%, an Intermediate Correction of 12% to 16%, a Major Correction of 16% to 20% and a Bear Market of >20%.   I gave you the warning that Big Foot was already out and about and that King Kong and Godzilla are lurking in the wings.  These Measuring Rods are the standards by which HGS Investors measure the depth of the correction: 

        Targets

This time I thought I would use the Nasdaq Chart to show the boundaries of the Fight at the OK Corral – Round #2, between the Bulls and the Bears:

nasdaq

You will recall that I said the Bears would be back and licking their chops having been thwarted not once but twice by the Grand Ole Duke of York, aka Ben Bernanke, aka Helicopter Ben.  They are in a lot stronger position this time than when I first presented a similar picture back on August 27th.  Looking at the chart we can see: 

  1. It doesn’t take two seconds to see that the Ballgame can go either way…we are at the 50 yard marker, and just above the 200-day moving average. 
  2. All the Moving Averages are pointing down, except the 200-dma which is flat and is the next line of defense at 2590.  Ideally, the Bulls need to hold at the psychological 2600 level or Big Foot will be pounding on the door at the 2519 level which is 12% down from the high to complete an Intermediate Correction, and that is again too close for comfort from the psychological 2500 mark.
  3. After that skirmish, we can see a Bear Market looming at 2400, which is an easy number to remember   

The net of all of that is a very simple barometer for you to remember, 2600, 2500 and 2400.  What actions you take to the downside is for you to decide, but suffice it to say if you sit around contemplating your navel if it breaks 2600, you are being a trifle reckless.  Just cast your beady eyes over to the first gunfight and you have only to see that it doesn’t take much to be 3% down below the 200-dma which is the usual recent limit of tolerance for the Limbo Bar (the inverse of the High Jump, which was explained in a previous blog).  6% down throws us into a major correction and anything further we are into the depths of a Bear Market on the Richter scale.

Assessment of the Facts Since the Last Correction:    Every word of the above is fact, and at least puts forth the various downside scenarios in a cogent and logical fashion.  The probability of which scenario occurs is in the lap of the gods and that is where I set myself apart from the gurus who are eager to step up to the plate and prophesy one way or another.   My Party’s Over blog of November 12th was to remind us that fresh out of the October Seminar just two weeks prior the strategy of playing “Nifty Fifty” Silverback US and Chinese Gorillas was over for now, as there are very few of these great stocks that haven’t suffered a minimum of a 15 to 20% correction, and most of them as much as a 25 to 40% correction, if not more.  Just review for yourselves where the five horsemen have been down to in the last week or so, i.e. GOOG, AAPL, RIMM, GRMN and BIDU.  I also told you that the Chinese Silverbacks were down 19% from the week previous where they were down 9% as a group.  Most of these stocks are sitting at the 50-dma and either trying to recuperate or are tasty morsels for mince meat by the bears as they shout charge and go for the killing on head and shoulders chart patterns.  If 2000 to 2002 is in the dim and distant past for you, in Bear Markets few stocks are spared a 40% or more pummeling. 

What are the Alternative Scenarios? 

  1. If you are a long term investor then it is prudent to take a defensive posture.  However if long or short, you have several alternatives:  You can move to cash, buy puts or hedge by playing the Ultra Long or Ultra short ETF’s providing you are nimble and at your screen. See below.
  2. If you are an intermediate term trader, you might well try your hand at the likes of the QID, SDS, TWM, SKF, FXP if you think the trend is down, or look for ETF’s and/or strong Silverbacks in the QLD, SSO, UWM and UYG.  Strong Stocks are easy to find with HGSI…a quick answer on the fly is to use All Securities in the Warehouse, make a group from list of those stocks that have earnings reports out, so you don’t suffer from bombshells, and use the Gorilla Fundamental Combo to identify the best stocks.  Make a group from that list of say the top 60 stocks and then using those in the Warehouse you can go a step deeper by selecting only those stocks that pass the “Daily Review 9 key” where the prime credentials require Stocks with an EPS and RS Rank of 85 or better.  Out of the kindness of my heart I have done this for you below, but don’t shout if your list is different than mine.  If these don’t do better than the market next week, then we might begin to say “What’s left, but the Party might well and truly be over!”  It’s Always “Your Call”.
  3. If you are a day trader, you are well tuned to knowing how to manage this tricky market.

 The Last Dance Iandex


 Warehouse


Please note that there are no more than 2 stocks in each Industry Group, we have 19 stocks not counting the Index and there are 16 different Industry Groups represented.  I will call this the Last Dance Iandex for posterity sake and we can keep a beady eye on how it behaves for future reference.  Here is the Chart for the Index and it looks as if it wants to go again.  If we get a Thanksgiving and/or a Santa Claus Rally this bunch may give us an early clue as to which way the wind is blowing.  Enjoy the versatility of the HGSI Software for any market.  Best regards, Ian.

Chart 


Is This the Year Without a Santa Claus?

Wednesday, November 14th, 2007

santa cartoon

Now we are cooking as I really appreciate inputs from my friends and supporters.  One good friend who lives in Dallas reminds me that these two characters sum up the Market really well right now…hot and cold!  Almost everyone who was a child in the US during the early-70s seems to remember that Christmas special on TV with Heat Miser and Snow Miser. Here’s a snapshot I showed you yesterday of three pictures I watch during the day among others, and it tells a sorry tale of a probable dead cat bounce.  With the CPI due tomorrow and Options Expiration on Friday who knows where we will end up for the week, but for sure they were rushing for the exits in the last half-hour and all the decent gains of the day turned to mush.

QT

The Nasdaq swooned for a loss of 1.1%, the volume was lower again today, and the FXP which is the Ultra Shorts on the Chinese stocks began to perk up towards the end of day, after starting with the bulls rubbing their hands at the open based on a strong Hang Seng performance last night.  The tasty morsels were where the action has been in the Silverback Gorillas, the Chinese Gorillas and the five horsemen we watch in AAPL, GOOG, GRMN, RIMM and BIDU.  However, by the end of the day, the first four were negative and only BIDU was up a paltry 0.75%. 

Another supporter which goes back quite a few years alerted me to get my beady eyes on the Up/Down Volume Ratio for the market indexes yesterday, which while decent, were not exactly convincing, and he is right.  But more importantly, he went on to say “We’ll have to monitor this along with price if the follow-thru day appears.”  If it is to happen then if and when we have that follow through day, remember to bring up the picture below and see if the Up/Down Volume is substantially better.  Although there is no question that the Adv Issues to Dec Issues were strong along with the accompanying volume, it helps to have many of you keeping watch on what might be significant clues and I appreciate the feedback.  Let’s take a look at that picture:Warehouse

 I made a snapshot of today’s Up/Down Volume and tacked it onto yesterday’s table at the end.  Today is lower than yesterday as we would expect from the volume picture above and the Large Cap Index is over 1.2 on both days…again confirming that the Gorillas is where the action is. What would we do without the slicing and dicing we can do with the HGSI Software? Thanks for the feedback David and keep up the good work.  Best Regards, Ian.

The Market Will Fool You Every Time!

Tuesday, November 13th, 2007

My thanks go out to all of you for your positive feedback.  Just when I felt we had figured things out and the fans were leaving the ball game yesterday in droves…then would you believe it just before they all exited, the Bears fumbled at the 25 yard line and the Bulls have the ball again.  Who said it was easy calling a top or a bottom?  I know I said the “Party’s Over” yesterday, but there is always some fly in the ointment that can make things go the other way.  That fly this time turns out to be an oversold market, and today we have a Bounce Play.  I know most of you were in your foxholes and sleeping well, and those who are daredevils don’t care as they are nimble like Spiderman and avoid being a fool or a pig in the process!  Fortunately the Game Plan I gave you at the weekend included looking at the potential of a Bounce Play, and after four hefty down days that had to be on the cards for today.

Market

Here is the Game Plan and the scenarios I suggested on Sunday and they still hold good, with one addition:

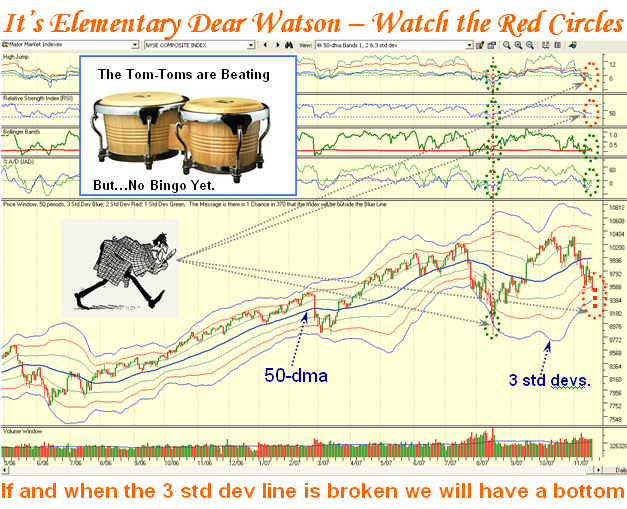
  1. Stay in your foxholes until we get a “Bingo” followed by a Eureka signal
  2. Find items to short, but you must be super nimble
  3. Alternatively, look for Silverback Gorillas least hit for the upside scenario, should the market decide to give us a Bounce Play…don’t bottom fish now; it’s usually a waste of money.
  4. Here is a new one…if the market repairs quickly we are into a Santa Claus Rally!  You have to decide when to enter

For those already in their foxholes last Friday, you have the most difficult choice as to whether to stay out or be a Jack-in-the-Box and tip toe back in.  If you are long term oriented, then you will most likely want to see the dust settle and have no part of this yo-yo market.  Those who are swing-traders are the ones who must now be extremely disciplined in your approach, as they are the ones who can get caught in a Weak Bounce only to find they must get out fast.  For sure you should have noticed that the Asian and European Markets had taken a breather and arrested the big downfall last night.  I told you the Chinese Silverbacks I gave you were down 19% from 9% the day previous…one had to expect a total rot set in yesterday or they would halt the rout and these very beaten down stocks would be the tasty morsels for today.  The same could be said of the Gorilla RonIandex so your game plan had to look for entries here first thing this morning, and/or your favorite stocks which you had vacated previously with a good taste in your mouth. 

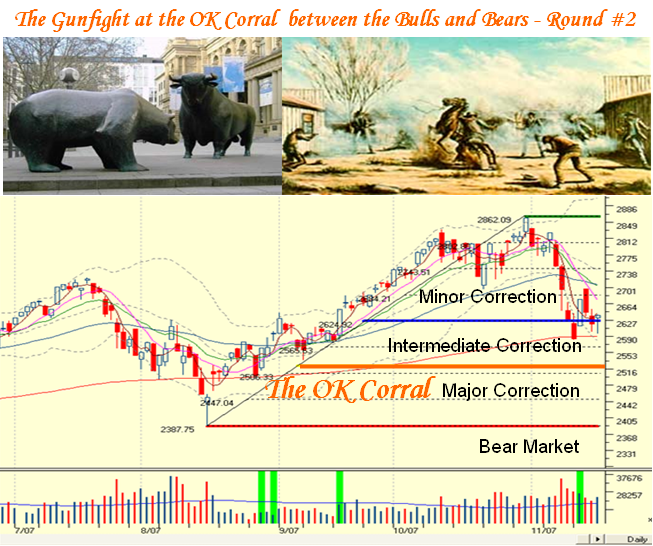
However, at all cost you cannot have a split personality.  You are either in for a day-trade or at most a two-day trade counting today, (Friday is three days away and you know everyone will be vacating on Friday).  Furthermore, you can’t dilly-dally on the way.  Recall my saying “The Early Bird catches the Worm, but look out for the Hawk above!”  Always try to figure out what your Competition’s next step will be…if you are a Bear, how do you protect your winnings from the last several days and if you are a Bull, where is the next trap my competition will set for me?  I can’t cover all these points in a two page blog, but you get the gist of how you must think before you buy today, Tuesday.  You know that every Technical Analyst under the sun has already concluded that most of the Indexes have developed a Head and Shoulders Top, so the most likely call will be wherever this Bounce Play peters out for them to take another stab at shorting.  If you are accomplished Day Traders then forgive me as you folks can take care of yourselves, but my thoughts are directed to those who have done extremely well this year, especially one person sitting in sunny Alabama and another in sunny Dallas who wrote me notes of encouragement, and I know the temptation must be there to hop in again.  Net-net, don’t get caught between two stools!  Act like Spiderman and use his trump card which is “Nimble”.  He who hesitates is lost.   

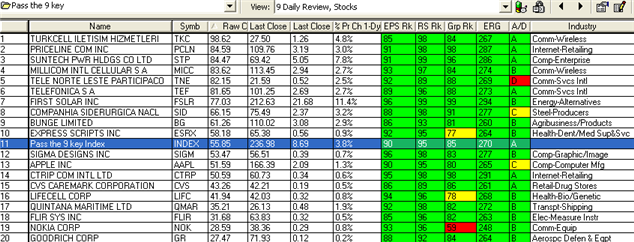
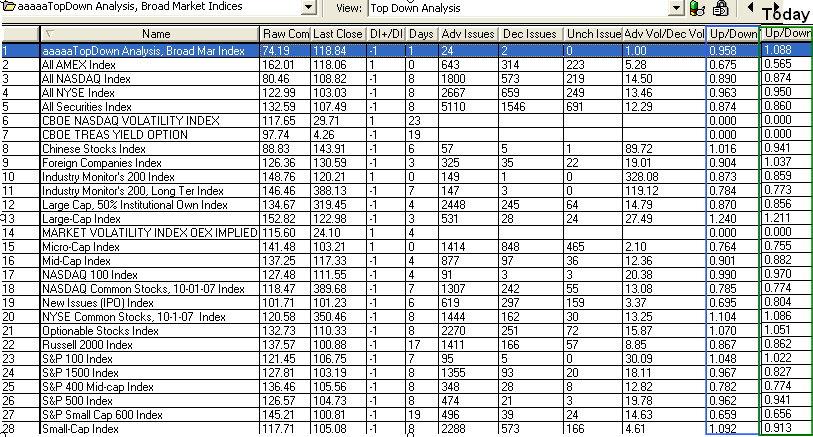
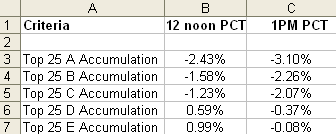
With all that said, of course they are right back in the beaten down Gorillas with the RonIandex up 5.31% for the day based on 100 share lots. I also gave you a winky-winky last night…they are heavily into “C” Accumulation stocks today, i.e., those which have solid earnings reports but buying pullbacks!  DRYS heads the list!  All 25 stocks are green for a gain of ~4%.  I trust I gave you a way to focus on a concept.  Most of you use QuoteTracker, so here is what I keep a beady eye on to see which way the wind is blowing in this current market.  You have to act early/quickly, or you get left behind. 

chart

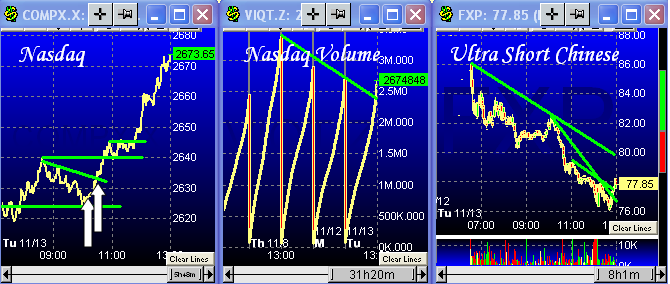
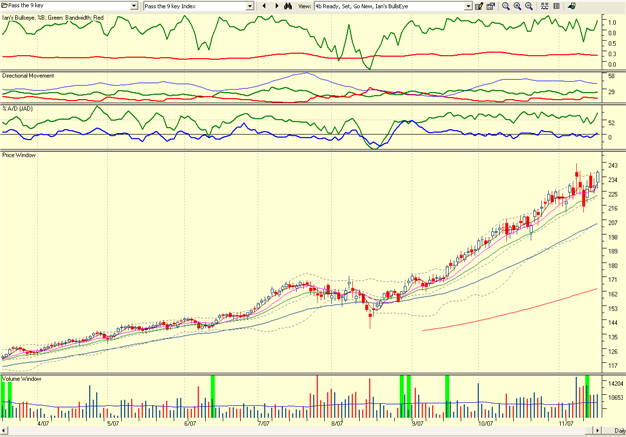
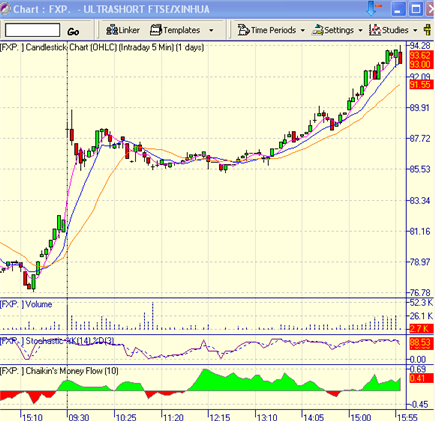
Net-net, the pictures tell me get in fast and early, the volume is solid for today, and the FXP has stayed locked in a controlled zone and is harmless for today.  If it gets above $80, I would begin to take some action.  Tomorrow may be another story but the Bulls made good money today.  With the Nasdaq closing at its high and the DOW up 319 points, we may see a follow through tomorrow.  Best Regards, Ian

The Party’s Over, It’s Time to call it a Day

Monday, November 12th, 2007

Party Cartoon

Over the weekend I mentioned that “the Chinese Silverbacks I gave you the other day have collectively given up 9.15% in a week”.  Well I have news for you that the same group is down 19% and if you were keeping tabs on these, then you might have been a star performer if you picked up on my other statement which said “Late breaking news says there is now an Ultra Short Chinese ETF called FXP, which came out today.”  Here is its one-day performance:

                 FXP

  I concluded by saying “Net-net, I can’t make a silk purse out of a sow’s ear.  The prudent approach is to wait and see till the dust settles and sit on the sidelines, UNLESS you enjoy volatility and know how to use your trump card which is “Nimble”.  If you do, then sharpen your pencils for both sides of the coin, shorts and longs and you will do extremely well if you make the right calls quicklyYou judge for yourself where the odds are right now with the picture below.  There is more to go on the downside before it gets to the OK Corral again.  Just watch the Red Line in the Sand.”  Well they cut through the red line like a hot knife going through butter and the Bulls are sitting at the 25 yard line as all spectators rush for the exits singing the same swan song “The Party’s Over”. I also gave you the Measuring Rods. 

The Measuring Rods:


 targets


As you can see from the above picture, we are practically at the 10% level on both Indexes, with the S&P 500 finishing at 1439.18 and the Nasdaq at 2584.13. Those who made big money today were in the ETF’s Ultra Shorts and especially FXP, followed by QID, SDS and TWM, but the first two have been the big winners.  I’m sure there are plenty of others, but you get the gist of the message.  Complacency is over, buying the dips on the favorite Silverbacks are over and now we have to wait and see if we can spot the rotation, or whether eventually they will come charging back into these beaten down warriors. We can expect the gurus will tout the big horsemen like “GOOG, RIMM, AAPL and GRMN” and of course one should look for a safe entry point on these and other favorites.  At some point these would be a worthwhile gift for long term buy and hold types, but wait till the dust settles…they have lost 15 to 30% from the top.

 For now the Technology Leadership is lost and you can rest assured that the bottom fishing value types will be patiently rubbing their hands and are already making some hay.  Why do I say that?  Well after the dismal performance of those 15 stocks I gave you last night to watch first thing this morning, we quickly got our answer and it certainly was not to buy any of those stocks.  To get an insight on the fly of where the action was today, I took a list of some 635 stocks which have already had their Earnings Reports out since August, 2007.  I then split them into five groups with accumulation “A” through “E” and ranked them using the Gorilla Fundamental Combo which you should all have if you have downloaded Ron’s latest files, and took the top 25 stocks from each Group.  Here is the snapshot of their performance at two points in time, around 12 noon Pacific Coast Time and at the close an hour later:

   accum

 It looks like nobody won at the end of the day, but the bottom fishers were out looking for value.  I happened to see the beaten down Fallen Angel VDSI made 14.56% today, and some of the Home Builders were up.  Different strokes for different folks.  Best regards, Ian.

Copyright © 2007-2010 Ian Woodward
Disclaimer: Commentaries on this Blog are not to be construed as recommendations to buy or sell the market and/or specific securites. The consumer of the information is responsible for their own investment decisions.