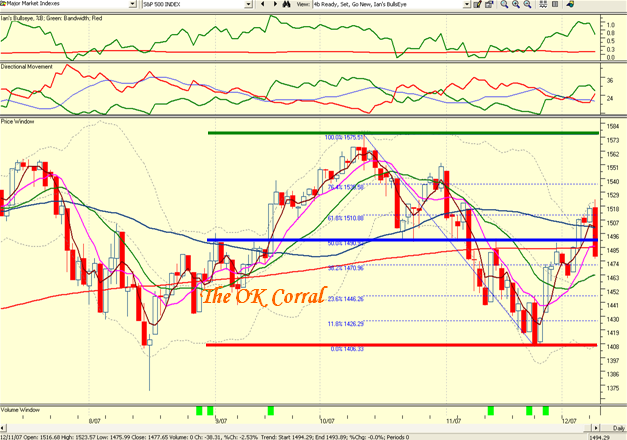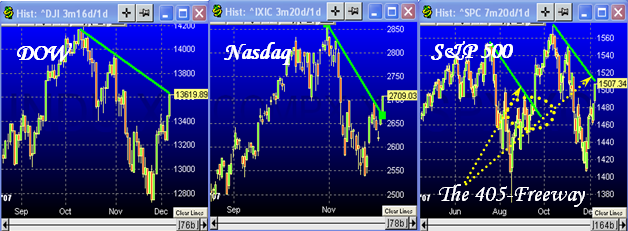
I felt it was time for me to write an HGS Investing Solutions Article on the value of the concept I developed called “The 405 Freeway”. As those who have visited Los Angeles know only too well, the 405 Freeway runs from Santa Monica in the Northwest to San Diego in the Southeast. It is the biggest parking lot in rush hour traffic you would find in these parts of the woods or for that matter in the world, and in Investing terms that would spell strong resistance to breakouts. In doing the blog yesterday where I show the value of the 405-Freeway, it struck me that the recent examples we have lived through since the Base Low of August 16th, 2007 give us a classic picture for describing the essential ingredients an investor faces after an Intermediate Correction. History never repeats itself exactly the same way, but it comes close enough that one can usually identify three alternatives after an Intermediate Correction:
- A “V” bottom is the rarest chart formation and is more likely to occur early in a long bull rally than at the later stages.
- A “W” bottom is the more frequent formation where the previous low is retested before the low is confirmed and the new rally is on the way.
- An Inverse Head and Shoulders formation as shown on the chart below, which is a hybrid of the other two.
The psychology of the herd before a market bottom is confirmed is naturally one of more fear and less greed. On August 16th you will recall that we were at panic stations and many were throwing in the towel when the FOMC came to the rescue. We had experienced two Bingo days in a row at the lows which culminated in a long spidery leg as the market drove back to recover most of the losses on August 16, and then moved up the following day.
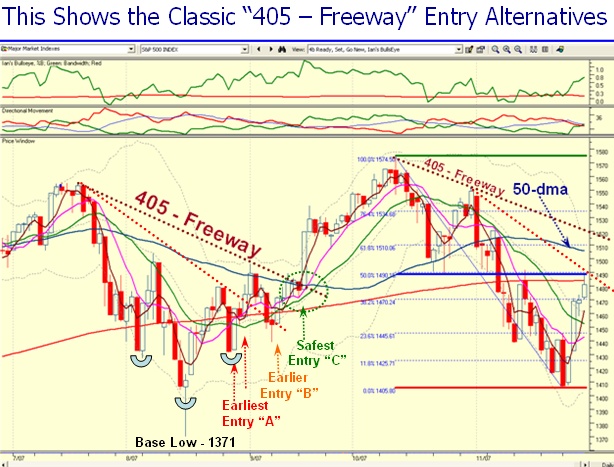
The Best Stakes in the Ground at this stage is the Base Low and the 50-dma, and hence the best measuring tool is the High Jump, or in this case the Limbo Bar or Low jump…since the Index is below the 50-dma. At its extreme this measured -5.64% and was the lowest it had been since it recorded -4.36% on 6/14/2006. That in itself should indicate that the Index had a significant challenge to get back above the 50-dma, especially as the Index had also broken the 200-dma by -2.61%. My point is that even with a powerful move back up it would be too far to come back to break through the 50-dma to produce a “V” bottom from such a low starting point.
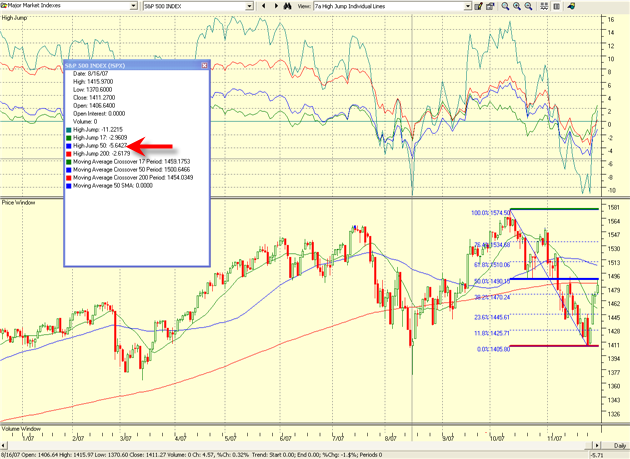
From the first rally attempt off a Base Low to the start of a pullback is for nimble day and swing traders. It gives the best gains in the shortest timeframe but has the highest risk. It usually lasts 5 to 8 trading days. It is when leaders for the anticipated rally to come define themselves. However, it is also the period when those same leaders will invariably correct, before moving on to become the true Silverback Gorillas for the move. Stocks like GOOG, AAPL, RIMM, GRMN, FSLR, POT, MOS, BHP, SIGM and BIDU become the stocks with halo. These are the types of stocks one should find at the onset for the best longer term ride. Likewise favored Wolf Packs also emerge. It started with the Energy Alternatives (way earlier), followed by Chemicals – Specialty, Transportation – Shipping, Chinese Silverbacks, and what we dubbed as Gorillas in general as exemplified by the Gorilla RonIandex. Understand that at this stage of events there is a balance between Fear and Greed. Since this is at the end of a long bull rally that started back in 2003, the likelihood is that the length of the move would not be more than two to four months. The longer you wait, the less the reward, the quicker you move in the more the risk. Only your stomach can tell you your risk/reward preference, and you must best decide when to make your move:
-
Leg 1. The Earliest Entry off a 405-Freeway is on the “Follow-through Day” ANTICIPATING a breakout above the steepest downtrend line shown in red. Alternatively wait for the Index to break up through as shown by the second red arrow. The longer you wait, the more the risk of the next pullback. By now the Index should be close to the 50-dma, so the expectation is that it will correct due to the resistance at the 50-dma.
-
Leg 2. The orange arrow shows the next entry point where one is again ANTICIPATING the breakout above the 50-dma and the latest 405-Freeway downtrend line.
-
Leg 3. Finally the Safest Entry is the actual breakout above the 50-dma as shown by the green arrow, but if the rally is short half the opportunity is lost – note the distance from the breakout to the top at 1575. By that stage the leaders are long since gone and one played these and second string up and coming stocks on pullbacks. Also the Earnings Reports were out in droves by then and there were new stocks making their mark.
The question now is “How do we apply all these tenets to the current situation?” We can immediately see that the Limbo Bar results are much the same as before with a reading of -5.25% and -3.65% for the 50-dma and 200-dma readings, respectively. We have four days up in the rally, and the S&P 500 Index is just below the 200-dma. The challenge it faces is to break through both 200-dma and 50-dma. Note also that the 17-dma is still facing downwards and that has to reverse itself if and when the rally continues.
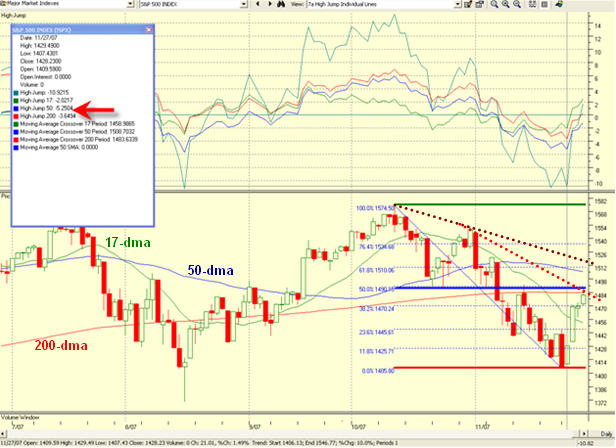
Essentially the first leg is complete and sooner rather than later we should expect a pullback and then comes Legs 2 and 3 through the two dotted lines representing the 405-Freeway downtrend line from the highs as described above for you to decide at what stage you tip-toe back in. Whether the Index pushes through the dotted red line early this coming week before a correction remains to be seen, but unless there is tremendous new news the odds are that there will be a pullback between the 200-dma and 50-dma, before we push through the top resistance line of the 405 – Freeway. Realize that we have the FOMC on our side, but the Technology stocks and especially the Internets seem to have gone sluggish with more defensive Industry Groups as Healthcare and Utilities showing signs of life.
In summary, after at least an Intermediate Correction, expect three legs up before the final push through the 405-Freeway, with a “V” bottom, a “W” bottom or an Inverse Head and Shoulders formation. Look for the follow through day either by way of a Eureka signal and/or the normal strong follow through day once the bounce play is initiated. Keep an eye on the relationship of the Index relative to the 17-dma, 50-dma and 200-dma and the extent of the Limbo Bar readings to make the call of when to act. Now let’s hope the fun begins on our way to a Santa Claus Rally…but at least you are prepared for any eventuality north or south of the 405 – Freeway! Best regards, Ian.
 Ian Woodward's Investing Blog