Ian Woodward's Investing Blog

Archive for April, 2008

A Review of the Market and the VIX

Thursday, April 17th, 2008

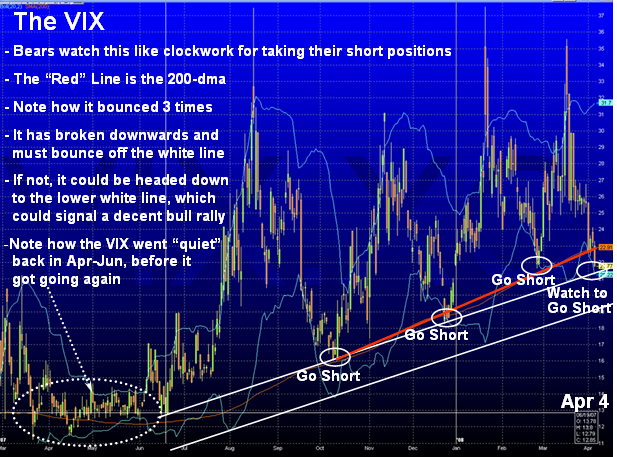
Last weekend I gave you a plan to watch how the VIX faired for the Bulls and the Bears to place their bets accordingly.  Well, so far the Bulls are winning:

dogs     

  • You will recall I gave you three Targets and none of them have been met so far, so we are trotting sideways on the VIX in a trading range.  They were: 
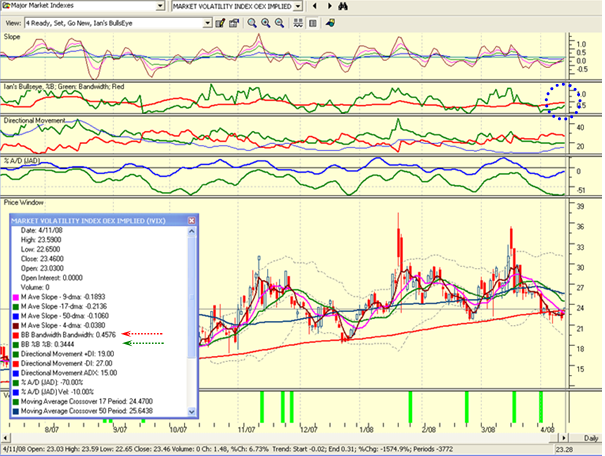
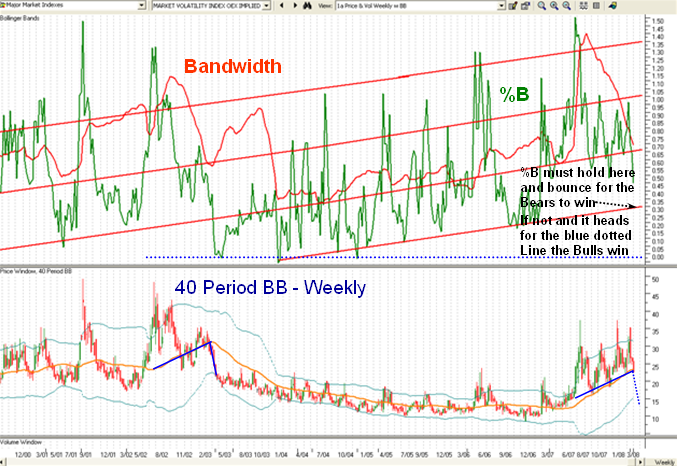
    1. A VIX reading of 24.10 from its then current reading of 23.46.  It came within a hairs-breadth of that and then fell back.  Therefore, it did not breakout above its Bollinger Band Bandwidth, and hence no cigar for the Bears. 

    2. The second requirement was a 0.24 % B 1-Day Chg to the Upside which would have the Bears Dancing…wasn’t going to happen after it failed the first test, above.

    3. The most exciting one is a -0.24 %B 1-Dy Chg to the Downside, which spells a Little Kahuna which would have the Bulls Prancing.  I have news for you…it hit -0.21 yesterday which is close enough for Government Work, and so the Bulls danced and pranced yesterday and they breathe a sigh of relief for now based on the INTC and IBM Earnings Reports.  You will note that the VIX is close to the Lower Bollinger Band at this point, and the bulls are looking for it to either break it further to the downside or at least stay dormant.  If it bounces from here…well you know the drill from here by now.

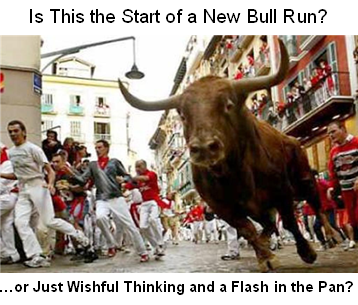
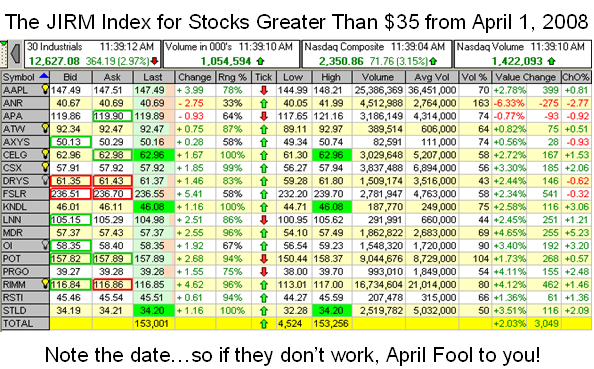
    4. So the good news is that the Bear Market Rally is for the time being still intact and of course, you all know that the favorite Wolf Packs of Chemical Specialty, Solars, Agriculture and Steels are all trotting higher.  One of our newbies said he didn’t know what a Wolf Pack is?  That’s surprising when we have talked about them throughout this blog.  Just look at the performance of the JIRM Index which I put up for you on this blog two weeks ago and you will see those are the types of stocks to be in right now.  With INTC and IBM both clearing away the gloom and doom of GE’s EPS report, the Market is in the HGS Investor’s sweet spot. 

    5. So much for the good news and it seems that this market wants to go up despite all the gloom and doom of a recession, the price of gas and also food, the weak dollar, and a litany of other things.  Then as the saying goes, the Market climbs a Wall of Fear.  Please understand that we are by no means out of the quagmire as yet and have only barely scratched the surface on the return journey for the Major Market Indexes. 

    6. If the flood of Earnings Reports continues to give Upward Surprises for the next two weeks, we may have a chance of a decent Bear Market Rally going into the summer doldrums when all of Wall Street go off to the Hampton’s for their weddings, graduations and vacations.  But setting all of that aside, I caution you to return to the Mark Pharr Chart as your guide for the longer term.  You will find it amply displayed and discussed on this blog and of course in the Newsletter.

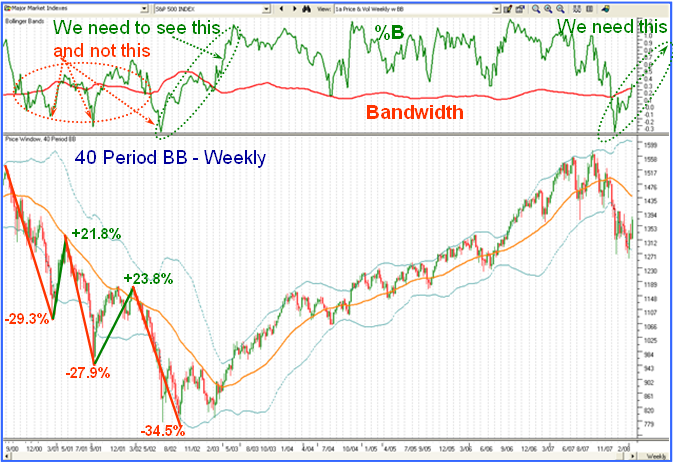
    7. We have only accomplished the first of the goals I set, which was the %B must first climb above its bandwidth on a 40-week Chart.  It needs to get well above the middle Bollinger Band before we are in the all clear and out of the woods for the longer term players to take comfort on a New Bull Rally.  Of course, Type 1, 2, and 3, day and swing traders can play to their hearts content until we get the next negative surprise and knee jerk downwards. 

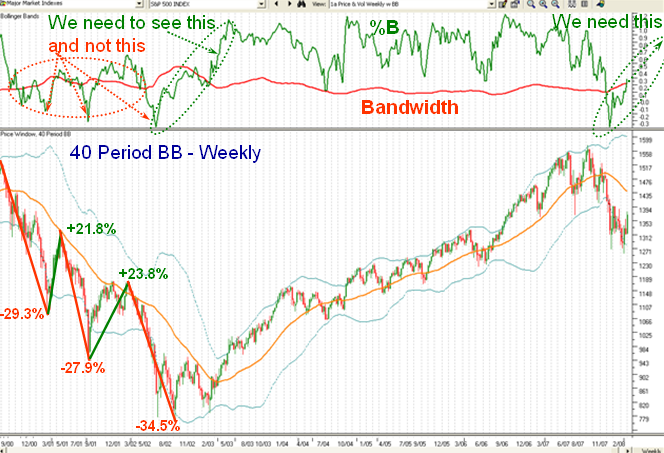
    8. The most important point will be when %B hits the middle Bollinger Band, as that is the time which will be most telling and will either prance through or as expected will fall back for one more test of the lows before we can determine whether we have already found the bottom in the market or that we go one more leg down.  Here is the chart I gave you before and it has hardly changed, so work with this one.  The Index must first get to the Orange Line before the real test begins.  In the mean time there is good money to be made and the sun is shining on the Bulls at this point in time, so enjoy making money while you can to the upside.    

    chart Best regards, Ian.


Whither Goes the Volatility Index – VIX?

Sunday, April 13th, 2008
  1. I am grateful to my Finnish friends from kestustela.kauppalehti that have pounced on an earlier blog of my musings on the “Long Road Back for the S&P500 written on March 23rd under Happy Easter Wishes.  Unfortunately there is no English translation on their site, so I am not sure what excited them to take a peak at my blog, but many thanks to all of them. 
  2. Here is a mailbag question from one of our Newbies at the March High Growth Stock Seminar, “It appears that the VIX has rebounded and not broken down thru the resistance. What do you think that means for market direction? Has it rebounded enough to continue the decline? the Newbie-Pete 
  3. Well done, you are learning fast and have now cast off your “Newbie” handle and fresh from the March Seminar, I dub thee “Oldie Pistol Pete”…you are one sharp dude, as my sons would say! 
  4. Everyone on this earth should be asking the same question, but you have come to the right place to find the answer.  Friday was a major set back for the Bulls, but the game is not over for them yet.  The GE earnings disappointment really took its toll, and any more of that scenario this week will certainly cause the rally to fizzle when it was looking so promising.   
  5. Now then, to answer you directly, it is close to rebounding enough to continue the market decline, but it is too close to call.  The VIX is currently still below the Bandwidth and it needs to break above.  Where do you find that you will surely ask?  It is all in the High Growth Stock Investor Software as the only place to find the answer, and we have made it easy for you if only you can remember to go to the right place.  Go to my trusty Chart View which is the standard I always use along with 9/10th of the people out there and that is the “4 Ready, Set, Go New, Ian’s BullsEye” Chart.  It used to be the 4b chart, but is now the first one in the series of 4 charts.  You will need to bring up “Major Market Indexes” in the Chart View along with selecting the Market Volatility Index and there before your beady eyes you will see that in the Ian’s Bullseye Window the second one down, the green line is BELOW the Red.  If you bring up your Data Window you will see that BB %B is 0.3444 and BB Bandwidth is 0.4576, so still below, as shown in the chart below:

vix 

  • And now the $64 question is “Ian, I want to be ready to go short or go long on Monday morning and I am in the process of getting my candidate list together right now…can you Help me? 
  • I won’t let you down but nobody knows for sure.  However, I will give you the conditions for the VIX for tomorrow and the week ahead that will guide you as to whether the direction is sideways, up or down and then all you have to do is sit back and enjoy! 

Conditions for the VIX for tomorrow and this week: 

  1. The minimum requirement for the VIX is a reading of 24.10 from its current reading of 23.46 for the %B to just be equal to the Bandwidth, i.e., green line touching the red line.  That will spell hope for the Bears and further concern for the Bulls. 
  2. The ideal requirement for the VIX from the Bears standpoint is a “Little Kahuna” of +0.25 up on the %B which would require the VIX to jump to 25.95, which would be tantamount to a major down market tomorrow and would be pretty obvious.   
  3. The ideal requirement for the VIX from the Bulls standpoint would be a “Little Kahuna” of -0.25 down on %B which would require the VIX to fall to less than 20.20, or essentially very close to the lower Bollinger Band to continue to give major hope for the rally to continue. 
  4. So the answer is that anything up big between 23.46 and 25.95 for the VIX, the Bears win.  On the other hand, if the VIX goes down big between 23.46 and 20.20, the Bulls smile with the bull rally continuing.  Anything minor in between, we go sideways.

Stay tuned Pete, as I must now feverishly turn my attention to the newsletter where I will focus on the value of the Kahuna in these difficult times.  But the most important priority for this afternoon is the Masters Golf Tournament at Augusta 🙂  Best regards, Ian

 Late Breaking News!  I have had a few comments from viewers and I refer you to the response I made to Dave in the Comments Section below to see my latest thoughts since posting this blog.  Net-net, the VIX %B has not even broken through the Bandwidth which was the first target I set, so we sit and wait!  Meanwhile enjoy the Hot Wolf Packs.  Best regards, Ian.

A Ray of Hope for a Bull Run in a Bear Market

Saturday, April 5th, 2008

Don’t get too excited, but the HGS Investor Seminars invariably lead to a bull run, and it seems that this one just finished last weekend is no exception.  One week does not a Bull Run make, but there are distinct signs that the Market sloughed off the bad news of the rotten jobs report and for the time being we seem to have all Market Indexes flashing “Green”.

bull run

  1. At this stage of events it has to be wishful thinking, but at least there is some encouragement if we are to judge this past week’s progress in the JIRM Index which we developed last weekend for Stocks above $35 which we are using as a yardstick to measure the health of the market.  I featured this in my last blog and you will be pleased to know that it has delivered 6.17% vs the S&P 500 of 4.15% based on equal dollar weighting.  More importantly every single one of the 18 stocks selected is positive.  That suggests that the types of stocks we favor are in the sweet spot.

  2. Please understand that a flood of Earnings Reports will be out in another three weeks and that will set the tone for whether we slouch back into a bear condition or that we see some renewed enthusiasm on that front.  As I discussed at length at the seminar, the Earnings are falling from under us at every month’s new surprises such as GM and Sears both taking hits to take the S&P 500 earnings estimates down.  I showed you chapter and verse as to why the S&P 500 touched 1270 and why it could quickly drop to 1150 if we do not quickly see a repair on this front. 

  3. But enough of that, and although Type 1 and 2 traders are already making hay while the sun shines, Type 3 Intermediate term swing traders are wondering if they dare put their toes in the water.  Type 4 Investors are still waiting for more signs of confidence that things are firming and so they should.  A winky-winky is not to neglect those HGS Boxes stocks greater than 0 (and especially Box 7) that timhiggit gave you last week.  Just take an EPS Rank and Grp Rank of 80:80, a A/D greater than or equal to C, Bongo Daily signals that have fired in the last 15 days, and above all a %E/P TTM of >3, and a % Dem/Sup of 0.9 and you have the cream of the crop.  You see newbies…it is not difficult to concoct a potentially winning scenario on the fly using HGSI software.

  4. Now let’s move on to a more important matter.  How does one get a handle as to whether this past week was just a flash in the pan or that there is indeed a fresh Bull Run in a Bear Market or whether the ride will fizzle out in a matter of days? In which case we will be back to the same old scenario of three steps forward and two steps back or worse yet the other way around as it has been for several weeks.   I offer you two weapons and three charts for this immediate week to come and they should tell us the story of whether the Bulls or the Bears have the upper hand.  One is the 40 period Bollinger Band Weekly Chart I showed in an earlier blog and also covered with a five point plan in the Newsletter and the Seminar…the famous Mark Pharr Chart.  The other is the jolly old VIX, which has worked well for the short term traders switching from long to short routinely for the last eight months, and has been a dead give away until NOW! 

  5. Given that we had yet another Eureka last week which almost went un-noticed, that Bongos have fired on all Major Indexes, that Industry groups are perking up, and that the New Highs are improving but not very strong as yet…you get the idea, we might have a changing of the guard from the grip of the past several months.  That grip is better seen in the second chart, but more on that in a moment.

sandp 500  If you look on the left hand side of the chart, you can see that one can have a decent bull rally in a Bear Market, which gets turned back at the “orange line of 40 periods.  In the 2000-03 bear market we had 21.8% and 23.8% up legs as shown…so the hope is that we might be on one of those legs.  We will know if it gets turned back if %B gets no higher than about 0.5 say.  In which case, after a decent move we fall back into a bear market mode again as show heading down.  The other scenario is that we are already at the bottom and the momentum picks up to drive %B up to over 0.7 or more in which case we are at the bottom of the Bear market and on a new Bull Run…the wishful thinking scenario.  All of that is shown by the green dotted ovals for you to compare and hopefully agree with my scenario. The message from this chart is that the first item of the five point plan I gave you is already behind us and we have to see if the %B coming up through the bandwidth continues upwards. This next chart shows how you can time your moves to either go long or go short and has worked well for short tern traders for the past eight months.  It has worked like clockwork.vix

The words on the chart says it all, but if the VIX breaks down badly and heads for the second white line, this may well be a change in sentiment and we could look forward to a decent rally.  Watch for either a bounce in which case the bears are in control again or for a drop in which case there may be a good rally.  Now the way to get a better handle on whether it is one or the other is to look at the VIX compared to the Bollinger Bands, %B and Bandwidth as shown below:

bbs vix The bottom line is to keep a beady eye on the right hand side of the chart and see if what I say on the chart occurs.  Now you have a watertight plan! Best regards, Ian.


Fresh from the HGS Investor Seminar…The JIRM Index

Tuesday, April 1st, 2008

jirm

  1. A great time was had by all at the HGS Investor March Seminar, and hot off the press, I am posting the fruits of our labors.  The newbies at the show now understand the language and the repartee Ron and I have with each other and with the attendees, and as the caption implies we might be spreading our “JIRM’s” by this early heads-up for all our supporters. The title was made up by the initials of first names of four of us, including our good friend and biggest fan…Manu.  So, if this Index goes sour on us you can blame him, since without his help the acronym would have made no sense on the intended pun! 
  2. In case you get the impression that these three days are all fun and no substance, just think again.  Besides learning about the HGSI Suite of Indicators, we had an intense review and understanding of the pulse of the market, all the files, filters, combo ranks and chart views which Ron has developed, where do we go from here and what to look for with targets set for the Game Plan ahead.  The newbies will now understand the jargon I am prone to use including winky-winky, flicky-flicky and other Good Stuff!  
  3. But enough of that except to say that the next seminar will be from October 25 to 27, 2008, so put it on your calendar and we hope to see you then.  As you well know for the past 15 years I have offered what was originally called the Iandex and since 1999 became the RonIandex.  This is usually a list of 20 Leaders in the market that are selected to give an EARLY WARNING that the Market is over-extended and when all get hit the Index will plunge for a heads-up to take heed. An excellent example of this was the 10142007 Gorilla RonIandex which has been shown and mentioned several times on this blog and in the newsletter.  In that case back in October, it gave an excellent signal that all was not well, though as faithful readers of this blog know only too well, when the market is on a strong up day, the herd comes screaming back to buy these very beaten down stocks.  The Index is up 3.95% today at 11.50am PST, so go do your homework in past blogs to find the RonIandex. 
  4. However, on this occasion, we felt we would try something different and I am showing you below the JIRM Index which was a Case Study the attendees did led by our good friend Jeffrey Scott to find potentially strong candidates that were showing some signs of life in this rotten market.  Take it at face value for what it is and don’t blame us if you get germs from it.  Here is a snapshot of the Index components which on a 100 share lot per stock basis is currently up 2.03% on a strong up day in the market as I write this blog at 11.39am PST.  Ron and my usual disclaimer is that we do not tout stocks, but try to show examples of the fruits of our labors through his weekly movies, the newsletter and this blog.

chartThe HGSI Team sends many thanks to all our strong supporters for keeping us young at heart and fresh in spirit as we move us all forward to higher goals in the future. Best Regards, Ian.

Copyright © 2007-2010 Ian Woodward
Disclaimer: Commentaries on this Blog are not to be construed as recommendations to buy or sell the market and/or specific securites. The consumer of the information is responsible for their own investment decisions.