 Ian Woodward's Investing Blog
Stock Market – Itching to get back in?

Type 4 Long-Term Investors are safely tucked in their Foxhole waiting for more signals to confirm this is at least more than a Snap-Back Bounce Play and do not want to be caught in a Bear Trap. Type 3 Intermediate Term are itching to get back and have ants in their pants.
I suggest it would be prudent to wait for one more week to decide whether we have a Santa Claus Rally or fall back into the doldrums, especially as the Election is next week. Type 1 and 2 short-term traders will continue to enjoy the volatility on both the long and short side of the market.To help you make up your mind, I have developed a short-term perspective of where the market stands now that we have had two weeks to reflect on what has transpired since the big dive to almost a 50% drop from the Highs of Last November. Let’s review the bidding of key events:
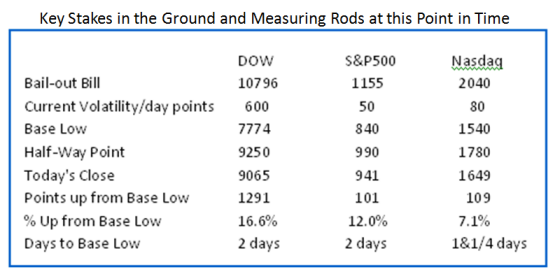
1. The Bail-Out Bill was passed on October 3rd. and the Stock Market crashed a week later
2. In the process we got a good feel for the Volatility which increased four fold from six months ago
3. It is not uncommon to see 600, 80 and 50 point swings/day on the DOW, the Nasdaq and S&P 500, respectively
4. As expected we had a snap-back in two days that produced over 23% for these Indexes
5. Then the market re-tested its Base Lows within two days, but basically held at that level
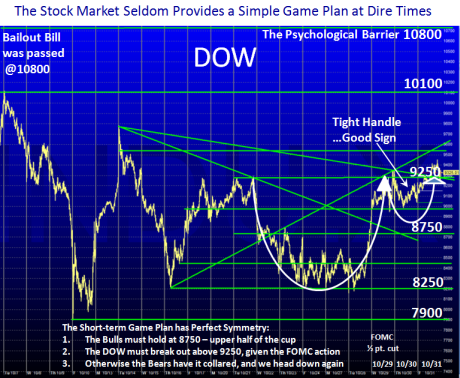
6. Helicopter Ben came flying in and propped the market up with a 1/2 point cut in the Rates
7. This has buoyed the market to hold the snap-back at the down-trend line half way back
8. The Critical Line in the Sand I offered is 9250 and the DOW is there abouts right now
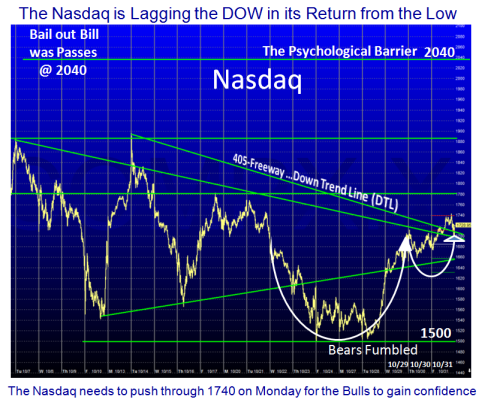
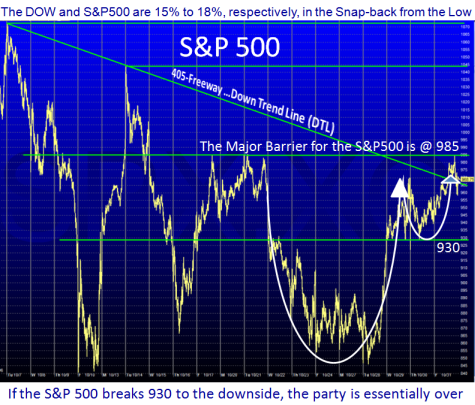
9. From the following three charts, we are at a critical point on all three Indexes…Enjoy
A couple of blogs ago, I gave you the key yarsticks to keep an eye on, and here it is again:
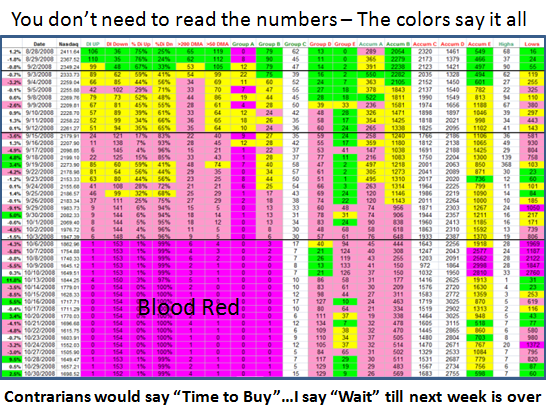
Now there is both good news and bad news if you dig a bit deeper on the Internals of the Market. Those who eagerly look for Breakouts from “Big Stocks” with good credentials have been disappointed so far, though things have been perking up with a few stocks showing signs of life. It is no wonder when I show you the key internals that one looks for at times like these, which include the % of Industry Groups that have Di+ and D- which is totally negative. Likewise Industry Groups that are above 200-day and 50-dma are also putrid as is the Groups with either A or B Accumulation which again are the piths. A picture is worth a thousand words and that is clearly visible by the deep pink in these factors over the past 15 days or so:
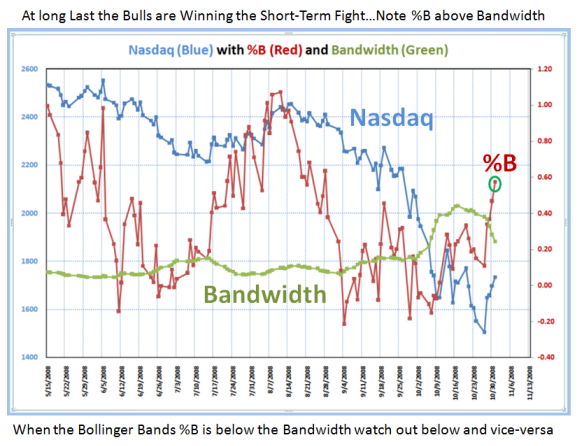
Now for the good news for those who wish to be the early bird that catches the worm. I have told you time and time again to watch %B relative to the Bandwidth of the Bollinger Band Indicators. %B is above and as you can see from the chart below, it is showing strong signs of life as it has already crossed the middle band to the upside. If that relationship of the two Indicators which I have dubbed the Bulls-Eye can hold its positive status next week, we have the makings of at least a Bear Rally.
Those who attended the seminar last weekend understand all of this in spades, but I felt this would bring the rest of you up to speed on the essence of what they learnt to look for.
Best Regards, Ian
