 Ian Woodward's Investing Blog
Stock Market – Is there a Chance of a Bear Market Rally?

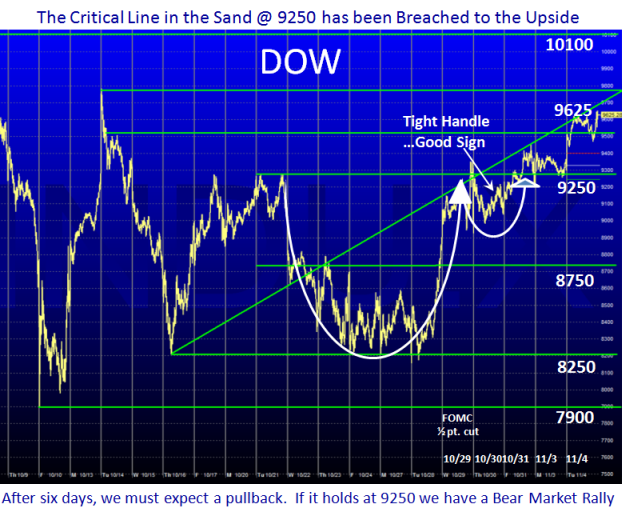
A week ago I gave you the important Lines in the Sand to determine if the Bounce Play would hold or drop down to re-test the recent lows. With six days in a row of positive gains the market as shown by the DOW has broken out of the Key Resistance Line at 9250. Before one can count on a change of short-term sentiment to the upside, we must watch the extent and depth of the pull-back that is occuring today. If the Market can hold at 9250 over the next few days, and bounce off that level, we should expect a run for a Bear Market Rally. Anything lower than 9000 and the Bounce Play is suspect and we would most likely re-test the lows.
I have selected four charts which should show you that the Internals of the market have improved this past week but the caution is that we are by no means out of the woods.
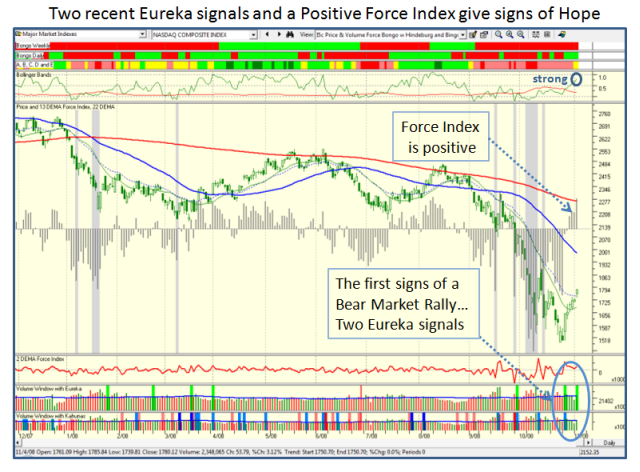
1. The first and most important signal the Bulls have been waiting for is that we have had two Eureka signals within a week as shown by the green bars on the Nasdaq chart below. A Eureka signal is music to the Bulls ears as it is a sign of irrational exuberance on their part and a signal that there is buying enthusiasm off a Market Low.
2. The second item is that the Force Index has turned positive the last four days.
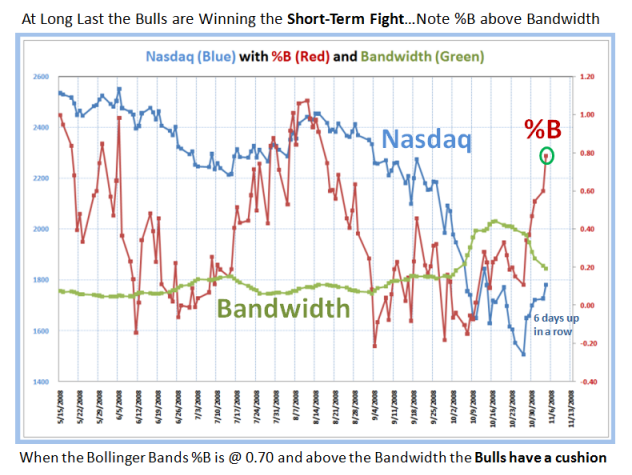
3. The third item is that the Bollinger Band %B is now at 0.80 and this gives breathing room for the Bulls before it should retrace to the downside.
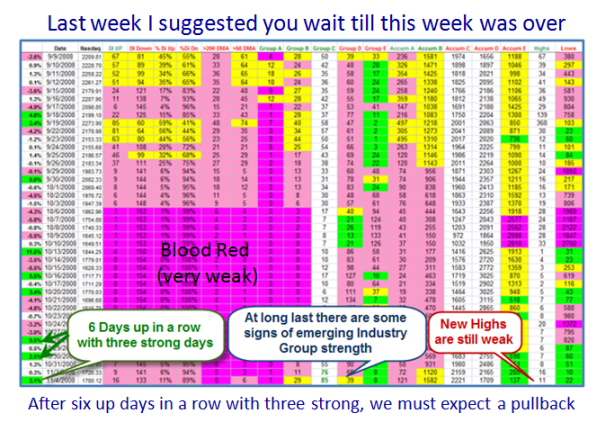
4. The next chart shows the improvement, albiet slight in the Industry Group Internals. There has been a decided shift in those Industry Groups that are under distribution towards Accumulation. There are none with “E” distribution, though we had a major shift yesterday towards D and C. However, please note that the number of New Highs are still very low as would be expected with the devastating downfall the market took three weeks ago.
5. In my last blog I finished up with a “Ray of Hope” chart which I have updated below for your convenience. It shows that %B of the Bollinger Bands is now at a lofty 0.80 and this will give a decent cushion before it could retrace towards the Bandwidth line. Note how this latter line has come down dramatically from the record levels above 0.40 of two weeks ago, which demonstrates that the volatility has subsided somewhat. That is all relative as we are still seeing 300 point up and down days in a row as witnessed by yesterday and today.
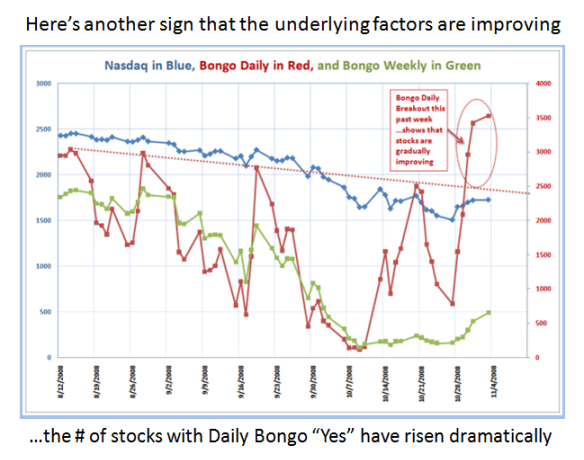
6. Finally, I show the marked improvement in the # of stocks with Bongo Daily “Yes”, implying they are approximately above the middle Bollinger Band, which usually serves as a springboard for better things to come in selected stocks.
In summary, the key points to watch are:
a. The retrace must be held at or above 9250 for any hope of a Bear Market Rally
b. There should only be small dents in the factors I have shown you in the above charts for the rally to continue
c. We could do with a further Eureka and also a major improvement in the number of NYSE New Highs
d. This latter item must consistently stay above 100 with the # of New Lows below 50
For the intermediate and long haul, I do not expect this market to give a gigantic leap forward for the Bulls; rather we will probably see a long drawn out struggle for the next year as the overall Global Market conditions hopefully repair themselves from this financial debacle we find ourselves in. At least the Libor rates have come down significantly which helps confirm that some positive results are being felt in the credit crunch situation. I strongly suggest do not jump the gun until there is a second attempt at a rally and even then play it close to the vest.
Best Regards, Ian.
