 Ian Woodward's Investing Blog
It’s Very Clear our Volatility is Here to Stay!
With apologies to George Gershwin and an old favorite tune many moons ago which Gene Kelly danced with Leslie Caron on the banks of the Seine, I’m afraid our Volatility is here to stay forever and a day! Times have changed and we will need to get used to seeing 300 to 600 point swings a day as commonplace on the DOW, 50 to 80 on the Nasdaq and 25 to 40 on the S&P 500. Likewise, 20% knee jerk moves within a few days both up and down should also be expected to be commonplace. It will be a while before this volatility subsides.
The following is a spreadsheet of the nine other Bear Market occasions where the “Swing Down” has been greater than 20%, followed by a Rally Up and then a re-test of the Lows . The picture below is worth a thousand words and confirms the expected odds:
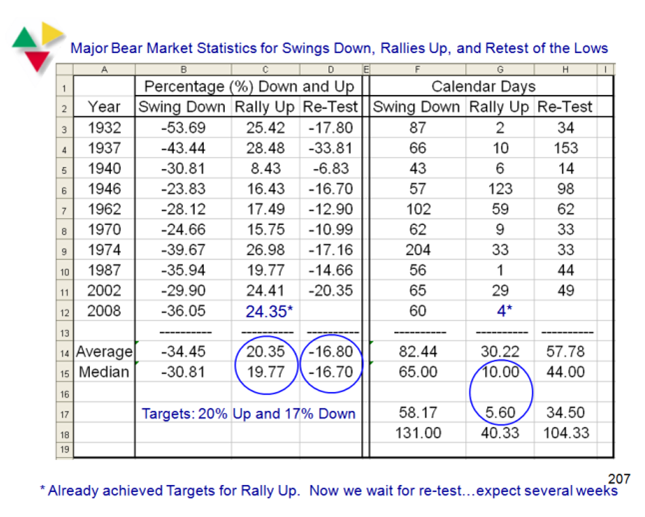
I have shown the % Gain/(Loss) and the calendar days for each step down, up and down again. As you can see on the left hand side, the average and median numbers are so close to each other that the probabilities of these numbers occurring are high. On the right hand side, the days are all over the place, but if you look at them carefully they fall into two camps, short and long term.
Another point to notice is that the re-test is invariably less than the Rally Up, which suggests that we have probably found a bottom, unless there is some other major global surprise that raises its ugly head. The Bounce Play occurred in two days flat and the re-test started on October 14, 2008. It is now a month since that high, so we are on track to seeking a bottom soon.
The above statistics are for the S&P 500. Note I am using 17% down based on the above for the re-test of the Lows; anything worse than that suggests 2002 like numbers of >-20%:
The Key Lines in the Sand to the Downside are:
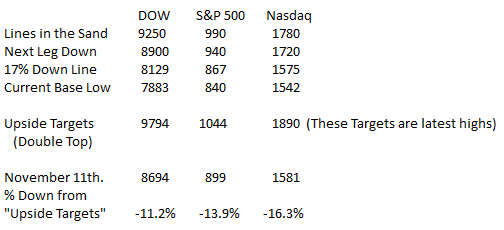
We can see that we are just 6 points away from being 17% down on the Nasdaq, and no more than one day’s worth for the DOW and S&P 500. As we can see, the DOW has behaved the strongest in this past month with the Nasdaq the weakest. It has been 29 days since the re-test started and as one can see from the table, three of the readings are 33 or 34 days for previous re-tests, so we are on track! We must hope that this will not end up with another crater to the downside, and that we will see no worse than a Double Bottom for now before we head back up.
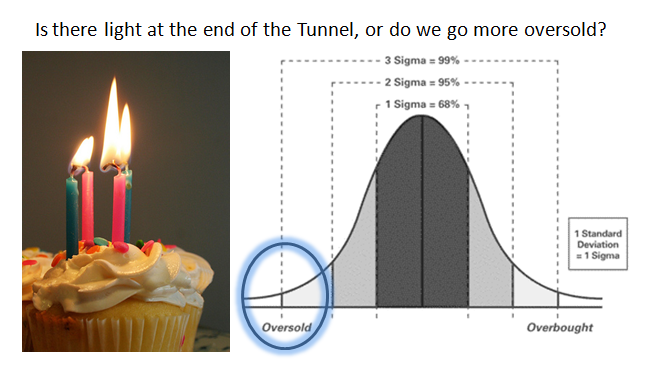
The $64 question is “Are we close to the end of the gloom and doom or do we head down further with more misery in store before this market can recover into a Bear Market Rally?”
The market started to drive up last week where two Eureka’s accompanied by Kahuna’s showed some signs of recovery underway. Once that trend upwards was broken to the downside as we witnessed these past three days, the whole process must start again, so we must look for a Reversal Day as the first step in the recovery process. We first look to Capitulation with a Spike in New Lows which is currently at 324, but could get as high as >1000, then look for a Reversal Day, and a Follow Through Day thereafter. The short answer is to take it a day at a time for the moment as the market is still too jittery to give a clear indication of the start of a bear market rally.
Best Regards, Ian.
