 Ian Woodward's Investing Blog
“Whither Goeth Volatility?”
Question: Mike Orlyk Says:
Ian – I am trying to understand your statement “seeing 300 to 600 point swings a day as commonplace on the DOW, 50 to 80 on the Nasdaq and 25 to 40 on the S&P 500″ in context with the remainder of the blog. Are you saying to expect such swings until a bear rally finally manifests itself?
Also, within the past swing down/rally up/re-test shown in your spread sheet was the volatility, at least on a percentage wise basis, equivalent to what we are seeing today?
Thanks, Mike
Reply: I am saying that the Days of Wine and Roses regarding Volatility are long since gone and we will not calm down for a long while to come. I doubt if the wild swings will change when we start a Bear Market Rally. It is far more likely that it won’t calm down until we see a NEW BULL MARKET Rally, which to my mind is at least 6 to 9 months or even a year away.
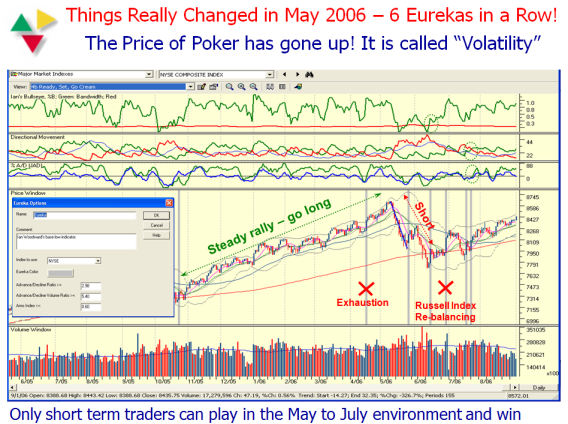
The only Measuring Rods I can offer to answer your other question is to take you back in time to May through July 2006, when we first noticed a string of six Eurekas in a row which we ultimately found in hindsight was due to excessive volatility and no fault of
the Eureka Indicator. After a long hiatus, So far we have had three Eurekas in quick succession, so you can immediately see a similar pattern.
The second Yardstick I can offer you was in the March Seminar where I showed a chart of a Day in the Life of a Day Trader and at that time the swings were 150 points a day:
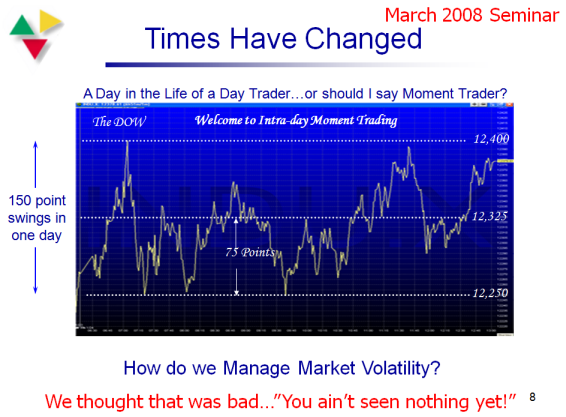
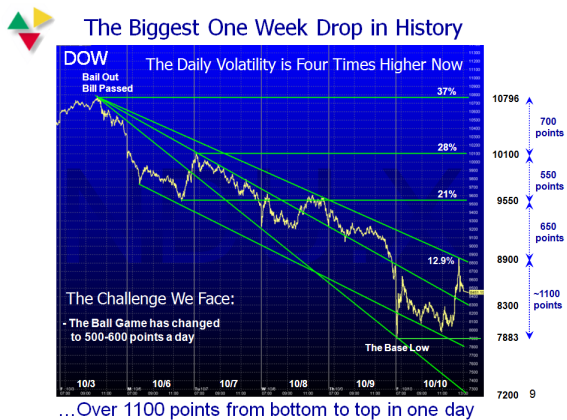
It goes without saying that was chicken feed to what we have now where the Volatility had increased four times at the time of the precipitous drop we had a month ago. It is half that now in terms of daily swings, but at the next sign of a crisis we can experience
going back to 600 to 1000 points a day or two days at most.
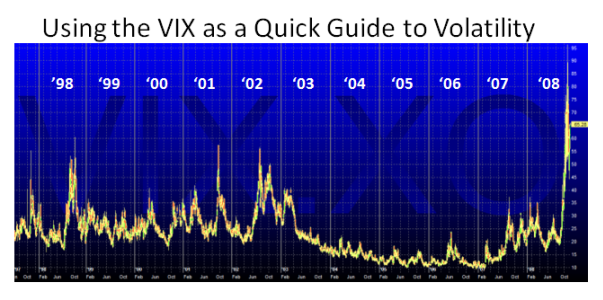
Of course the VIX pundits know all of this only too well and point to the VIX chart as a quick confirmation that times have changed and that is the quickest way to get a feel for the picture over time. To my beady eyes it suggests at least a “twofer” compared to the
2000 to 2003 timeframe:
So what has caused all of this? I think I mentioned at least three items, one of which is the rage in playing double and now triple ETF’s and the second is the “No Uptick” rule for shorting. The third is the natural jittery market conditions due to Uncertainty. That
item is always the killer. Bears romp around while the Bulls stay in hiding.
I’m sure the pundits of 1987 can wax eloquently on volatility of the crash, but I was still working for a living back then and was not into such esoteric items when my 401K took a dive that set me back a couple of years at least in one week flat. Fortunately my sons are in better shape this time around with the “ole man” to guide them.
My point is don’t expect calm waters until 2010 if past history is anything to go by. Therefore it plays into the hands of the Type 1 and 2 Moment and Day Traders for a long while to come. Type 3 Swing Traders will look for the key signs covered in the Newsletter by Ron and I for a Bear Market Rally. Type 4 Long Term Buy and Hold types can hibernate for a while until we see a Golden Cross of the 50-dma coming up through the 200-dma.
Best Regards, Ian.
