Ian Woodward's Investing Blog

Archive for December, 2008

Santa’s Sleigh got Lost in the Fog!

Thursday, December 11th, 2008

rudolf

It looked promising to start with but then there was too much fog to get through 915
on the S&P 500.  Although the Chart Pattern is still intact, it is hanging on by a thread.
The VIX stayed relatively quiet, but the Indexes still clocked  > -2% for the day.

lost chart

Types 1 and 2 play to your heart’s content.  Type 3 wait for this to push through 915.

Best Regards, Ian.

The Santa Claus Rally is Looking Bullish

Wednesday, December 10th, 2008

santa

It is ten days now and the 4th blog in this series and things are looking up for a continuation of the current trend from the Base Low of 741 on the S&P 500.   It closed at 899 today after hitting the target of 915 which is the first Target I set in my last blog note.  So far, so good.

chart

I urge you to review the series of charts I have used as time has progressed these past ten days, after the Market gave up the ghost and went down a further 25% in a matter of 13 trading days.

1.  The first chart had an ugly Cup and Handle of a scant seven days and was close to breaking down.
2.  The second chart showed a Loose Darvas Box which suggested the key lines at 880 and 815.  It also established that the correct spot for a breakout was above the 405-Freeway down-trend-line (DTL).
3.  This latest chart shows a cup within a larger cup and very tight handle as shown.  Not only must the cups tighten but also the handles as time progresses as it has in the last three days.
4.  Now we have a series of Higher Highs and Higher Lows and we can draw a Channel as shown.
5.  Note that the dotted middle line intersects at 950, which is the Next Target it must get to if the higher high and higher low scenario is to remain intact.
6.  Also note how 985 now comes into play as the Major Barrier which I stated on the very first chart.
7.  Finally, note how one can tighten the playing field to know when to really turn from short term to intermediate term bullish or bearish, while establishing confidence in the lines of demarcation.

Now I know that those who are rigid Cup and Handle types may be cringing that I have taken leave of my senses to even conjur up these formations measured over a period of 17-trading days when the minimum requirements are 6 to 8 calendar weeks.  My favorite saying is “When you have a good concept, milk it.”  Of course one cannot expect the same degree of confidence when measured in days, but beggars can’t be choosers so you work with what the market gives you.

Why do I bring this up?   It is the difference between a long term buy and hold Type 4 Investor or for that matter even a Type 3 Swing Trader.  However,  if one sits for the perfect set up which most would also suggest requires Leading Stocks with tight chart patterns, then it is tantamount to suggesting one is really a Type 4 and not a Type 3…you want jam on it and are not prepared to take a risk for short term rallies.  It is far better that Type 3 Swing Traders not get ants in their pants and dabble, because they just don’t have the stomach to take major risk and that is fine, since we all know how difficult it is with recent intra-day volatility which I focused on in my last blog note.  If you can’t stand 5% swings per day, don’t play.  It goes without saying that this market is not yet at a point that is conducive to identifying tight quality stocks with the proper ERG credentials breaking out from tight bases.  The charts are bent out of shape and most are beaten down.

More importantly, even the shorter term Types 1 and 2 can get guidance of how the wind is blowing, even though of necessity they sit with their hand on the buy or sell button glued to their screens.   Please understand I am trying to show you techniques of how to engage in a badly oversold market and by no means am I suggesting that we are anywhere near being out of the woods.

Now let’s turn our attention to the good news on why this fledgling Santa Claus Rally is showing signs of gaining legs.  I have tipped my hat several times to a combined effort by those who are both familiar with CAN SLIM and HGS Investor concepts in collaborating at improving the Follow Through Day (FTD) concept by bolstering it with other Indicators including the Eureka and Coppock signals.

eureka

For those of you who are feint of heart on the value of the Eureka, it is once again proving that in combination with the Coppock we might have at long last found the key to calling reasonable rallies.  It is far too early to say we are there yet, but the signs look good as shown above.

Now as you know I try to give an even handed picture, the Bears are naturally focusing on the Bullish and Bearish Sentiments which is heavily Bullish if one is to believe the Bloggers as show below.  Naturally they are poised to clobber the rally, and realize that although the put/call ratio on the CBOE is neutral, it seems the situation on the DOW is slanted to the Bears with more puts by over 2:1.  This can provide fuel for the bulls if the S&P 500 can get a spurt of a rally towards 950.  The Bear’s day will come:

blogger

The message in a sentence is that the Bull’s now have a “cushion” with which to make the call to vacate if the market goes against them, and the Lines in the Sand are well defined.  It’s Always “Your Call”.

Best Regards, Ian.

The Santa Claus Rally May Encounter Moose Droppings!

Saturday, December 6th, 2008

car

I hope you have enjoyed the Santa Claus vs Grinch Battleground notes.  Here is a further one in the series which has both a bright side and a strong caution should you be inclined to dabble.

As you can see from the chart below, although there has been a see-saw these past five days since I introduced this theme, the technical picture is improving in favor of Santa, even though the Indexes have all worked in a Loose Darvas Box as shown.  Note by the way the Nasdaq and DOW both have the same picture. 

The good news is that the final reading on Friday finished right at the 405-Freeway Down-trend-line (DTL) and ready for a breakout on Monday.  Although anyone in their right minds will tell you that this is no place for Type 4 Buy and Hold Investors to do a highland fling, at least early bird Type 3’s who have ants in their pants and are just itching to get over their withdrawal symptoms may risk a few bucks rather than go to Las Vegas and lose them at the tables.

santa vs grinch

Why on earth in all this Gloom and Doom would anyone want to dabble…albiet with high risk?

1.  The Jobs report is the worst ever in mumble years and

2. The Big 3 Auto Bail Out decision is still not completed though rumor has it that the Lawmakers could vote as soon as Tuesday on a proposal being worked out this weekend to help save the failing U.S. carmakers.

3.  Investors can expect little relief from economic data or corporate reports in the week ahead.

4.  From a Technical Analysis viewpoint, the 17-dma, 50-dma and 200-dma are all pointing down STEEPLY.  The S&P 500 Index is above the 17-dma which is at 850 and the 50-dma is at 936, which is 26.3% up from the Base Low of  741.

However, despite all that gloom which normally would take the market down to new lows and nearly started to do so, there seems to be a Line in the Sand at 815 which is the Bulls strong line of defense. 

I made all the caveats above against being tempted, so play at your own risk, but you have to be glued to the screen:

1.  Now those rooting for some form of Bear Rally are encouraged that at long last the Indexes have ploughed their way back to stand a chance of a Breakout above the key resistance at 880.

2.  Realise that within all this turmoil there have been three Eureka signals recently albiet without Kahunas. The back-breaker to the potential rally that had started with these irrational exuberances was the 7 to 8% drop on 12/1/2008 shown in a dotted ellipse on the chart below.

3.  It would seem that ETF’s are the best way to go for now, and that has become the craze as evidenced by the unusual volatility in what would be considered reliable Indicators.  These include the NYSE New Highs and Lows, Advances/Declines and Advancing Volume/Declining Volume parameters all confirmed with a VIX that has consistently stayed above 50 ever since the Indexes cratered.

4.  All of this can be seen in one chart which shows the DAILY % range change in the Indicies together with the VIX since October 1.  Note that the Crux of the Problem for this Santa Claus rally is the fear exhibited by this chart which shows the average at 5% (between friends) together with a VIX >50!  No wonder we have such a loose Darvas Box!

5.  I repeat again this ETF double and triple craze is probably distorting the usual Indicators mentioned above and until we see a substantial lessening of the fear by a drop in the VIX to below 40, we will not see these wild daily swings subside.

crux

So the Short-Term Game Plan for the Bulls is simple:

1.  Below 815, you’re outta here!

2.  Above 880 look for a Rally to 915 and then 950, and then see how things develop.  If you allow me a little poetic license, I estimate that at the current rate of descent by the 50-dma, it will be at 915 by next weekend, and the 17-dma will be flat to rounded up if the rally to 915 is achieved.  Provided there are no 7% down days, the technical picture will look a lot better if the S&P 500 can achieve even a modest rally to 950.

3.  Mark my words that the pundits will be proclaiming an Inverse Head and Shoulders Bottom and declaring the Santa Claus Rally is in full swing at 950!  That Target is 28% above the Base Low, though only a modest 8% above where we are right now. 

4.  I note that several of you are brushing up on the HGS Investing Principles – The 405 Freeway blog note of Dec. 2, 2007, and I would say it is worth your while to learn those principles to see what could evolve.  My good friend Charlie Hughes thought so back then, and you can print that chart back then as the gold standard.

targets

Please understand that 1050 on the S&P 500 is 40% up from the Base Low and that number is the best return from the Low to the End of  past Recessions.  Enjoy!

Best regards, Ian.

Hear No Evil, See No Evil, Speak no Evil

Tuesday, December 2nd, 2008

Picture

Mail-Bag:  My confidence in eureka is shaken, if not shattered. Three of the last five eureka signals resulted in massive selloffs the next day or the one after.

– Joe the Newbie

Hi “Joe the Newbie”, aka MK, you have just defined Newton’s Third Law of Motion as applied to Investing in the Stock Market:

“To every action there is an equal and opposite reaction.”

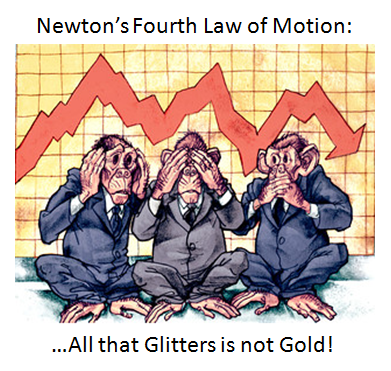
However, there is a Fourth Law that is a riddle and is seldom known or quoted:

“What did the Monkey say when he peed off a cliff in the moonlight?  All that glitters is not gold”.

With regard to that last law, I have often said “There is no Silver Bullet of a Technical Indicator, but two lead ones are better than none and four are better than two”.  I will show you how true that statement is.

Returning to your opening remark, let me pick up on what both David and Maynard mentioned to you as to clues of where to look for my musings on Eureka.  They were right that pages 58 to 69 of HGS 101a from October 2006 covered most of the key principles, but we have also progressed since then and I  would again refer you to Pages 63 to 144 of HGS 801, which covered the totality of the Suite of Indicators.  Unfortunately you only got a smattering of the understanding since you missed the first day at the seminar, so you would be well advised to peruse those pages again.  Yes, we are all busy people but at least review Page 69 of HGS 101a, and Pages 69, 71 to 81, 109, 112, 142, and 144 of HGS 801.  However,  here are the key points, some of which are new thoughts:

1.  Technical Analysis is as much an Art as it is a Science.  The easy part is the 89% of the time when all markets are trending up or down within + or – 2-std deviations from the mean.   The hard part is knowing how to interpret the other 5% to 6% at tops and bottoms.  Page 69, and 71 to 81.

2.  Unlike most Indicators which address Trading and Trending Markets such as Stochastics and Moving Averages ala MACD, respectively, most of the Proprietary Indicators we have developed in HGSI are what I would term “Impulse” Indicators to stay with the theme I introduced above of Newton’s law of motion. F=MA is a well known expression of Newton’s Second Law and means Force = Mass times Acceleration.   I know, I know, for those who could care less about Newton, be patient as it is important to know what you are depending on to make “the call” with your hard earned money, and be on the right side of the market.

3.  By “Impulse” I mean an Unusual Happening(s) which takes several conditions to trigger as expressed by the thrust and parry of the Bulls and the Bears in their quest for winning the battle.  At times like these it is the throwing in of the towel by the Bulls that first define the points in time when the Market is groping for a bottom.  That concept is captured by the three step process I have defined for Bango.  See Pages 109, 112, 142 and 144.

4.  I’m sure you got the message that no one indicator will do the job.  That is why we stress the need to have interlocking or inter-dependent indicators whose presence or absence relate to the strength or weakness of the “Unusual Happenings”.  In this case of the supporting Indicators to Eureka it is essential that the series of events are as follows:

a.  Several Bingos as defined by the RSI Indicator levels being triggered as the market trundles downwards and it searches for a bottom.

b.  In concert with the Bingos, we see the Deterioration phase of Bango as expressed by the Di+ and Di- going very negative, the Industry Group Rotation and Movement from A & B to predominantly D&E, and the number of New Lows compared to New Highs increasing rapidly.

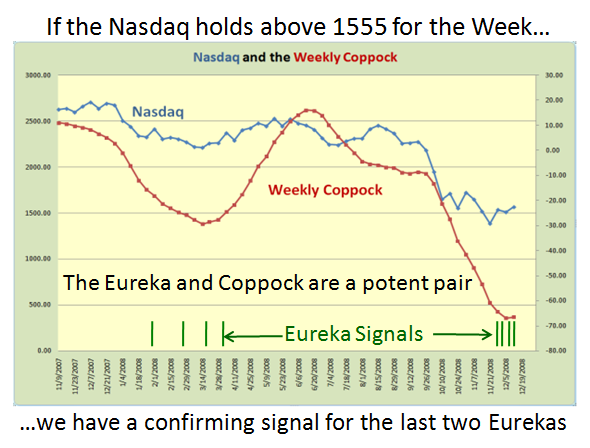
c.  Next we see Capitulation as expressed by the Exhaustion to the downside on the Indexes in general culminating in a Peak reading of the New Lows on the NYSE.  Parenthetically in passing, to answer one of your questions, the Hindenburg, Eureka, Bingo and Bango signals are all based on the “Total NYSE content”,  so that we have apples to apples comparisons.

d.  The next step is a Reversal Day, which can invariably occur on the day of capitulation or the very next day.  At this stage all heads are up for the expectation of a Follow-Through Day(s) (FTD) as defined by our friendly newspaper, which unfortunately has proven to be only 50% successful if that.  There is substantial activity in progress by teams of people who are both CANSLIM and HGSI oriented to dovetail their findings and produce a better set of conditions which include the Eureka, Kahuna and Coppock for more positive results than before.  As covered in previous blogs, Newsletters and Seminars, any Distribution Days within the first five days of a FTD will invariably lead to a Rally failure.  In that case the “Count” must start all over again.  That same statement can be made for any Eurekas that occur within that timeframe which are negated by a Rally Failure.

f.  Last but not least we need to see major enthusiasm on the part of the Bulls where rather than a Bull Run we need a Stampede as expressed by New Highs swamping New Lows on the NYSE to the tune of at least 2:1 and well over 100 for a few days and the New Lows calming down below 50 and preferably 25.  In concert with this, for starters the VIX needs to head down to at least the 40’s from the 60’s.

Now we come to the specifics of this particular set of Eurekas:

1.  We have just had a Black Swan of a Capitulation as Maynard aptly reminds us and who’s to say that is the last of them?  You will also recall that in my blog recording that event I coined the term “White Swan” which immediately followed the Black Swan the next day and we went on to talk about Pink and Blue ones as well.  That comes back to Newton’s third law exhibiting an equal and opposite force.

2.  Maynard pinpointed the increased Volatility since 2006 and we can add 2002 to that, which is at least 2 to 3 times as bad now.  I have repeatedly focused on the VIX in many of my blog notes, where readings of 60 and above are rare beasts until now, and 600, 100 and 50 point swings in a day are now commonplace for the DOW, Nasdaq and S&P 500, respectively.   It is no wonder that “Unusual Happenings” will trigger under such conditions, including Eurekas and counter thrusts.  Irrational Exuberance does not only work for the Bulls, and the Bears have the upper hand by far right now.

3.  One other point he mentioned which has had a serious affect on the whole Volatility scene is the double and now triple ETF’s which are in vogue and have burgeoned into the Day and Swing trader’s dreams of making big money in the shortest possible time.  Volume has picked up significantly in recent days for all of these 3x ETFs, reaching 10,000,000+ shares per day in some instances.  But the percentage change in these ETFs is what is really crazy.  The inverse 3x Russell 1,000 ETF (BGZ) has already had a rally of 114% and a decline of 42% since trading began on November 5th!  The Financial ETFs have been even crazier.  The 3x long Financial ETF (FAS) declined 80% from its high on 11/10 to its low last Friday.  Since then, it’s already up 127%!  The inverse one has been even crazier.  From 11/6 to its high last Friday, FAZ went from $60 to $200 (235%).  Since then, it has gone from $200 back down to $70 (-67%).  Nothing less than sheer gambling in my opinion.

4.  Does that mean we discard Eureka as unreliable?…not to my mind.  Quite the contrary, the more Eurekas we have the merrier as that is a true sign that the “Gasping Bull lying flat on the pavement ” which you sent me is at least getting some signs of resuscitation.

5.  However, when one has equal negative forces as depicted by Kahunas to the downside which now we should all understand, one MUST expect when the Bears are totally in command and any rally at this stage is nothing more than short covering to await the petering out of a five day rally they will then hammer it down again.
6.  One missing link which made all this Eureka action suspect is the total lack of Kahunas to the upside, which is what is essential on the same day to confirm the QUALITY, INTENSITY, and FORCE of the Eureka signal, i.e, Newton’s second Law of Motion.  You may have missed my Winky-Winky at the Seminar, but two Big Kahunas within a few days usually portend of better times to come, and I repeat, so far we have seen zippo, nadda, none…well just one lonely beast as shown in the chart below, and not in support of any Eureka.

7.  You witnessed that Ron has become a big believer in Elder’s 2 and 13-EMA Force Index which is another vehicle he feels comfortable with together with his “I” keys, where he has incorporated much of the requirements mentioned above along with several others he favors.

8.  Of course every pundit and guru under the sun is looking for a Bottom if not the Bottom, including false ones that our guru of all gurus with deep pockets, Warren Buffet proclaimed a trifle early.

Have no fear, between all the smart people in our stable which we have attracted to the HGSI family, you can rest assured we will be in unison and one of the early birds if and when we at least see a decent Bear Market Rally.  That is the true value of what we offer with the help of George and Matt to give us the desired indicators as we raise the bar each year.

So that this does not appear to be platitudes, let’s review the bidding of what one should expect based on past experience:

1.  When the NYSE is broken, the Di+/Di- will have the Di- (red line) above the Di+ (green line).  It is usually the last to change to positive.
2.  It is absolutely essential that the Ready, Set, Go (RSG) signals are positive and are all heading up
3.  The Directional Movement Di+/Di- ,the %B above the Bandwidth, and %A/D must be above “0”
4.  The Eurekas should also have Kahunas supporting the action on the appropriate days
5.  The most important requirement is that the 50-dma must be flat and preferably pointing slightly up

2006

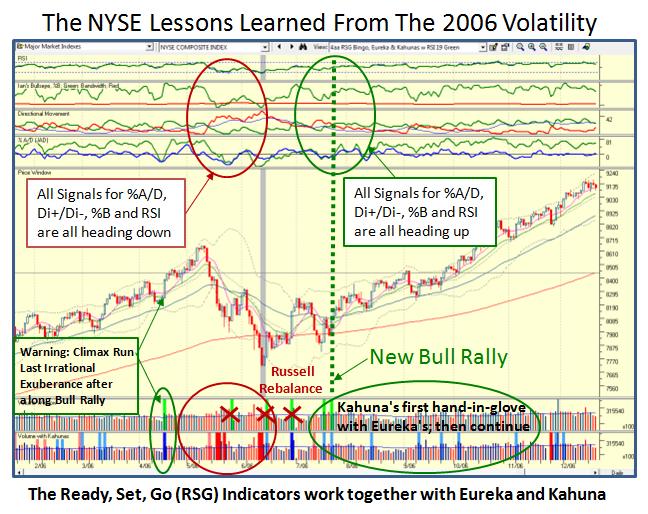
Now let’s fast forward to the present picture which speaks for itself:

2008

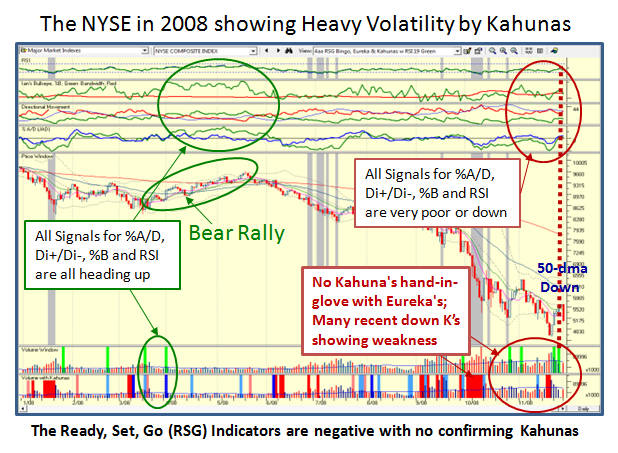
Until the Ready, Set, Go (RSG) Signals are all positive, the 50-dma is flat to pointing up and  the Eurekas are accompanied by positive Kahunas, we will not have a proper Bear Market Rally.  Eureka has been one of the best indicators in the HGSI bag of tricks and has served us well over the past eight years.  

The lesson learned is that Kahunas go hand-in-glove with Eurekas and we need both before we can get too excited.

Best Regards, Ian.

Santa Claus Rally Or Will The Grinch Win?

Monday, December 1st, 2008

Last week it looked as if nothing could stop a Santa Claus Rally with a 12% climb out of the doldrums, which was the best bounce in 34 years.  This week is the Grinch’s turn with a 5 to 6% drop in the Indexes and the announcement by the National Bureau of Economic Research (NBER) that we were officially in a Recession since December of 2007.

picture

The next chart shows the swings that have occurred since May 19, 2008 on the S&P 500.  While the last two rallies have been strong bounce plays, the duration of the rallies have been miniscule.  We need a sustained rally of a few weeks for us to have a bona fide Santa Claus Rally which together with the “January Effect” could take us into the New Year.  So far, all we have had are snap backs from short covering and an oversold market, with bottom fishers trying their best to call a bottom.

swings

The latest bad news to put the kibosh on a decent rally so far is the annoucement by the NBER that we are officially in a recession, and the threatening bad news of a rotten jobs report to come.  On the other hand, the Black Good Friday delivered a 3% improvement over last year in the shopping spree by consumers to at least give the retailers’ some hope of a decent outlook for the rest of the season.  Also, let us not forget that the price of Gas at the pump is now cut in half and in most places just below $2.00 a gallon.

For posterity sake, the snapshot below shows the Ten Worst Declines and Rebounds in One Year, so to look on the cheery side of things, we can but “Hope”!

10 worst

For the near Term Game Plan, the Targets are simple.  I showed you before that the inter-day bounces for the S&P 500 is of the order of 40 to 50 points…between friends.  On the chart below, I have mostly used 40 points but also tied the lines of demarcation to important past events.  I show an ugly, bent out of shape Cup and Handle where the bottom of the handle at 840 is the last vestige of support for the Bulls.

battleground

The Lines in the Sand are simple to remember: 

1.  850 or thereabouts must hold or the party is over

2.  Anything below 800, the Grinch wins and we fold our tent for a Santa Claus Rally

3.  The S&P 500 must break through near term resistance at 915 and then deliver the goods above 985, or call it 1000 as that is an easier number to remember.  Note that would mean a 35% Rally from the bottom.

The bottom line lesson is “Plan your Work, and Work your Plan”. 

Types 1 and 2 Short-term Traders…enjoy

Type 3 Swing Traders…wait a bit

Type 4 Buy and Hold…”Go to Sleep, Go to Sleep, close your big bloodshot eyes!”

My Grandsons enjoyed me singing that to them over the Thanksgiving Holiday, when tucking them into bed.

Best Regards, Ian.

Copyright © 2007-2010 Ian Woodward
Disclaimer: Commentaries on this Blog are not to be construed as recommendations to buy or sell the market and/or specific securites. The consumer of the information is responsible for their own investment decisions.