Ian Woodward's Investing Blog

Archive for May, 2009

Beware of Irrational Exuberance of Green Shoots

Saturday, May 30th, 2009

There comes a time when the Stock Market will confound you and do the exact
opposite of what most feel it should do.  For the last few blog notes I have been
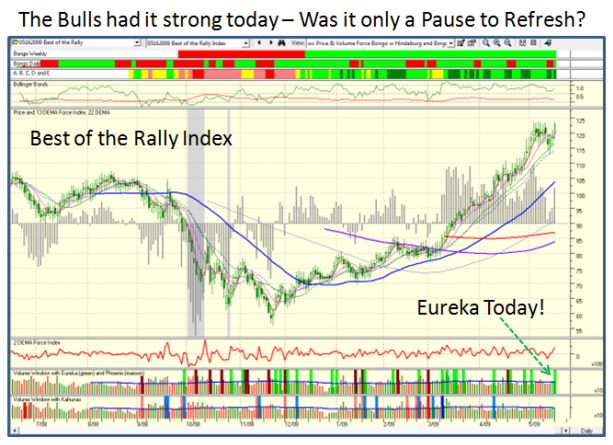
cautioning you as to whether this market was in a “Pause to Refresh or a Correction”.
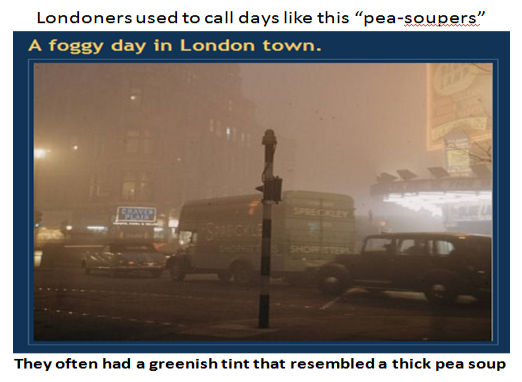
Also with my analogy to a London Pea-Souper  and Coming out of the Fog, I feel I
have given you enough warning to be on your toes for either a knee-jerk downwards
or a new birth to get past the obvious resistance at the 200-dma on all Indexes.

picture

I couldn’t help but give you one more warning where the latest buzz words around the Blogs and News Media are “Green Shoots”.  That pair of words was resurrected from 1991, when the then chancellor of the exchequer Norman Lamont was criticised for saying, during the middle of a recession, that he detected “the green shoots of economic spring”.   It goes without saying that those words haunted him to eventually step down.   I was reminded of another saying of “Irrational Exuberance” which I have frequently used, so take your pick, as I now couple the two together with those who said it.  Enough of that but I have always reminded you to have an Up, Down and Sideways Plan and let the market tell you which way the wind is blowing.  Sometimes the Calendar rules the roost, as it did on Friday when it turned turtle from a 20 point loss to a 100 point gain on the Dow inside the last 1/2 hour…if that.  The reason is the end of the month window dressing.  So we wait another week to really see which way the wind is blowing.

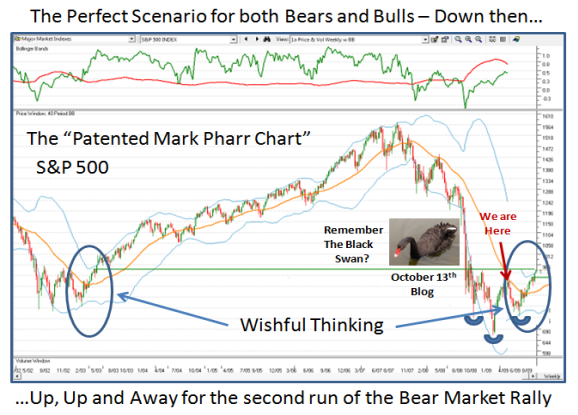
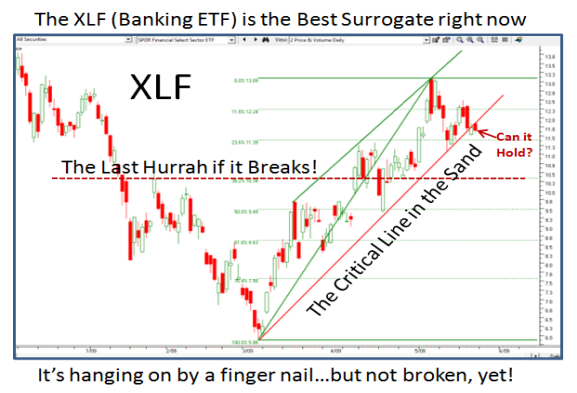
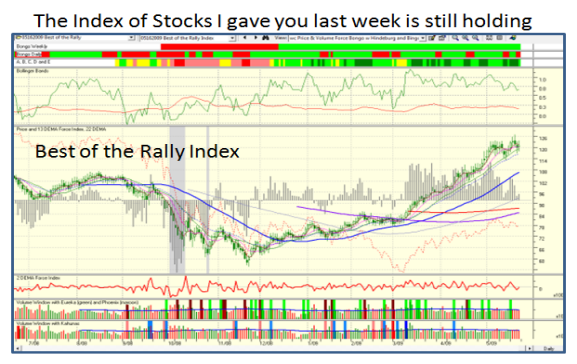
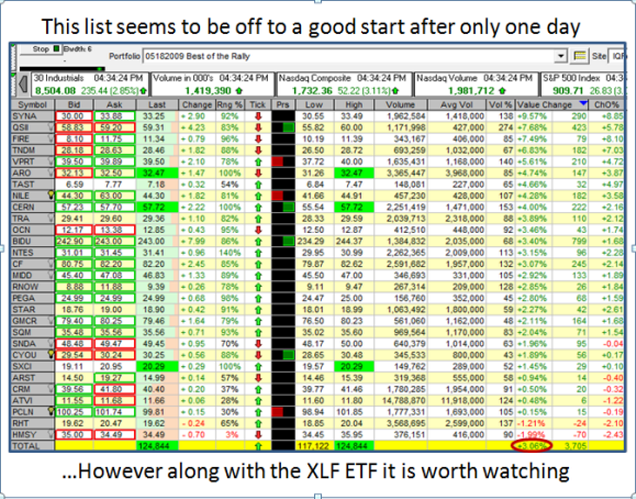
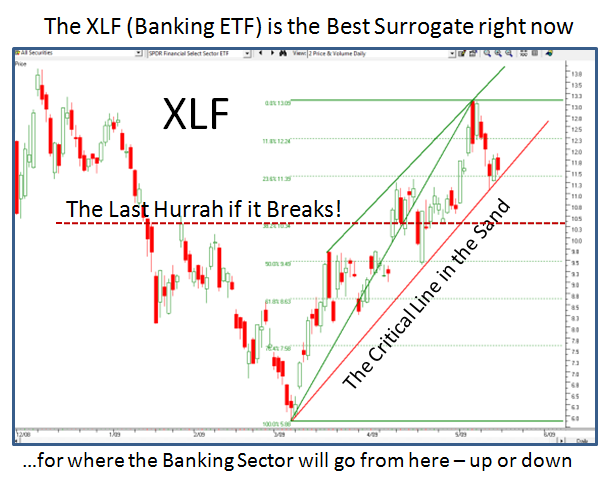
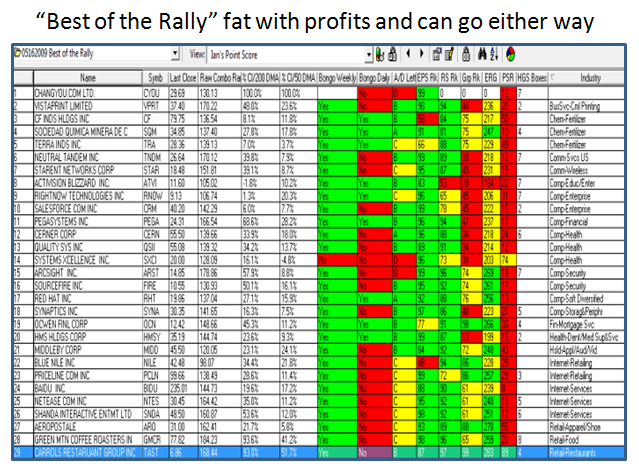
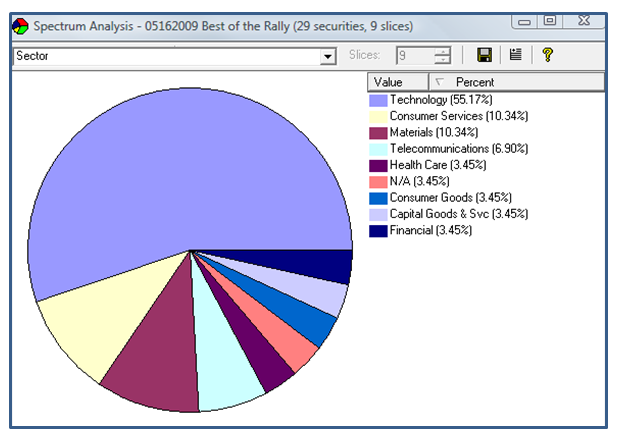
I feel the three pointers I recently gave you of the XLF banking ETF, the 40 Week Bollinger Band around the S&P 500 Index and the list of stocks which were first round winners that were pausing to refresh give you the focus of what to watch.  Every single one of them are perking up again and beauty is in the eye of the beholder:

1.  The technicians will point to myriads of Market Indexes and ETF’s that are at the 200-dma for what would seem key resistance and in a sentence “They either break through with authority or fall back from a Double Top.” 

2.  Others will suggest that the Leading Stocks have now all set up respectable Bases, above both the 50- and 200-dma, and more beautiful set ups you could not wish for with Cups and Handles, Flat Bases, and High Tight Flags coming out of their ears.

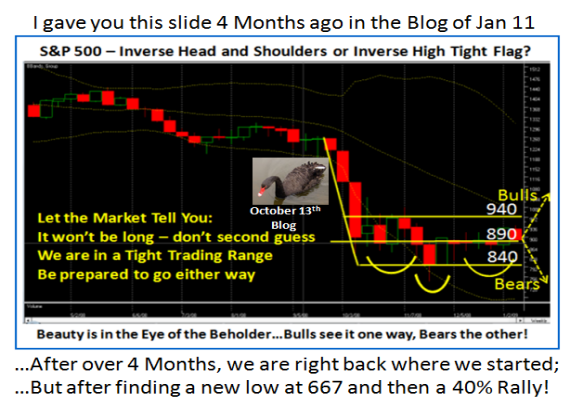
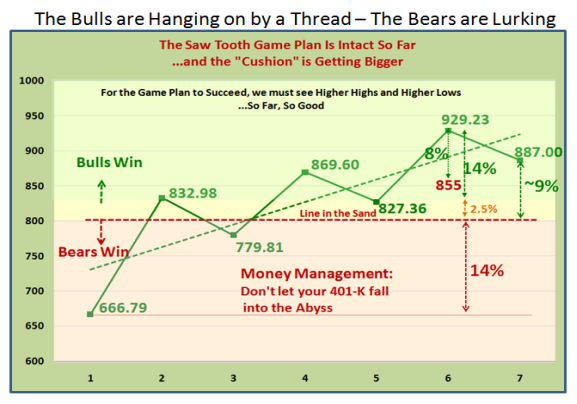
3.  Yet again, others will suggest that this rally is long in the tooth and is producing a rounded top especially as the S&P 500 has done little but go sideways, albiet in a tight pattern, since it hit a high of 930.  This is only a matter of ten points from where every technician had pointed to as a point to watch for a peak. 

4.  Ask the Type 1 and 2 Short term traders how they are fairing and they will all say “Tricky Market, and you better be nimble within Intra-day moments to cope with the wild gyrations”.

5.  Type 3’s who comprise three groups of swing traders are either:

a.  Out of the Market and kicking themselves for having missed a decent Bear Market Rally
b.  In the Market and trying to garner the profits they have lest they slip away
c.  Already playing their cards as if they were budding short-term Types 1 and 2

6.  If you belong to bulletin boards which most of you do, you can see there is little enthusiasm since most are waiting for a correction of some sorts before they engage in the next leg up.

7.  Long Term Type 4 Buy and Hold Investors are patiently waiting in the wings for better signs of a true improvement in the economy and the usual Fundamentals that show that the S&P 500 can prop up the Price given the dismal Earnings it now has.  They also know that the long term test from a technical standpoint is to be patient and wait for a “Golden Cross” of the 50-dma coming up through the 200-dma, which by my estimate will be around the fall of this year as I have shown you many times before, unless we have a further disaster.

So I come full circle to the Theme of this blog note which is to beware of politicians propping up this market with platitudes and precious little substance other than hope.  To round off the tidbit I gave you earlier, the ex-chancellor – now Lord Lamont – said there was always “huge pressure” on ministers to talk up the economy.   But he warned that ministers risked getting into “very dangerous territory” if they strayed too far ahead of events in the real economy. “The recession now has only just begun and recovery is very unlikely before the end of 2009,” he told the BBC back in January after chiding the Business minister Baroness Vadera had denied she is out of touch after claiming she could see “a few green shoots” of economic recovery.

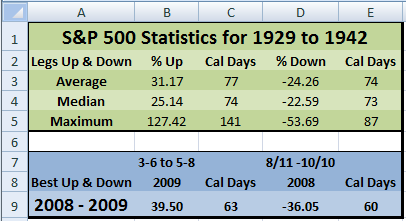
Lastly, let me leave you with a Summary Comparison of the S&P 500 from 1929-42 and Now, with the latter the best up and down since the peak in 2007.  Except for the maximum, this Best Up and Worst Down have beaten the Average and Median of that era.

                    stats

Best Regards, Ian.

A Reflection of the Market Since October

Sunday, May 24th, 2009

It is only fitting that I start this blog with a thought to remember our heroes on this special day for them…Memorial Day.  We all have our own memories from our personal experiences, but one thing is constant and that is our admiration for the men and women in the forces that keep us safe and free.

memorial

I felt it would be worthwhile to have a reprise of the last 9 months to take stock of what we have seen happen and how we stand now in the hope of pulling out of the abyss we felt last October and November.

black

I am sure you recall the Black Swan Chart which put us at the crossroads of either heading down for an Inverse Head and Shoulders scenario or breaking out to get above 940.  Note how 840 and 940 were in our sites then after the Black Swan drop had only gone down to 840.  As it turned out the Bears won that round and we fell into Capitulation, Despondency and Depression to bottom out at 667 in late November.

We then started the long journey back with an impressive 40% rally which focused our attention on the Saw Tooth Plan.  Over the ensuing months we have grinded out higher highs and higher lows, which are essential to achieve a true Bear Market Rally with the hope to then blossom into a full Bull Rally in time, given the strong foundation. 

saw tooth

 Don’t ever forget that for it to happen the corrections, or I should say “Pullbacks”, must be no more than 8% in order for this to happen.  Now we have a cushion as shown and the key number to watch for is no lower than 855 on the S&P 500.  As we have discussed earlier the final line in the sand is at 800, which if broken would change the psychology of the market from Hope back to Despair.  I trust you have learned a lesson that this time anything below 800 is your last chance before we again fall into Despondency.

The $64 question is what next and where do we go from here?  To answer that I have resorted to a chart I used back in the October 13 Blog and several times before in our seminars.  This chart shows a 40 Period Bollinger Band for the S&P 500, together with the %B and Bandwidth in the upper window. 

 mark

For the S&P 500 to turn the corner, the Index must get above the middle band in
Orange and then stay above it as it did in the 2003 to 2007 timeframe.  To visualize
what must happen I have taken the circled piece from 2003 and placed it on today.
Of course this is “Wishful Thinking”, but until this happens and the Index stops short of heading down for a double bottom, the Inverse Head and Shoulders pattern will then be achieved and we can hope to move on up once again as we did back in 2003.

Where do we stand with regard to the items I gave you to focus on?  Right below:

xlf

best

As you can quickly see, the charts are still intact but still in the balance.  This week
should give us a better feel as to whether we trundle sideways, trot up or head down.

Enjoy your Memorial Day Holiday and do your homework for next week.

Best Regards, Ian.

Coming Out of the Fog!

Monday, May 18th, 2009

The question last week was “A Pause to Refresh or a Correction?”  I guess we came
out of the fog with a strong move up today.  I am sure most would have bet that we
were headed down today, but what a turn up this was for the books?  I tell you it
is like trying to drive in a “pea-souper” in London many moons ago trying to second
guess the market, as it will prove us wrong time and time again:

fog

Fortunately I gave you both sides of the coin and two items to watch to see which
way the wind was blowing; both the XLF ETF and the Best of the Rally Stocks performed very well today:

quote

index

I feel I hit the nail on the head as to what to watch and would suggest you see if these
stocks and the XLF continue strong or that it was a one day wonder and fizzles.  Two of the stocks…RNOW and TAFT were tiddlers, but even they did well today.  If you feel this works for you, the lesson learned is to take a deep breath and next time put together a User Group which you can track that were leaders and had a week or so Pause to Refresh.

Best Regards, Ian.

Stock Market Rally Foothold in the Balance!

Sunday, May 17th, 2009

picture

Before I settle down to watch the golf in my friend Maynard’s back yard in San Antonio
where Zach Johnson fired a blistering 60 in round three, I felt you would like a quick
feel for my thoughts on this tricky market.

The Newsletter is out, the Saturday Movie from Ron which is free is a must see for all and especially those who profess to be confused and should have no excuse now, and the
Saturday Meeting we had yesterday produced some interesting ideas for tonight’s Webinar.  With all of that in mind, I felt it might help if I collect my thoughts at this critical juncture as each week that goes by seems to be that way.

We are at a point where two roads diverge in a wood and we need to carefully pick the one less traveled by…with apologies to Robert Frost.  We have now had close to a 40% rally from the Base Low, and this past week has so far produced an ~5% pause to refresh.  The picture above shows my sentiments that at this point the Bulls have a tenuous foothold.  As many will attest over the years in past Bear Markets, the Sectors that usually lead one out of the abyss are the Financials and Technology, and if you cut through all the mumbo jumbo that has been the same to a large extent this time.  Of course there have also been major moves in the Retails, and the list goes on.  However, for the purpose of this Blog Note, I believe we need to focus on just two items to see if we suffer a light pause to refresh or have to tolerate another deep correction leading to a double bottom.

1.  Financial Sector – The quickest way to cut to the chase is the picture below as explained so well by my good friend and associate, Ron Brown, in his movie.  The XLF is front and center and should tell us volumes if it breaks or holds the lines in the sand as shown below:

xlf

2.  Technology Sector – The Best of the Rally with a couple of tiddlers thrown in is shown below.  We all have our own favorite lists, but if one looks at the underpinning of most of these stocks they are mostly “Above the Line Stocks” (above the 200-dma), with many fitting in the HGS Boxes list:

warehouse

If we look at the Pie Chart, it favors Technology and these stocks were all picked because they have so far exhibited a slight pause to refresh mainly at support levels.  They are ripe with profits, have had some buffeting and are vulnerable to lose heavy ground if the market goes down; or moving up to become strong Silverback Gorillas if the market goes for a second leg from here.

pie

Do your homework, stay on your toes, and let the market tell you which way to go, but be ready to go either way.  We came close to getting a Phoenix on the NYSE on Friday and one can’t ignore the early warning signs I gave you in the last few blog notes.  It’s always “Your Call”.

Best Regards, Ian.

Pesto Sauce Works in this Tricky Market!

Wednesday, May 13th, 2009

Three blogs ago I gave you the Early Warning Signs of what to look for when this Rally was giving up the ghost.  They happened today in one fell swoop, and I thought you would like to see the Update.  I am busy getting the Newsletter together where I will cover the Game Plan, so enjoy this picture.  It shows the power of the “Impulse” Indicators used in the HGSI Software to anticipate what must happen for success:

pesto

Sometimes History does repeat itself! 

Best Regards, Ian.

Copyright © 2007-2010 Ian Woodward
Disclaimer: Commentaries on this Blog are not to be construed as recommendations to buy or sell the market and/or specific securites. The consumer of the information is responsible for their own investment decisions.