Ian Woodward's Investing Blog

Archive for May, 2009

The Dreaded Spidery Legs Syndrome
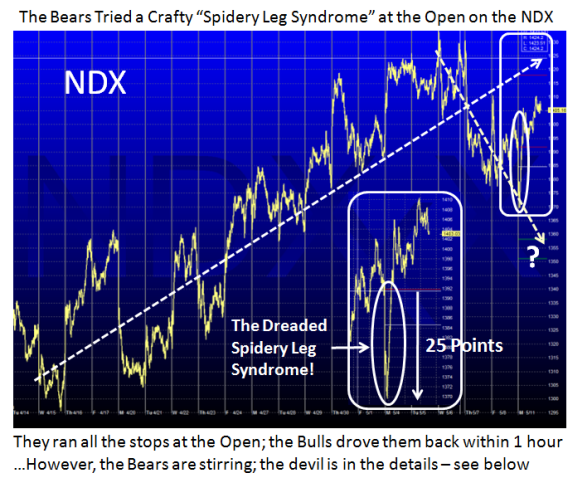
Monday, May 11th, 2009

How often have you been stopped out of what seemed a very safe “stop” at the
open or during the day only to find that the security you were in came right back
and went higher?  I call it Spidery Legs Syndrome.  I am always careful to look at
chart patterns that display this symptom as it gives a clue to beware of being
stopped out at an unreasonably low level, and if it is a prevalent problem I tend
to skip buying the stock.  Sad to say it happened to both the Nasdaq and the NDX
today, and that can be translated to include the QID, but it goes with the territory.

spidery

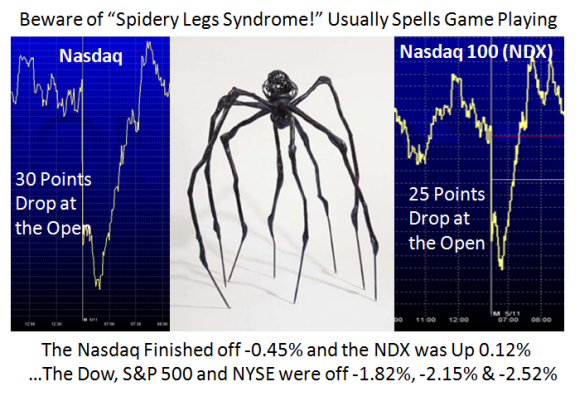
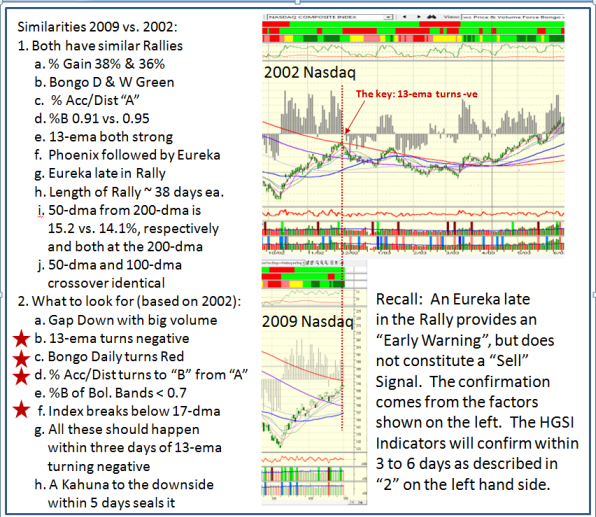
Just two nights ago, I suggested that an Early Warning Sign that could trigger a
cascade into a correction of the Bear Market Rally would be a sharp 50 point
drop in the Nasdaq.  It opened today 30 points down but recovered as did the
NDX which fell 25 points, shown below.  Both finished essentially flat, so be on
the lookout for another attempt at these shenanigans again!

ndx

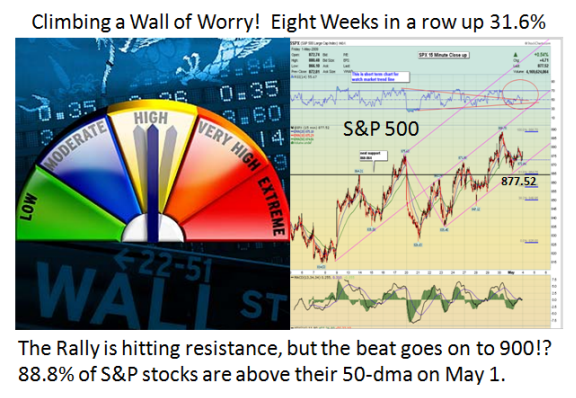
This may be a shot across the bow, especially as the other Major Indexes of the
DOW,  S&P 500 and NYSE all had sizable drops of  ~ 2.0% to 2.5%.  we have had a
nine week 40% rally which has recovered some of the drastic freefall; On the
other hand, an occasional back and fill is very healthy if this Bear Market Rally is
to continue.

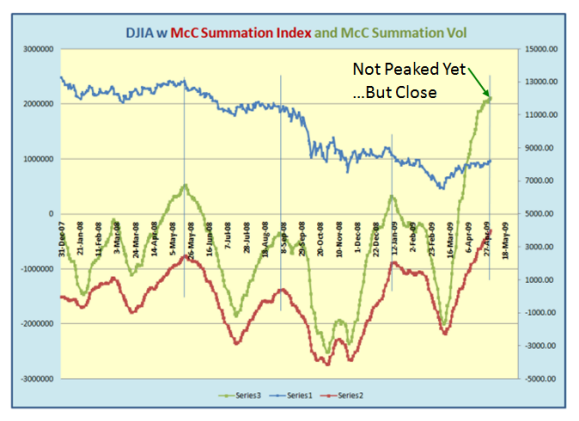
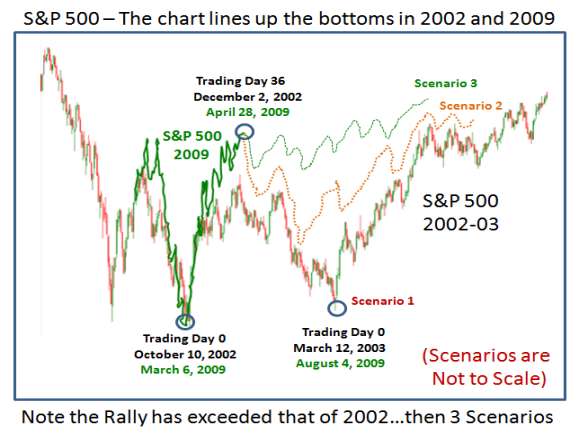
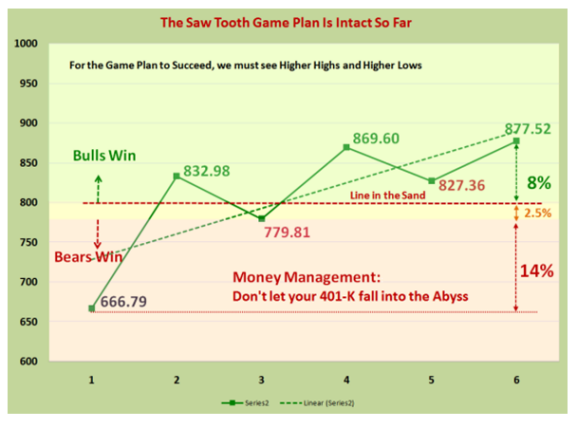
However, there is no question in my mind that the Bears are stirring and may be
getting the upper hand.  I have featured the two charts below several times before,
so they need no explanation, other than to point to the “Stirring of the Bears”!

yellow

black

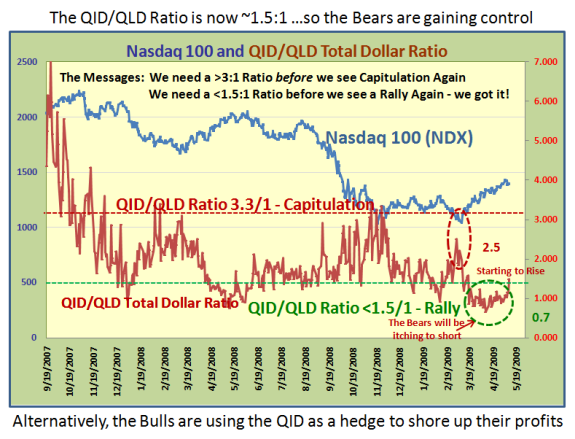
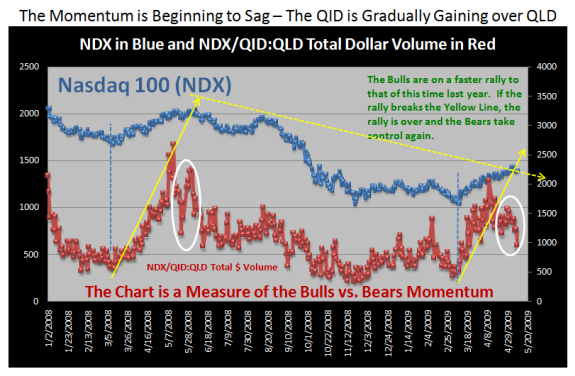
If these two charts do provide the underlying details that give us clues to rallies 
and corrections, we may have a leg up on most in the future.  Stay tuned and be on your toes.  To be forewarned is to be forearmed and can help you both on the upside and downside.

Best Regards, Ian.

The “What-If” for a Magic Silver Bullet

Saturday, May 9th, 2009

My last blog has produced a series of discussions which are looking for a Magic Bullet.
Please read the Comments at the bottom of the blog titled “Early Warning Signs for a
Correction”.

bullet

As I have always said…there is no such thing as a “Magic Silver Bullet”, but if you press me to the wall  I will give you one that should do the trick to cause the cascade of events I
provided last week in my last blog where I gave you the four lead bullets: 

1.  Bongo Daily turns Red
2.  13-ema Force Index turns negative
3.  %Acc/Dist turns to “B” from “A” – this has already happened
4.  The Nasdaq breaks below the 17-dma

One more negative day of -50 points or more on the Nasdaq should cause the correction
we have been looking for, but it must happen early this coming week with no big moves to the upside in between.  Otherwise, it goes higher to reach the Target of 934 to 940.  Then we review the bidding at that stage.

Let the Market show you what it is doing rather than wishing for a scenario to happen.  By all means develop reasonable “What-if” conditions for what must happen, either up or down…that way you are not surprised when you see it unfold.  Let’s see if this one comes about.

There is one cardinal rule which you should never forget…”All Great Leaders rise above the 17-dma; the greatest rise above the 9-dma”.  After a long rally, once an Index or a Stock breaks down through the 17-dma the rally is usually over for a while.

Best Regards, Ian. 

Early Warning Signs for a Correction

Sunday, May 3rd, 2009

Michael Kahn of Barrons asks:

If I am not mistaken, there was a pheonix last week followed by a eureka. Since we are  25% to 30% into a rally, a eureka is supposed to be exhaustive even w/o the phoenix.

sell?

Michael:  I wish it were that easy, but you have it “half-right”.  An Eureka Signal will indicate the Bulls have irrational exuberance.  Where it happens is the clue.

1. Several Eurekas in a row after a Base Low is a strong signal that a new Bear or Bull Rally is starting.
2. However, a Eureka late in the Rally also signals an Early Warning Sign that the Rally is probably over for now and a correction is due.  However, that alone does NOT constitute a SELL signal.  I have attached a PowerPoint slide below as to the entire rationale.  You heard it here first! 

early

Best Regards, Ian.

The Rally is Climbing a Wall of Worry

Sunday, May 3rd, 2009

This Rally has confounded most “Quant’s” and for sure all the statistics seem to show
that the majority of the action over the last 38 trading days which has yielded a 38.3% gain is due to Program Trading.  Intra-Day Traders are being creamed unless they play in moments.  The Rally is long in the tooth as nearly 90% of the S&P 500 Stocks are above their 50-dma on May 1.  The question is does the beat go on to reach the next Target of 900 or do we take the expected correction which most Bears are itching to get their hands on.

worry

Before I discuss the Low, Middle and High Road Scenarios, let’s look at the happy
results of the past eight weeks.  You will recall that four weeks ago, and then again three weeks ago, I displayed the following chart wondering if History repeats itself.  It did!

history

There are several factors we watch that tell us we are in relative “nose bleed” territory, and one of them is the McClellan Summation Index.  In the Chart below I show the Summation Index (red line and right scale) to be at 4000, but worse yet is the Summation Index Volume (green line and left scale) which is at a startling 2,000,000…not seen before.  We have traipsed from Oversold to Overbought in a short 38 trading days.

index

This is a very sharp advance in such a short period of time, and that has occurred three times before, all from the 1930’s!  The chart below lines up the bottoms of 2002 and 2009.  Note that the current rally has exceeded that of 2002 as shown after 38 trading days.  What then are the three obvious Scenarios?

three

1. The expectation from the majority is that we should see a correction leading to a
double bottom.  This is favored by most fundamentalists who immediately point to the fact that the S&P Earnings cannot support anything higher than 900 at present given the overall poor earnings reports especially from the Financial Sector.  I show this as retracing to the current low of 667 with the implication that there is heavy bad news to come through the summer months, when the Market traditionally sells off anyway.

2. The second scenario shown in Orange suggests we could see a 50% Fibonacci retracement which would be an Intermediate Correction of about 12% and would take us down to 777.

3. The third Scenario suggests that the worst is behind us with regard to the Economy and that we should not expect more than an 8% correction from where we are now.  That would take us down to 807 or just above the psychologically critical 800 mark. 

This last Optimistic Scenario would suggest that we could be in the 1932 to 38 Model and, so let’s see what those three occasions could bring us:

a.  The Market advances another 63% for another five weeks as it did in 1932

b.  The Market advances another 70% for another 12 weeks as it did in 1933

c.  The market advances another 6.5% for another two weeks as it did in 1938

It goes without saying that the first two are wishful thinking, so the third would give us 934, which is close enough to the 940 target that I have suggested as a possibility from time to time.  Please understand that the Nasdaq 100 which has been the brightest of the main Indexes is right at its 200-dma so is up against resistance, with the Nasdaq close behind.

If we stare at these scenarios, anything above 800 on the S&P 500 for a retracement is gravy and would maintain a positive Psychological advantage for the market continuing on the rally.  Anything that leads to Scenario 2 and then 1 takes us back to gloom and doom.  Longer term holders should seriously watch the 800 mark and make some decisions if it trundles below.  Those who have missed this rally had better be on their toes if the correction is no worse than 8% or the market stays above 800.

Here’s the Latest Game Plan:

plan

Best Regards, Ian.

Copyright © 2007-2010 Ian Woodward
Disclaimer: Commentaries on this Blog are not to be construed as recommendations to buy or sell the market and/or specific securites. The consumer of the information is responsible for their own investment decisions.