Is there a Chink in the Bear Market Rally?
We are back in the mode of a sideways market with both the Bulls and the Bears looking
for any chink in the armor. Today’s action of 0.81% down on the S&P 500 may be a mild
first shot across the bow for the Bears to pluck up courage and short the market again.
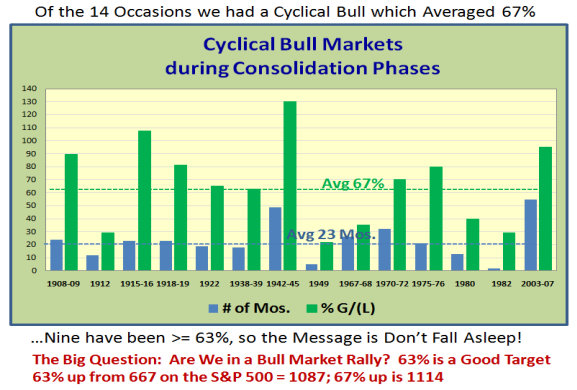
We are yet again at the crossroads of either making one more leg up for a >60% Cyclical
Bull Market Rally during a Consolidation Phase or making a Correction. We are just 54% up from the Base Low of 667, and since there have been nine previous occasions where the rally has been >=63%, we must stay alert for a next leg up…against all odds as it would seem.
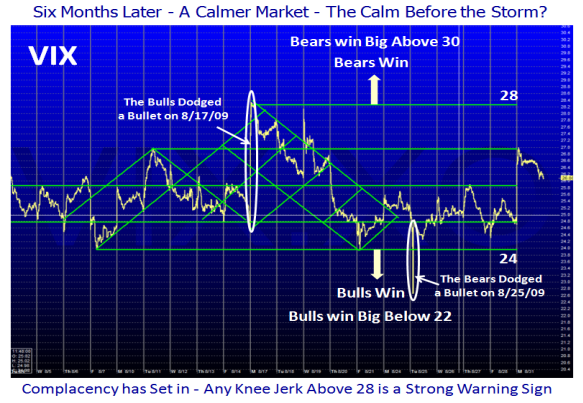
We have come a long way since the hectic volatility we suffered back six months ago. The VIX, which is the best symbol for the Fear Index, has been dormant but has made alternate spikes during the past two weeks where both the Bulls and the Bears have dodged a bullet:
What then are the realistic expectations for the upside scenario? The bigger question that finds the pundits in two camps, Sunshine or Gloom & Doom, is “Are we in a Bear Market Rally, or is this the start of a New Bull Market, in which we have already bounced 54%?”
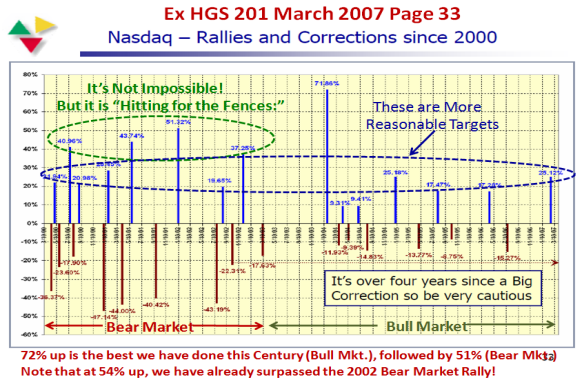
I used the following chart 2&1/2 Years ago to suggest we were long in the tooth at that time, since it was then over four years since we had a Big Correction, and subsequently with the help of the Hindenburg Omen Indicator we were able to pinpoint the top:
72% is the best we have done this Century when we came out of the 3 year Bear Market from the Technology Bubble. So take your pick between 63%, 67%, or 71%, but before we even comtemplate that we need to get past 1035, and I would be very leary this time if we trot up to 1050 – 1070 (57% to 60%) in a hurry. That would strengthen the Bear argument that:
1. September is traditionally a bad month in the stock market
2. This Market is moving on fumes which cannot be supported by the Fundamentals
3. China is already showing signs of weakness, which in turn is reflecting on the US 4. The market is very event driven; it only takes a negative surprise to bring it down
This time, I would prefer to leave you focused on three recent topics which relate to the
internals of the market to guide us as to the current health of the market. Then let the
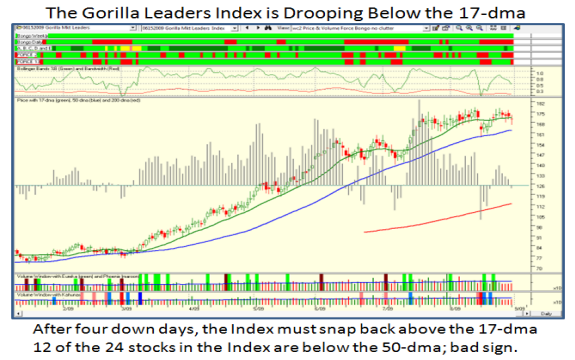
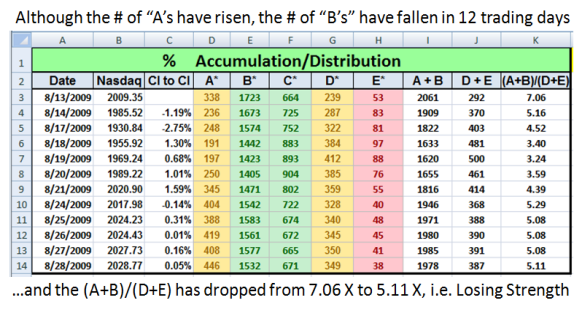
market show us which path it is on by either confirming or denying the results we use for the Signposts, Stakes in the Ground and Measuring Rods.
Net-net: Weakness: The comments on the chart give you the key items to watch.
Net-net: Holding but Weakening. Watch Ron’s “Ic” key which shows that the “All 50%
Institutional Ownership” Index is holding.
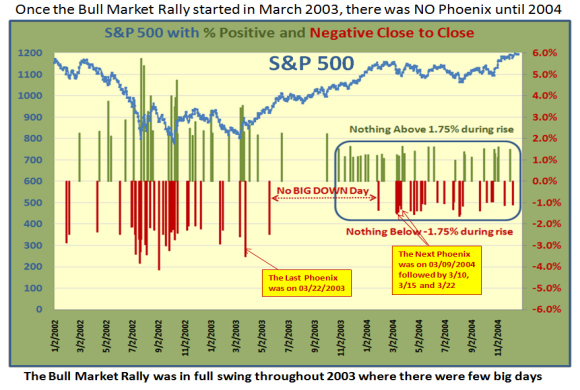
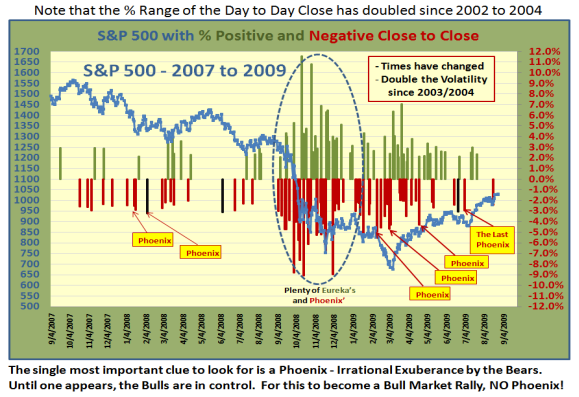
Now I turn to two charts to feature the Phoenix Indicator which is the signal for Irrational Exuberance by the Bears as they left their footprints in the sand in 2002-2003, and how it looks now.
Net-net: The short answer is we do not want to see a Phoenix, or if we do, it must
immediately be trumped by an Eureka signal soon thereafter. I am glad to see that customers are beginning to understand the value of these two indicators, and how to use them.
The Bottom line is to be in the Light on Your Feet Camp and act accordingly. Thanks to those who have recently signed up for the seminar – we have seven weeks to go and if you are coming we would appreciate you signing up as quickly as possible. It does help us with the planning at this end.
Best Regards, Ian.
 Ian Woodward's Investing Blog