Stock Market – Bears are Hungry and Prowling
Sunday, February 21st, 2010This last couple of weeks has been a “turn-up for the books” in that the Bears had the Stock Market in its teeth when the Greek Economy situation blew up in the Euro’s face and the Dollar has been gushing forth in no uncertain terms. Likewise the Fed raised the discount rate to everybody’s surprise but the Stock Market brushed that aside, and we have recovered 61% of the drop we had a few weeks ago. Net-net, we have a Fledgling, albeit shaky White Swan but make no mistake the Bears are Hungry and Prowling.
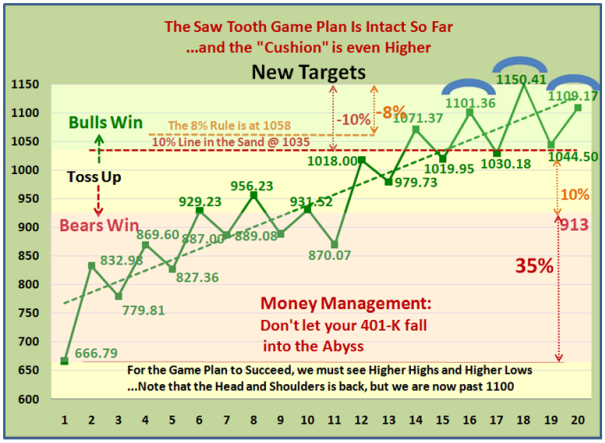
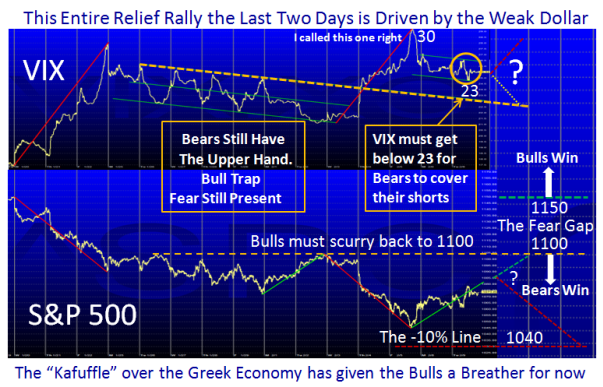
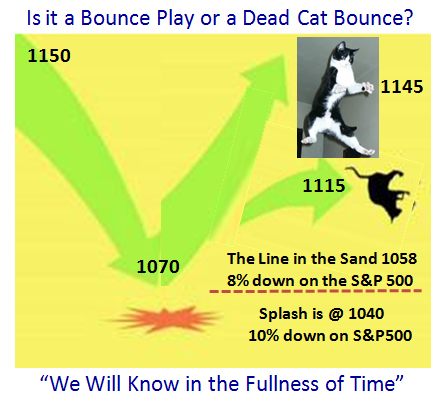
The net result is that we have had a little over a -9% Correction in the S&P 500, but have recovered to the 1109 mark and is now sitting with a Head and Shoulders pattern. The Saw Tooth Game Plan which has served us royally for these past 11 months is back in full swing so the bottom line is that we either drive back up to the high at 1150 or fall back to re-test the low at 1040 for a double bottom to start with.
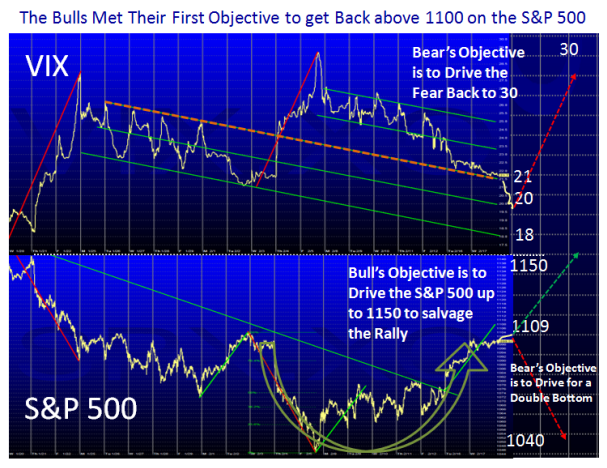
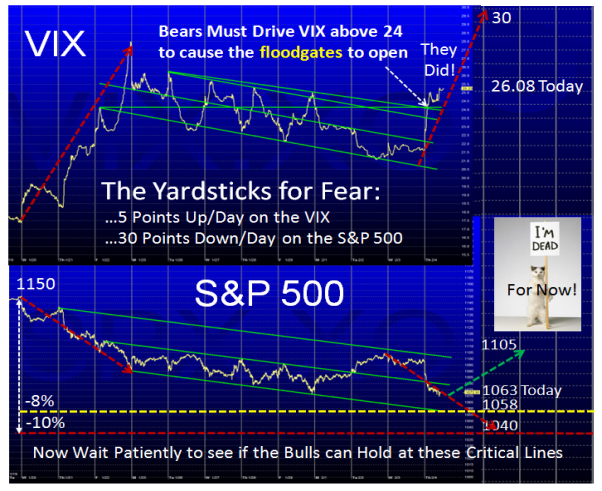
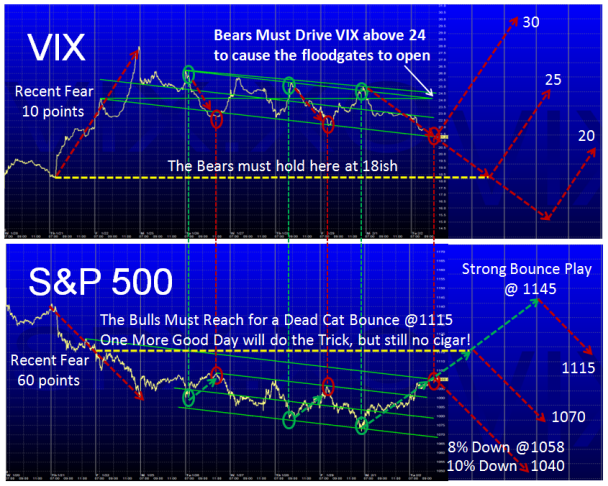
Continuing the theme of the VIX vs the S&P 500 which you seem to enjoy, the Bears had driven the fear factor back up to its customary 30 level with a 10 point swing up in two days for two separate occasions, but could not drive the nail in the coffin of the rally when it was on the ropes. The Bulls have trundled back in a tepid sort of way, but when all is said and done the Market seems to have weathered the storm for now and they are intent on driving back to the recent high at 1150. We shall see what transpires in the coming weeks.
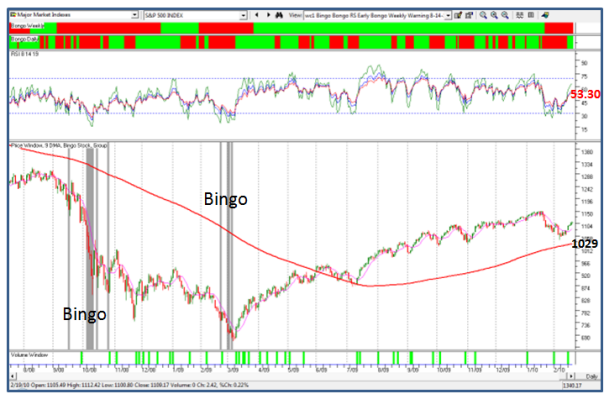
We came within a hair’s breadth of a Bingo signal…Oh! so you have forgotten about the Bingo! A Bingo is an RSI 19 with a reading of 33.50 on the NYSE, which can signify one of two conditions:
1. It either signifies that we have reached an oversold situation in the course of a correction particularly if it is followed by the ever faithful Eureka which says the Bulls are buying with some exuberance, and better yet when we have two Eurekas within a week which says “Loud Cheers, we have irrational exuberance to the upside”, or
2. It signifies the first of many more Bingo signals and therefore corrections to come which kills the rally, and drives the Market into a deeper Intermediate Correction; certainly at least to retest the recent low for a double bottom, or worse yet to finish up with a sizable correction of 12% or more.
You will note that the 200-dma is conveniently providing support at 1029 on the S&P 500 at this time so should there be more trouble to come, that is the last vestige of support for the Bulls before the rot sets in. You can also see that the current reading of the RSI-19 Period is at 53.30 so we have a cushion with ample warning before we hit a Bingo at 33.50.
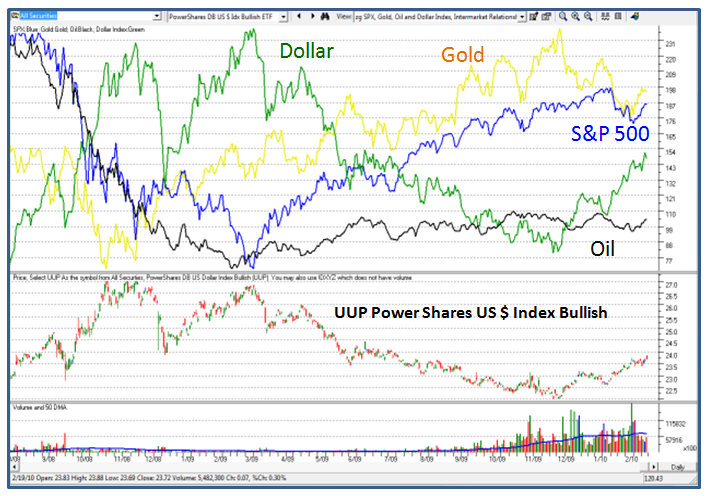
As I mentioned earlier the problems with the so-called PIIGS Economies (Portugal, Ireland, Italy, Greece and Spain) threw a monkey wrench into the equation and as you can see the Dollar which had been weak for so long throughout the Stock Market rally, bottomed, and took off these last several weeks as shown below:
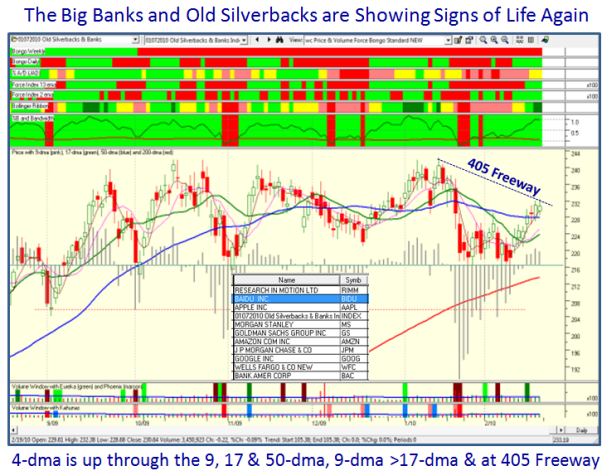
Meanwhile back at the Ranch, the bulk of the earnings reports are out and despite the decent Quarterly Gains in most of the stocks, the likes of the Technolgies and the Big Banks were hit severely. I gave you a worthwhile Surrogate for the market a few blogs ago with the five old Silverbacks of AAPL, AMZN, BIDU, GOOG and RIMM, and the five Big Banks of BAC, GS, JPM, MS, and WFC, and I show below the composite picture of these ten stocks which like the stock market have done nothing since mid-September.
Looking at the ugliness of that chart pattern would scare the pants off any Bull, but take heart, beauty is in the eyes of the beholder. It is essential for me to give a balanced view so there are two obvious scenarios if you stare at the chart:
1. The Index has retraced 61% back up and will turn down again to re-test its lows yet again. The disappointment is that there has not been sufficient strength shown by way of the so-called Follow Through Day (FTD). It is at the Upper Bollinger Band and must hold there or it is vulnerable to breaking down through the 50-dma one more time, therefore killing any of the promising fledgling rally.
2. The Chart shows that this Index has Double Bottomed, the 4-dma is up through the 9, the 17 and 50-dma showing strength; more importantly, the 9-dma is up through the 17-dma and the Index itself is above the 50-dma. Also note that all of this has happened because of the recent Eureka which fired four days ago. It is poised at the down-trend-line from its highs, aka the famous 405 Freeway, and with one more Eureka it could drive up at least to reach the old high. As my good friend Dave Baratto has reminded me recently, we need to think of the basics we learned so well in the Days of Wine and Roses, and this paragraph and picture says it all. But then again, as my other good friend Aloha Mike Scott also attests to the Saturday Meeting findings where we concluded that there was mighty slim pickings of decent stocks, other than “Junk off the Bottom” (JOB) with great last two quarter earnings credentials, and beaten down recent warriors echoing the likes of the senior beasts I show you above. You might take a leaf out of the White Goose’s book and watch AFLAC! Good credentials.
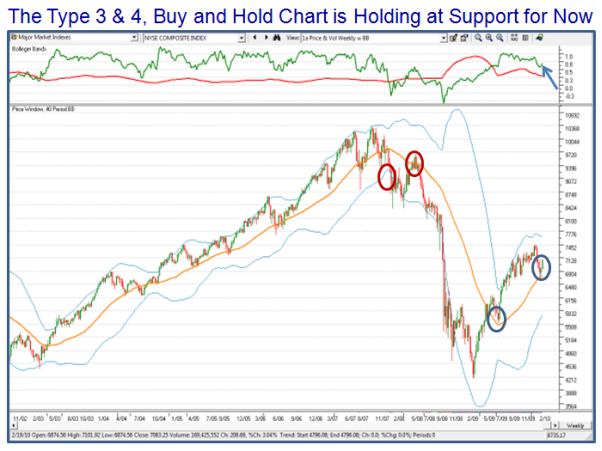
So it is a puzzlement and we shall see what we shall see this coming week. In any event, the Long Term Buy and Hold Type 4 Investors can take comfort from the fact that the Long-Term chart has held and turned up from the support area that I have preached should be watched intently:
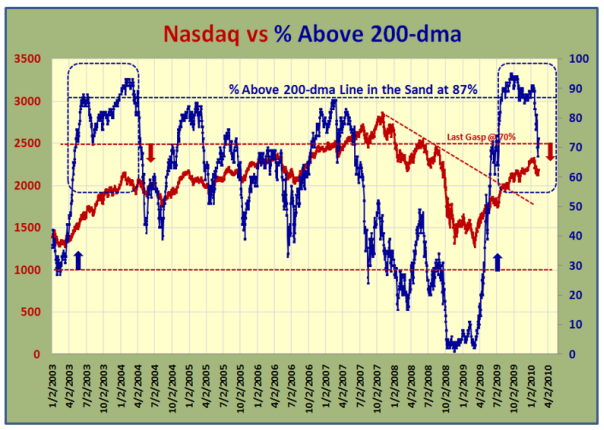
Last but by no means least, the one internal that was hanging on by a thread was the % of stocks above the 200-dma which had fallen below 70%, but has recently risen back to a respectable 80%.
These are difficult times to invest with the INTRA-DAY skittishness that abounds with all the indexes. Keep your powder dry and come to the seminar in 5 weeks time where you learn a whole new set of good stuff to keep you on the right side of the market, both short and long term!
Best regards, Ian.
 Ian Woodward's Investing Blog