Ian Woodward's Investing Blog

Archive for May, 2010

Stock Market Stalemate and Latest Targets

Sunday, May 30th, 2010

     Picture

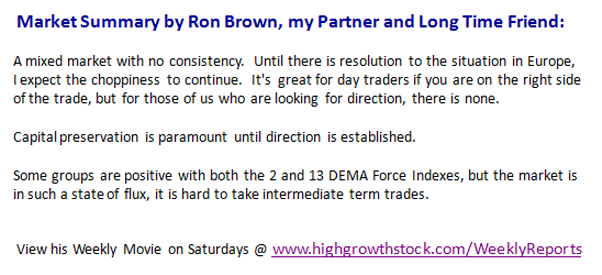
Here are some quick thoughts for the Long Weekend.  Ron Brown in his Weekly Report has captured the essence of the current situation and I have featured his comments below:

summary

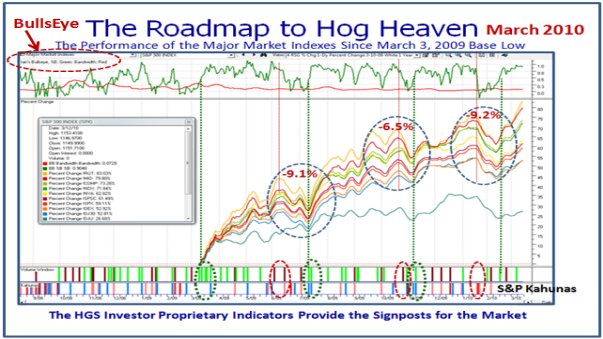
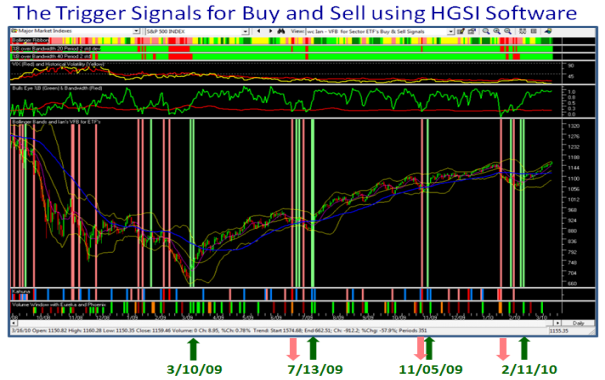
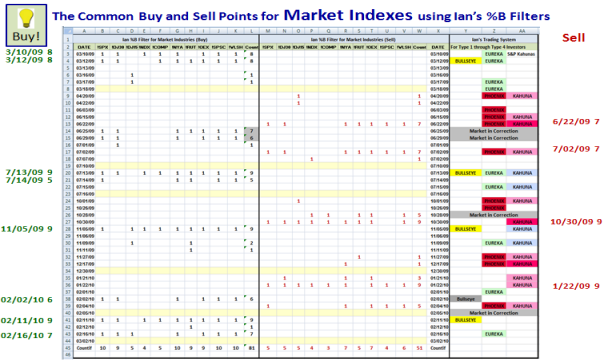
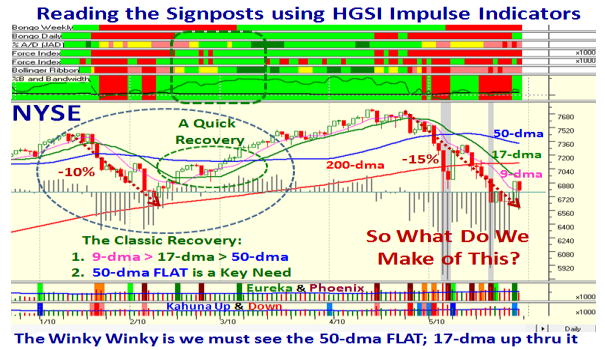
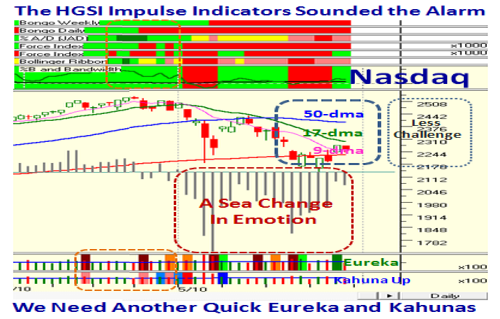
In times like these, use the HGS Strategy for understanding the Pulse & Emotions of the Market using Stakes in the Ground and Measuring Rods, and bolster your confidence with the HGSI Software Impulse Indicators to show you the Roadmap:

fog

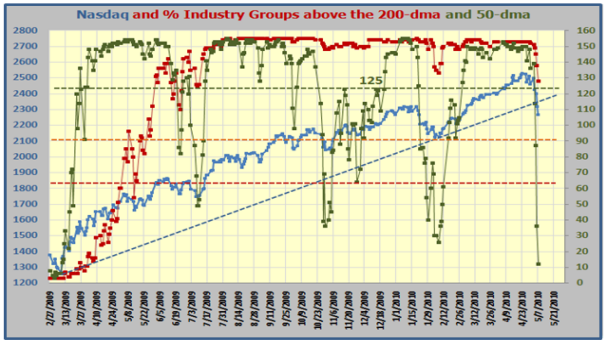
The first reason for the Intermediate Correction is the Nasdaq was well Overextended:Nasdaq Overextended 

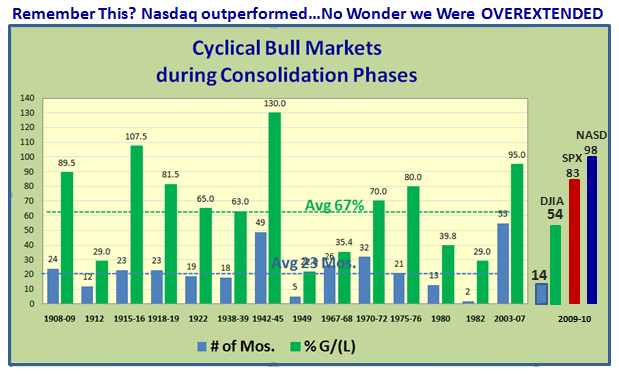
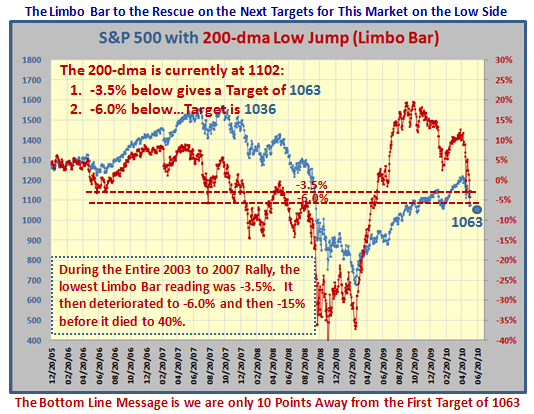
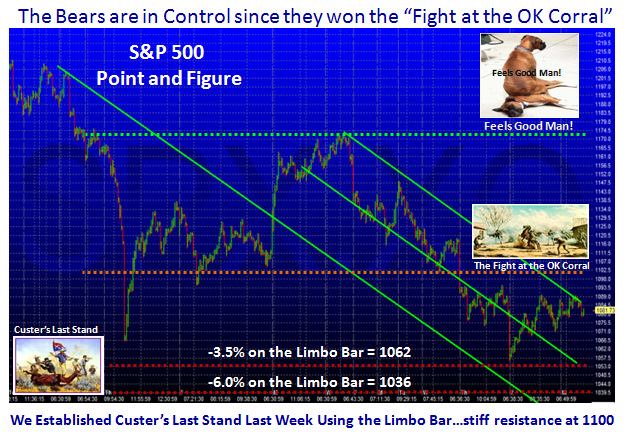
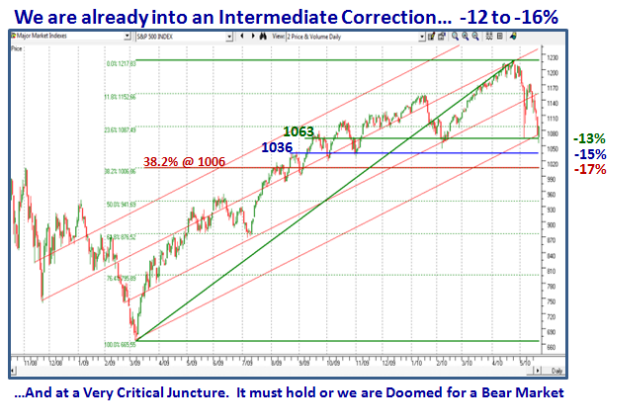
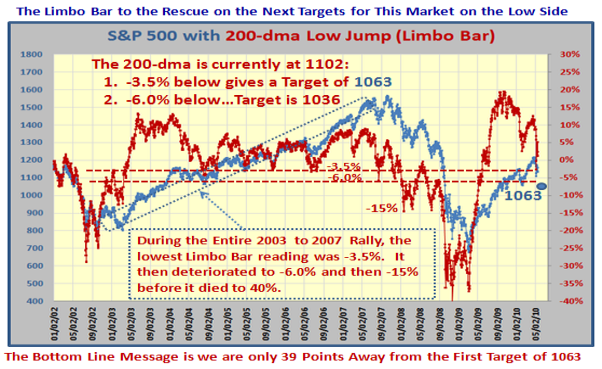
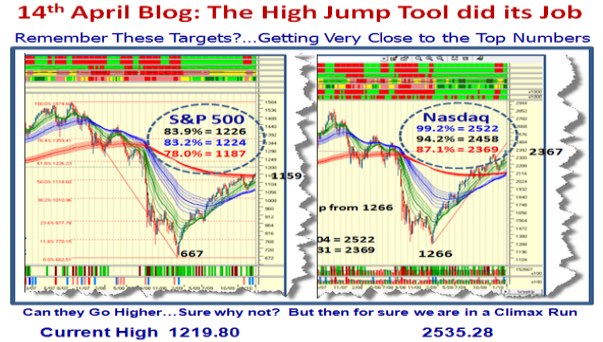
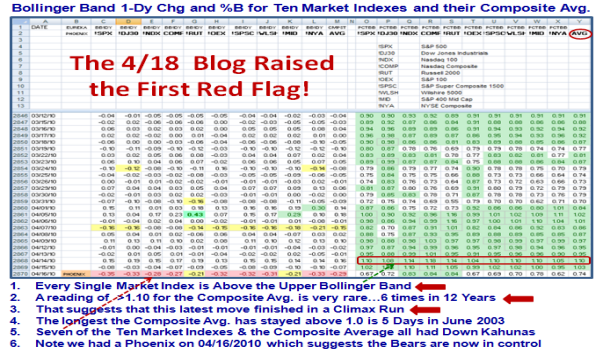
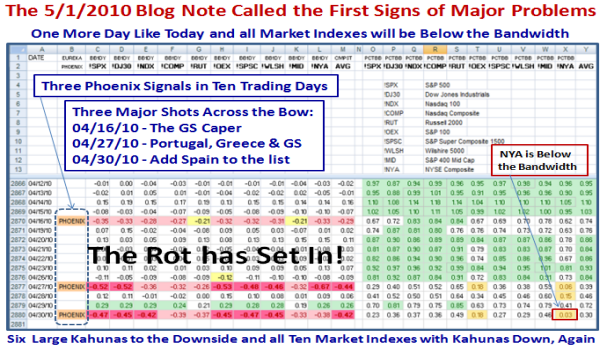
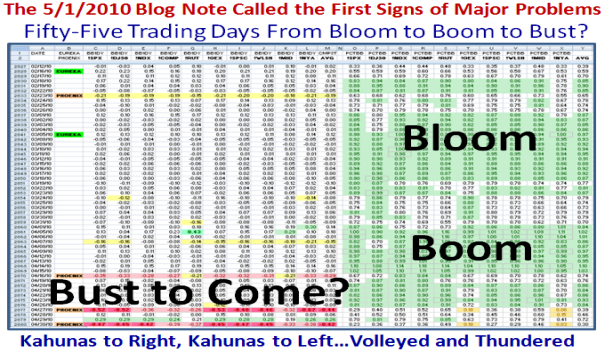
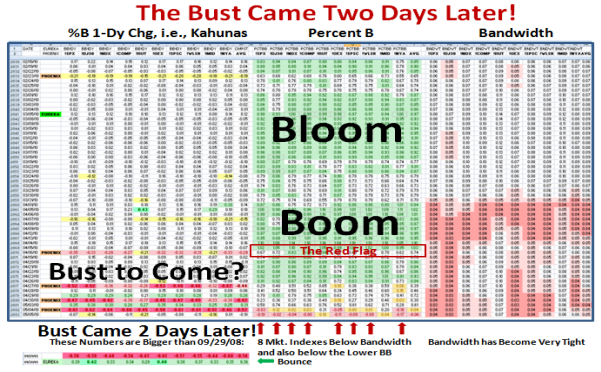
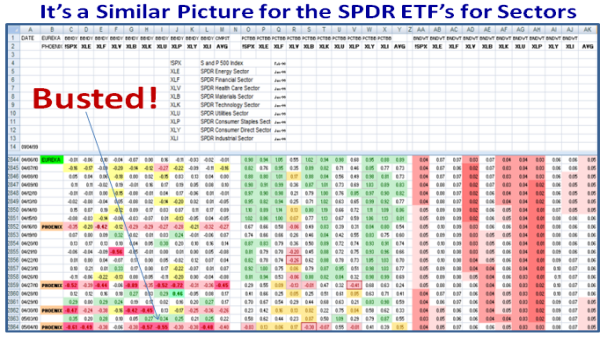
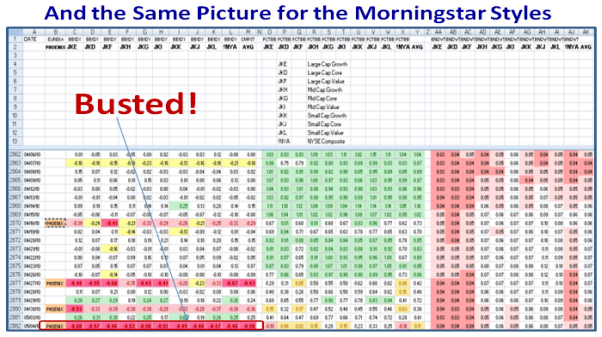
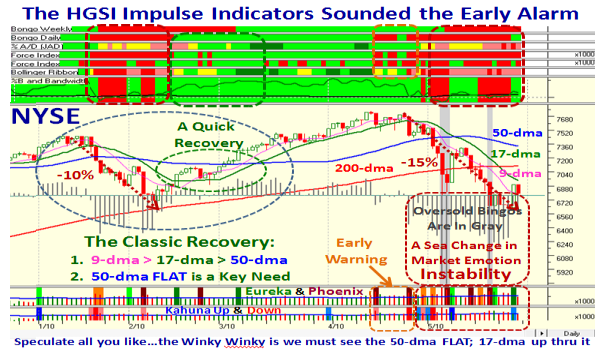
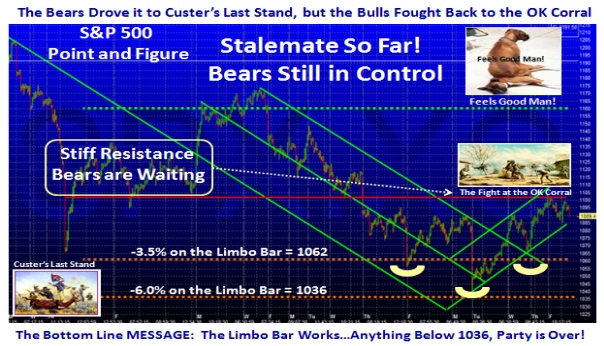
The next several slides show you the news related causes of the unstable Economy of the “PIIGS” and the calamity of the Oil Spill in the Gulf, which have so far led to an Intermediate Correction and is now in the balance as to whether we repair or go down further.  The Bias is downwards, but at least for now the Critical Lines in the Sand I have given you have held.  It shows that the High Jump and Limbo Bar are useful tools for establishing the potential Targets at any given point in time:

Signposts NYSE

NYSE Now

NYSE Last

Signposts Nasdaq

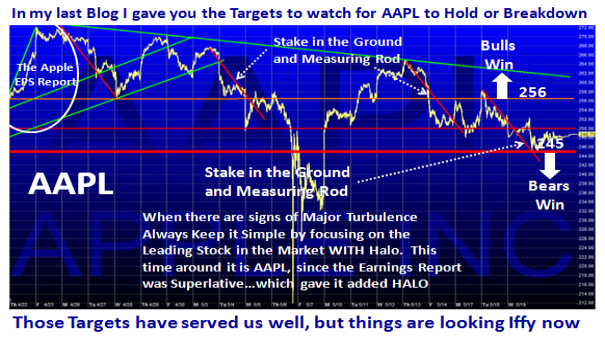
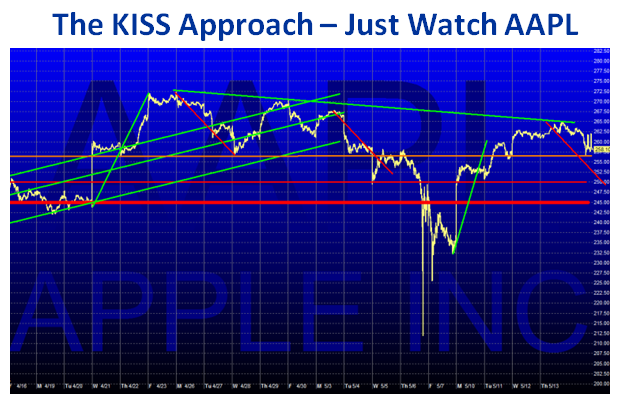
When the Rot set in I told you to keep it simple, and that was to zero in on AAPL, being the leading stock with lots of fresh Halo.  Note that although it too has suffered from the recent buffeting, it is holding up and may well be the signs of good times to come, but longer term players must still be patient:

AAPL Recall

AAPL Now

Custer

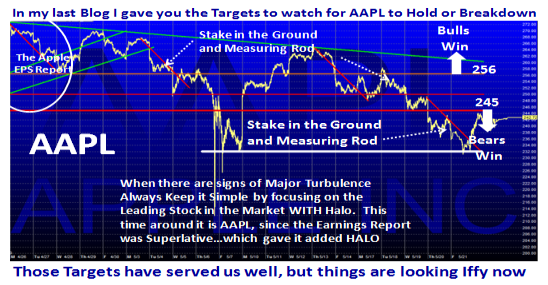
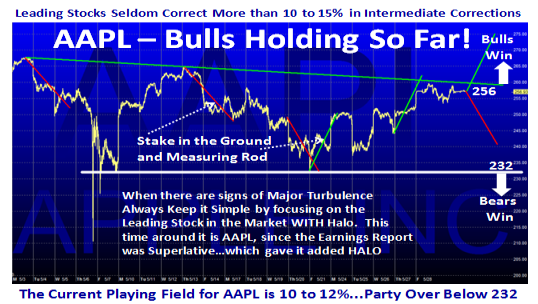
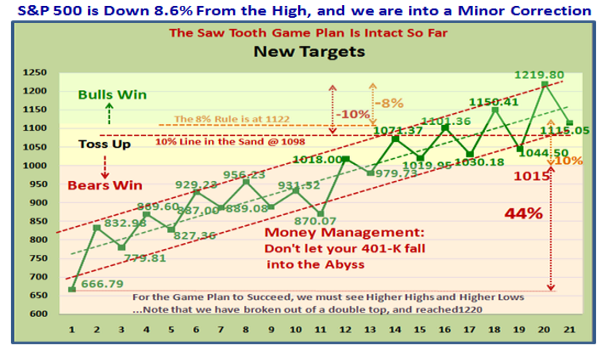
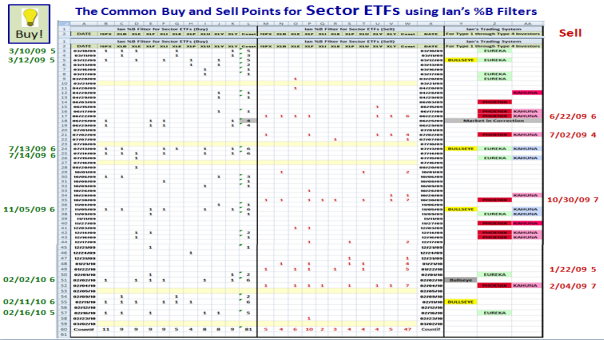
 The Immediate Targets to Watch For:

 Type 1 & 2 Traders play to your hearts content since you are nimble, but I wish you luck if you are to put up with the intra and inter day volatility where only the quickest of players can stay on the right side of the market and win.  Types 3&4 be patient, and remember just these few solid Stakes in the Ground and Measuring Rods:

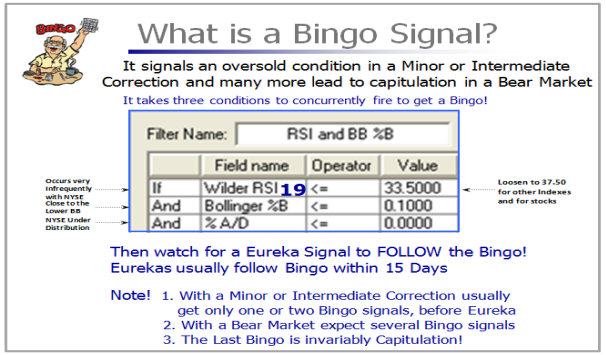
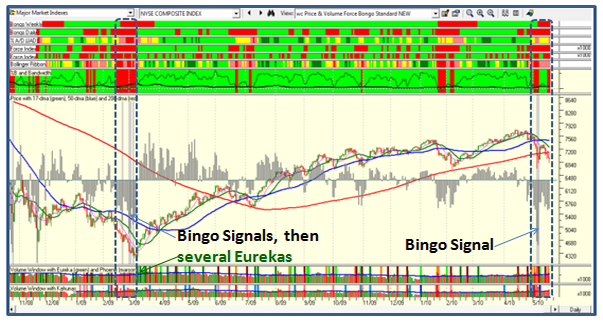
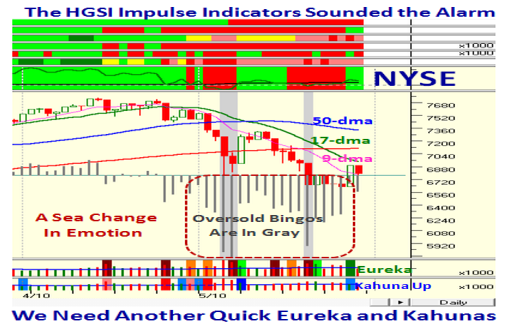
1.  We need more Eurekas confirming the Big Players have REALLY turned bullish

2.  The strength of their conviction will be with Upside Kahunas (1-Dy Chg in %B) firing at the same time

3.  Look for the 50-dma Flat with the 17-dma coming up through it at the 405 Freeway which eventually will happen “In the Fullness of Time”.  At that stage, Bongos Daily and Weekly will be Green, Force Indexes will be Positive and the RoadMap to Hog Heaven will be screaming GREEN! 

hour 

It’s not difficult with the IMPULSE INDICATORS we have in the HGSI Software.  Your comments and feedback below are always welcome in return for what the HGSI Team of Ron, George, Matt and I give you.

Best Regards, and spare a thought for our troops abroad and those who gave their lives for this country.  Ian

Stock Market at Custer’s Last Stand?

Monday, May 24th, 2010

When we reach a critical point in the Market, it is important to understand where the Lines in the Sand are at, and we are probably at Custer’s Last Stand: 

                 black

Last Week I used the Limbo Bar to establish the probable last lines in the sand and I repeat the updated chart below:

    limbo

There is little doubt that the Bears are in Control as shown by the S&P 500 Chart:

custer s&p 500

We have already dropped ~12% from the High of the S&P 500 so we are into an Intermediate Correction of 12 to 16%.  I show the Limbo Bar lines on the next chart along with the Fibonacci Line at 38.2% for 1006, so naturally 1000 is a good place to watch if the other two do not hold.   If that breaks we are into a Bear Market Correction:

custer chart

The Market will have to repair a long way back before the Bulls can “Feel Good”!

                   custer boxers

Good Luck.  Ian.

Stock Market: Scary Ride – Targets from Here?

Wednesday, May 19th, 2010

I just got back from a little R&R with my Son and his family, so here is an update based on a note I wrote to my friend Keith in New Zealand, which I answered yesterday, but have embellished today for all of you who read my blog.

                              scary

Question:  Hi Ian – so whilst High Jump helped identify possible tops, does any HGSI tool predict the likely level of falls in this new downtrend?

Keith  New Zealand

Answer:  Hi Keith – Yes, it’s called the Limbo Bar!  As you might have guessed, it is the reverse of the High Jump.  Let me offer a few pointers:

1.  I use Rules of Thumb which comes from over 25 years of experience:
      a.  Minor Corrections are 8% to 12%
     b.   Intermediate Corrections are 12% to 16%
     c.   Major Corrections are 16% to 20%
    d.   Bear Markets are >20%

2.  As I am sure you have heard me say if you read my blog notes faithfully…There is a 75% probability that the S&P 500 will correct no worse than 8% Close to Close and then rebound.  Heaven help you after that as it can fall anywhere.  We are on the hairy edge by being 8.6% down from the high with no cushion:

saw

3.  We are also close to the Bottom on the set of Targets I gave you for AAPL last week:

scary ride

4.  There is an excellent blog note I wrote on the subject with all sorts of statistics that you can read about if you will take the trouble to scroll down to  November 23rd, 2008 labeled “The Worst Market Conditions since 1937, Surpassing 2002”.

5.  No tool can FORECAST HOW LOW this correction will go…if you find someone who can do it, please let me know.  We have two good tools in HGSI which help define the Targets, one is the Limbo Bar and the other is Bingo followed by Eureka(s) to start a fresh rally.

6.  The Low Jump or Limbo Bar:  This is the % distance of the 200-dma of the S&P 500 to the Low of the Index as shown in the next chart.  Our past experience for the 2003 to 2007 Rally gives us an excellent perspective of what to expect if the Rally is to continue and the Targets that must not be exceeded as shown below:

limbo

7.  The Bingo Accompanied by Eureka(s):

bingo

ss

However, what we also look for is a Bingo followed by two Eurekas in quick succession to suggest that a Bottom has been reached.  Alternatively, if the market just deteriorates from here, you will see several Bingos (grey bars on the NYSE chart using the wc View).  Eventually there will be several Eurekas to suggest the Bulls have finally got control and we start a new Rally upwards.

wc

Now that we have a Guideline, either sit out for now, or Short, or sharpen your pencil for New Leaders from those that have not broken too much during this downturn.

Best Regards, Ian.

Keep It Simple – Watch AAPL

Thursday, May 13th, 2010

This is the shortest Blog I have written in three years…for good reason:

1.  On Your Marks if it breaks the Orange Line at $257

2.  Get Set if it breaks the small Red Line at $250

3.  Go…you are out of here if it breaks $245

4.  Stay Happy if it breaks 265 to the upside

aapl

Best Regards, Ian.

BullsEye on the Markets, ETFs and Stocks

Saturday, May 8th, 2010

One of my favorite sayings is “Keep a Beady Eye On….” Over the years I have also given you the BullsEye on the Markets, ETFs and Stocks as I now chalk up going into my fourth year on this Blog.  Those of you who are our strongest supporters know there is always a tid-bit of information in each blog note relating to which way the wind is blowing, if you would only take the time to look for it.  This is a “Teaching Blog” and gives something back  to those who are eager to learn.

party

Over the course of the last six weeks here is a synopsis of those clues to stiffen up your backbones that Impulse Indicators in the HGSI Software give you eyes in the back of your head…if only you will take the time to look and use them. 

March 30th Blog:  “The single most effective slide that shows the power of the product’s strength is its proprietary Indicators as shown in this next slide.  Now that we have a year’s worth of this booming rally, a picture is worth a thousand words to show that power”:

hog

Fast Forward to 14th April Blog: Recall the Targets I gave you at the seminar and have since posted twice on the blog…it suggests we are very close to the top for now.  I have updated the final Highs on the chart for your convenience:

high

18th April Blog:  My sincere thanks to Messrs. Bill Roberts and Tom Ellis for this spreadsheet, which gives us “Eyes” in the Back of our Heads”:

4

May 1 Blog:  Gave you two views that said “Bloom, Boom, Bust to Come?”

phoenix

bloom

The bust came two trading days later on 5/4/2010 as I explained to the HGSI San Antonio Group last Thursday in a Webinar that Ron and I did for them, where I used the following slides  at that time:

bust

spdrs

styles

So I am sure by now, some of you are saying “That’s all very well, but Where’s the Beef?”  It’s the Impulse Indicators that give the Trigger Signals to be found in the HGSI Software.  Here’s a teaser for you:

trigger

But more importantly, the message is that they all fired on the same Golden Dates of 3/10/09, 7/13/09, 11/05/09 and 2/11/10.  That should stiffen your backbone.

mkt

 If that is not enough, you ETF Fans had the same signals:

etfs

And if that is not enough, anything beyond 5 days makes this technique a better winner!

results

Late Breaking News…I don’t have to tell you: bottom line we are in a mess:

late

Hurry, hurry, hurry to Dallas where my good friends Ron Brown and Dave Steckler will be speaking at the MTA Associations Seminar next weekend and hopefully can point them to this Blog on the subject, while I enjoy some R&R with my Family.   Furthermore, sign up now for the HGS Investor October 23 to 25 Seminar or send me a note to ian@highgrowthstock.com to put you on the list of possible attendees.

spider

Best Regards, Ian.

Copyright © 2007-2010 Ian Woodward
Disclaimer: Commentaries on this Blog are not to be construed as recommendations to buy or sell the market and/or specific securites. The consumer of the information is responsible for their own investment decisions.