Ian Woodward's Investing Blog

Archive for July, 2010

Reset the Market for a Rally?
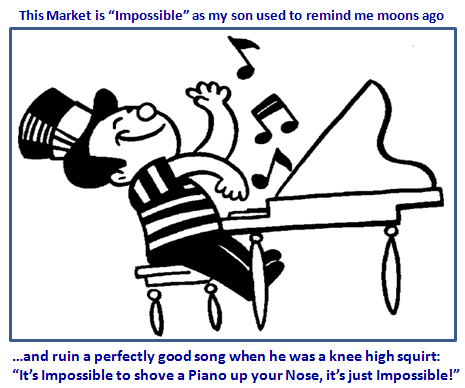
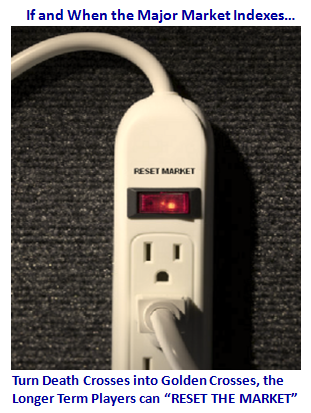
Sunday, July 25th, 2010

My good friend Mike Scott sent me the following picture to use when appropriate.  The Bears are saying “Not so fast my friend”, and they are right until the Bulls turn Death Crosses into Golden crosses.  Only then Longer Term Players can “Reset the Market”.

                               Reset picture

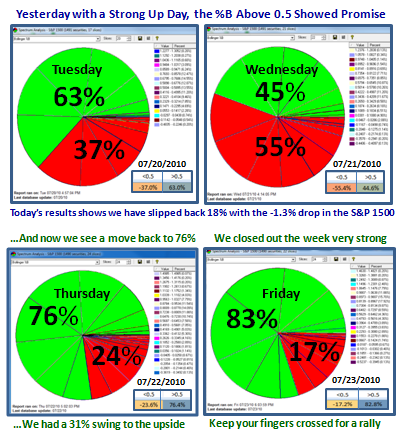
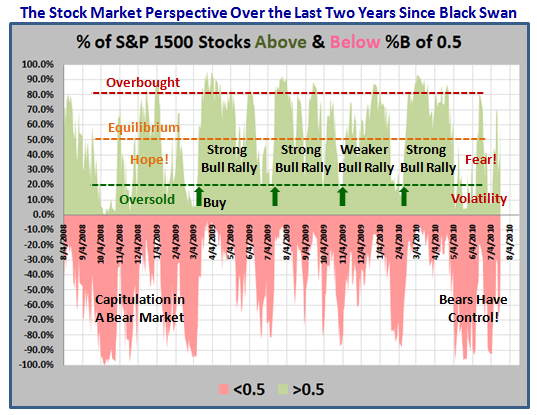
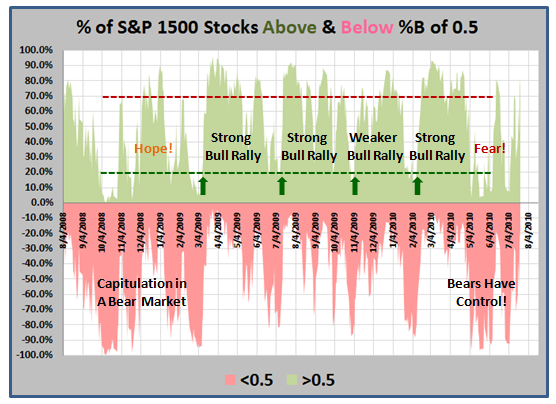
So, let’s review the bidding as we go into a fresh and critical week.  I offer you two charts using %B for a User Group of ~2750 stocks and the S&P 1500 showing their history over two years.  They are self explanatory.  The Message is “CONSISTENCY.”

    2750 stocks

    1500

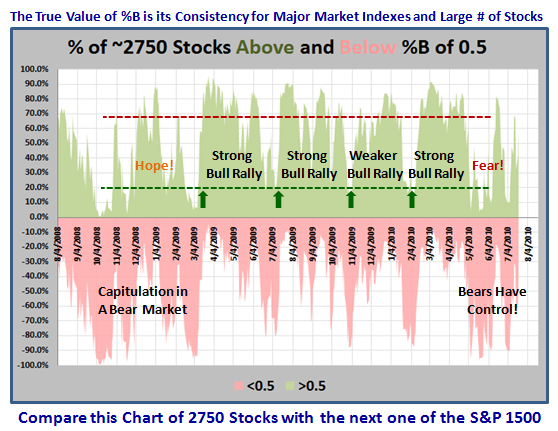
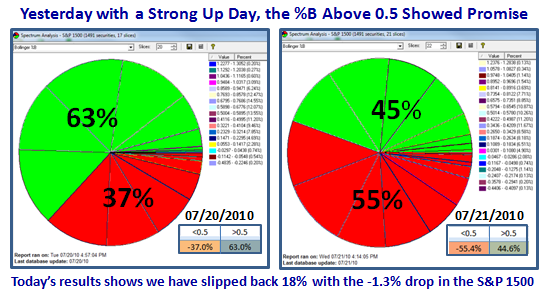
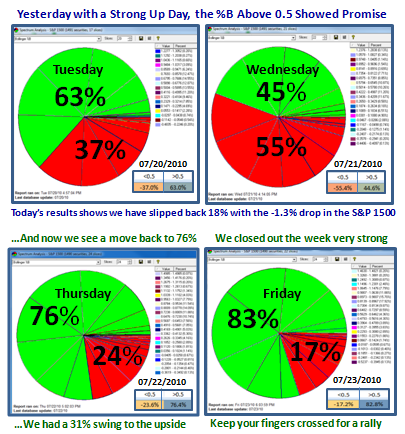
The next chart I used in my last blog, but felt it important to show again here for the continuity of the message which is that things are perking up for the Bulls, with a big swing to the upside in %B stocks for the S&P 1500 over 0.5:

               Pie

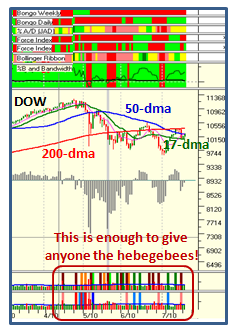
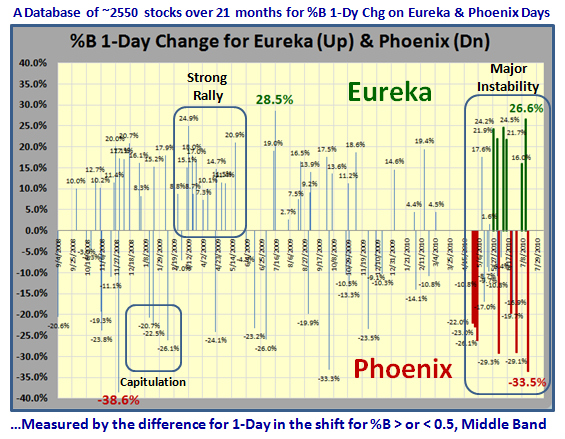
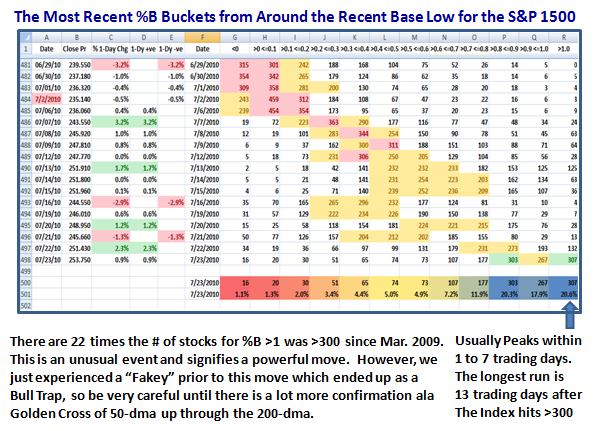
This next chart has a lot of information in it, which you should study carefully.  It starts with the Phoenix on 6/29/2010, leading to a Base Low on 7/2/2009, as shown.  I have shown a heat map to depict how %B was predominantly down in the dumps at below 0.2.  It has risen rapidly in the past two weeks to finally sit with 300 stocks of the S&P 1500 above 1.0, i.e., above the Upper Bollinger Band.  “So What?” say you.  This is a significant milestone as it has occurred only 22 times from the Base Low  of March 2009, so it is a rare beast.  On the one hand it is a sign that the Market is repairing.  On the other hand, expect the market to peak usually within 1 to 7 trading days for this particular run, with the longest run being 13 trading days in July 2009, after the Index hit >300.  This is insight I garnered using Chris White’s EdgeRater Software…good stuff.

Heat Map

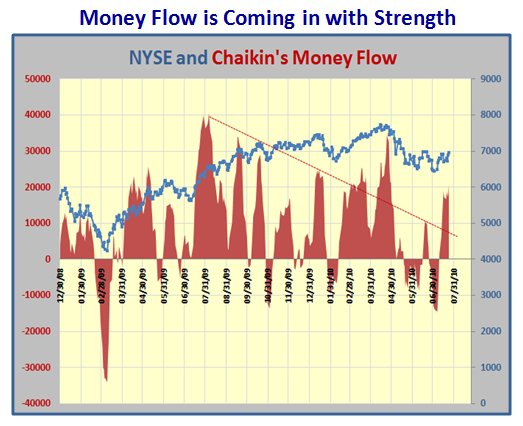
Bulls can also take heart in that Chaikin’s Money Flow is also looking strong:

          Chaikin

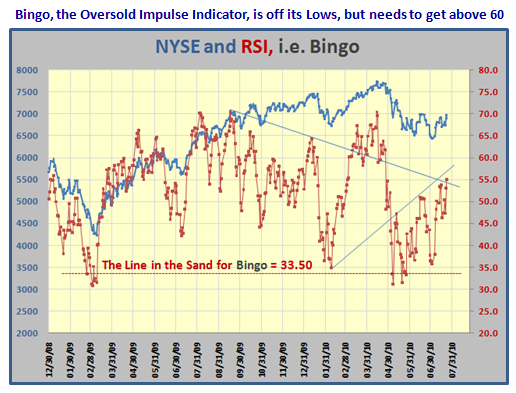
Likewise, the Oversold Impulse Indicator we call Bingo, is now well off its lows of below 33.50 when it signalled back in early May, 2010, and is now at around 55.  It needs to show more strength with RSI getting above 60:

           bingo

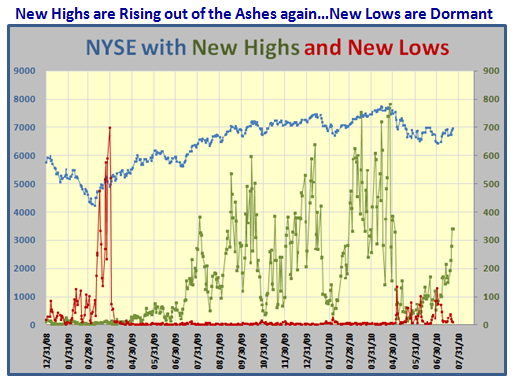
Furthermore, the New Highs vs New Lows Picture is improving with new high coming out of the ashes to a respectable >300 shares.  That also needs to continue:

           New Highs

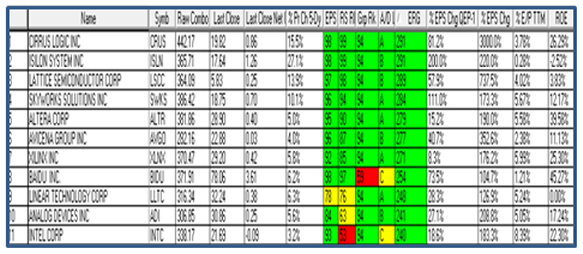
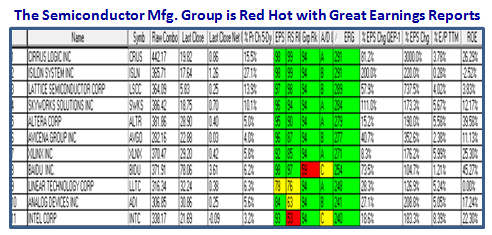
There are many Industry Groups perking up as a result of their Earnings Reports and one that caught my eye given their big Earnings Reports is the Semiconductor Mfg. Group:

             semis

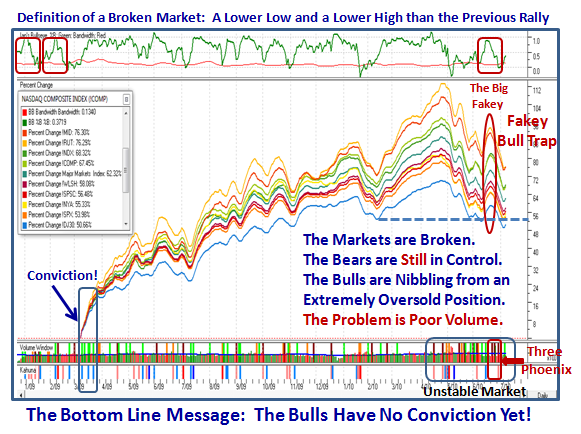
So all in all the Bulls seem to have many friends around them and it takes Solidarity to drive this market to new heights.  The bears are waiting rubbing their hands at the usual spot of a Head and Shoulders top, but until then there may be the ghost of a chance for the bulls to drive this market once again for a decent rally.  Of course there can always be the “Fakey” we experienced less than a month ago, so be on guard:

             Solidarity

May the Wind be at your back is the wish of your friend, Ian.

The Stock Market May Have New Life

Saturday, July 24th, 2010

There has been a dramatic change in the “Internals” of the S&P 1500 Market Index this past couple of days.  We show a big swing in %B above 0.5 to where the ratio is now 83:17 above and below 0.5, respectively, as shown below.  I have included the top two pie charts from the previous blog just to show the big swing in two days since then :

                 new life pie

Most Market Indexes have now poked their heads above the 200-dma, but a few notables have not, namely the NYSE, S&P 500 , OEX, S&P 1500 and the Wilshire 5000.  The Nasdaq, NDX, and SOX are all sitting right at or above their declining tops line from the highs last April, so next week will be a critical week to see if the Bulls can once again gain control and start a fresh rally.   This is particularly important regarding the congestion of the moving averages at this stage and to drive them back up where Death Crosses turn once again into Golden Crosses with the 50-dma coming up through the 200-dma.

The Earnings Season is in full swing and mostly with positive surprises so this also bodes well for the coming week.  Unfortunately, the entire mood of the market is driven by “Late Breaking News” and the Dollar Index, which has been falling of late and is therefore supposedly good for the stock market.  The late breaking news is what causes the wild swings intra-day…witness the Tuesday shellacking when Helicopter Ben acknowledged that the economy remains “unusually uncertain”.  By that evening the %B of the S&P 1500 stocks had shifted to a 18 point negative swoon to below 0.5, destroying the hopes for a new move up from the previous day’s positive outlook.  However the moves on Thursday and Friday have confirmed the sudden rush in enthusiasm to the upside as shown by the big two-day swing on the chart above.

The VIX is once again right at its 200-dma and needs a strong nudge down to once again allay the fear factor element which has recently crept into the equation.  Since the Semiconductor Mfg. Group is the standout this earnings season along with BIDU in the Internet Service Group, here is their recent performance to give us hope for a new Rally led by Technology:

semis2

Best Regards, Ian.

Only Hot Shot HFTs & Intra-Day Traders Need Apply!

Wednesday, July 21st, 2010

Is it any wonder that the general public is completely turned off by the shenanigans of this market?  High Frequency Traders (HFTs) and Hot Shot Intra-Day Traders are just loving this volatility, but Type 3&4 longer Term Investors will do well to stay in their cubby-holes until the dust settles.

           piano

Helicopter Ben came flying in today and dropped different leaflets than Dollar Notes, acknowledging that the economy remains “unusually uncertain”.  All of that was enough for the Dow Industrials to drop 109 points to close at 10,120.53.   The S&P 500 Index lost 1.28% to close at 1069.59 and the Nasdaq Composite fell 1.58%, closing at 2187.33.  Treasuries and the U.S. Dollar gained ground.  Volume was a lot higher today than on yesterday’s up day, and as Bill O’Neil reminded us last night at an IBD Meeting in Palos Verdes this would again be another sign of distribution to once again confirm the Phoenix of 7/16/2010 and that the Bears were in complete control.  Today’s action negates yesterday’s reversal from an abysmal opening of over 100 points to finish up 75 points.   He had precious little to say about Follow Through Days (FTDs) and he intimated the best place to be was in cash, recognizing that he was talking to the general public. 

Virtually all of these Major Market Indexes have Death Crosses now so until that problem of getting the 50-dma once again above the 200-dma is rectified, make no mistake about it that the general trend is still down.  There is too much resistance right now to break through above these moving averages which are all bunched together, and it will require some stunning positive news unlike the gloom and doom that Uncle Ben delivered today, who is invariably a straight shooter.

                                   dow

I thought it would be fun to show you how the last two years of Fear, Panic, Capitulation, Hope, Relief, and back again through the prism of the %B Above and Below 0.5, and here it is:

Hot %B

And finally, I am sure you would like to see the shift from yesterday’s action to today in the 1-Day Change in %B for the S&P 1500 which shows that any form of rally is one step forward and two steps backwards these days:

hot pie

Best Regards, Ian.

The Bent Fork in the Road

Sunday, July 18th, 2010

Sad to say I got hijacked and my address book was pilfered.  I apologize to any of you who got a spurious message from me, but I am sure you ignored it if you did.  I am back in business thanks to my good friend Bob Meager who sorted the bug out.

                             mailer

As a follow up to my last blog where we were at the crossroads, Friday’s debacle leaves little for the hopes of a bull rally except for a miracle this coming week, and suggests the Fork in the Road is bent to the downside:

                        bent picture

 My friend Armand asks among other things “…The logic would suggest that if the distribution was also a Phoenix, it would dramatically increase the chances of the failure rate.”  As Ron and my supporters of the High Growth Stock Investor Newsletter will know, we now have good insight not only in the fact that a Eureka or Phoenix occurs, but also the intensity of that Impulse Signal.  As a follow up to the HGS Investor Newsletter published last Friday, here are two slides hot off the press to give you a feel for the power of Friday’s Distribution Day, but also what we can now do in gauging its strength or weakness as well.

pie chart

The Pie chart depicts the three day shift from Tuesday to Friday of those stocks in the S&P 1500 which were above (Green) or below (Red) the Middle Bollinger Band of %B at 0.5.  The shift is dramatic, and shows the extent of about a 2% one-day change in the Index.

 eureka

The chart above shows the history of all Eureka and Phoenix Impulse signals for the past 21 months or so, and as you can see from the reading at the bottom right, we suffered a -33.5% 1-Day Change in the Database of some 2550 stocks to the downside of the %B 0.5 line.  It is the second worst reading recorded.   We can now measure the intensity of the Impulse Signals.  Friday was as bad as they come.  So, Armand, you got more than you asked for and don’t forget the “Diamonds for Suits!”

Best Regards, Ian.

The Stock Market Fork in the Road

Saturday, July 10th, 2010

                                  fork

My good friend Mike Scott sent me this picture some time back which I felt was appropriate to use on this occasion.  The Bears are saying “What Fork in the Road?  After this little rally from an oversold market, we will be headed down once more.”  And the Bulls are hoping that with supposedly stellar earnings to come starting this week, the worst is behind us and we are in the recovery phase, albeit a trifle tepid by way of a rally without good volume so far.

roadmap

Since you are now all familiar with the Roadmap chart which shows the rise and fall of Key Market Indexes, I need only point out the most recent changes since you last saw this picture.

1.  When a Market suffers a Major Correction where the High to Low % change is 16% to 20%, we are just short of a Bear Market and it takes a lot to extract oneself from the mire.  That is precisely where we are.

2.  We have learned that two Eurekas in a row coupled with a Kahuna is not good enough to avoid a Bull Trap, which we saw over a week ago.  The same thing goes for Follow Through Days (FTDs) which got equally bounced around two days after they were declared. 

3.  Minor Corrections of the previous three we had in 2009 and the recent one in Feb 2010 can sustain a potential one or two day drumming from the Bears through Phoenix signals, but when they have either an Intermediate or a Major Correction under their belt, watch out for a Fakey!

4.  That is precisely what happened.  We had three Phoenix Impulse Signals in quick succession on 6/22, 6/24 and 6/29 to take us down to a -17.4% Correction, High to Low on the S&P 500, with Black Crosses appearing two-a-penny on most of the Indexes.  So the Bears were whooping it up.

6.  Not even a % B reading of well over 0.8 could protect the Market from tumbling into coming down to break the Bandwidth (red line, top window) yet again, the likes of which we have not seen since Black Swan days back in early 2009, when this market was trying to recover from an extremely oversold situation (look back to the left hand top of the chart).

7.  The Bulls are now nibbling from an extremely oversold position with the Eureka signal on 7/7, and we have had a tepid rally these last four days.  I say tepid since all the pundits will tell you “There is no beef in the volume”.

8.  I don’t have to tell you that we have an extremely Volatile Market as recorded by the yo-yo signals as shown at the bottom right hand side of the chart.

9.  The Bottom line message is that until we see the type of conviction we saw in March 2009 where we had a powerful move up on all cylinders: price, volume and momentum, the Bears will continue to enjoy the power they have missed for all of 15 months. 

Very short term Type 1 and maybe Type 2 Players can make hay in this market and  like Rumpelstiltskin spin straw into gold, but Types 3 & 4 need to be patient and wait for Goldilocks to give the all clear. 

Best Regards, Ian.

Copyright © 2007-2010 Ian Woodward
Disclaimer: Commentaries on this Blog are not to be construed as recommendations to buy or sell the market and/or specific securites. The consumer of the information is responsible for their own investment decisions.