Harnessing the Hindenburg Omen – Part 2
An appreciation from Paul, whom I have known for 15 years:
Ian, Your work with %B is simply marvelous! The new ability to use the Spectrum Analysis for %B outstanding!
Quick question, where did the term “buckets” come from? I know how and why you slice things, but the origin of the “buckets” term baffles me. Perhaps I missed the origin in a news letter or blog post.
Hi Paul:
Thanks for the feedback on %B which has moved the bar a notch higher. Here are the Golden Rules:
1. Having sliced things you put them in boxes or buckets.
2. Having used Boxes before with the nine box matrix which you learned about 15 years ago, we put these %B slices into buckets, <0, >0 <-0.1, >-0.2 <-0.2, etc.
3. The two most important are <0 and >1.0…they tell you whether the tide is out and all boats are stuck in the mud or the tide is in and all boats have risen to the point we are overbought.
4. Use it with the S&P 1500 and you won’t go far wrong. Any reading for %B >1.0 above 300 (i.e. 20% of the stocks) is good especially if it repeats itself frequently to prove the rally is still strong. Anything for a one day reading of %B>1.0 above 500 is rare and tells you that the Market is topping and within 12-15 days you should see it fall.
5. If you want to know the strength of the move, compare those in buckets >0.7 to those <0.3!
6. Bottom line: Think and sing “Ebb-Tide”.
Normally in the Days of Wine and Roses, with breakouts like yesterday, we would be off to the races and expect that it was the signal for a long and decent rally. After all we have had three Eurekas with the last one triggered on yesterday. Again if you trot back to March of 2009, we would be cheering and saying that at long last we have come out of the gloom and doom of 2008 and starting a new rally. However, just look at the yin-yang today…that’s life in a jittery market.
Whether this is a continuation of the new Bull Rally or a Bull Rally in a Consolidation Phase of a 17-year Locust like Bear Market I leave to the pundits. What caused the sudden euphoria? Yesterday’s news by the pundits that the GREAT Recession was behind us in June of 2009! Yet one in seven are still without a job. Hence the jittery market we live in, and that is what matters. Seven years from now we will look back and say “You see, the Locusts do count in this Investing Business!”
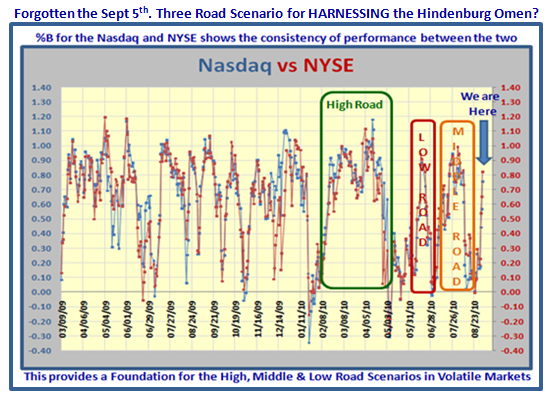
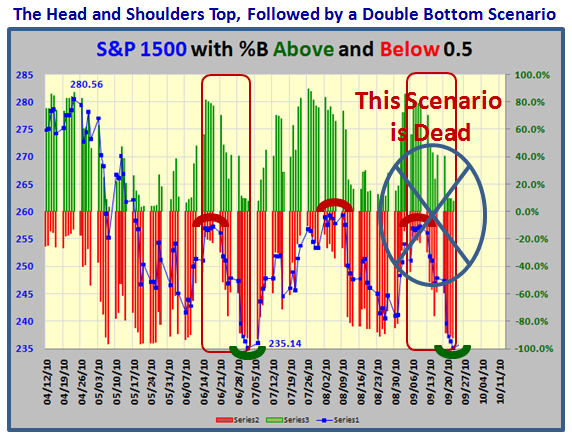
But who cares? This is not 2003, or 2007 or for that matter 2009. We are in the midst of harnessing the Hindenburg Omen Scenario which I covered with three roads in my last blog of September 5th. Don’t tell me you didn’t take stock of it…Here is the picture to remind you of the current state of affairs in a Jittery Market. It’s called the 20-day, 30-day and 40-day cycle (trading days) as shown below. The logic being that as each scenario is past in its trading days, the less the likelihood of that wretched beast the Hindenburg Omen poking its head up. Go back and read that blog, because that is the path we are on:
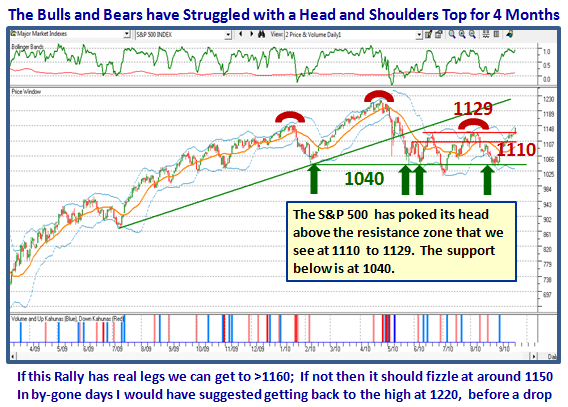
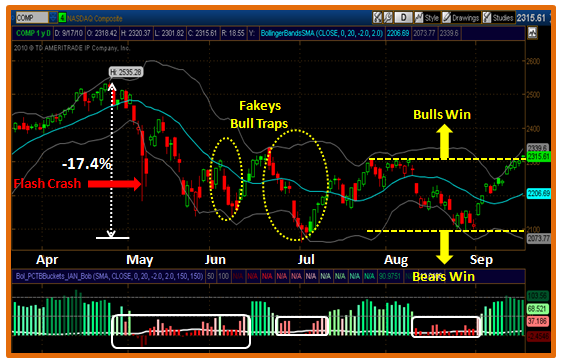
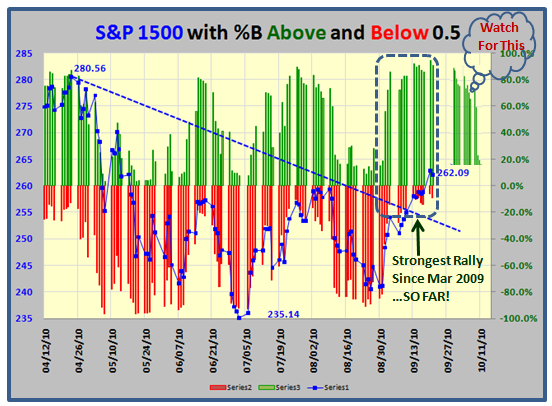
So where do we stand right now. Not difficult; After four months of a Bull-Bear fight, the Bulls have it for now:
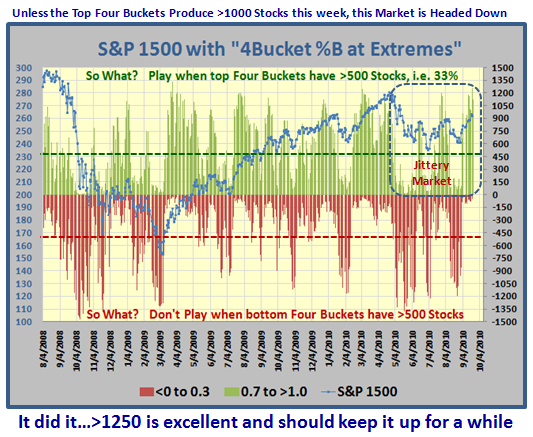
…And where have we come from and where are we headed in relation to %B and Buckets:
…And how do we confirm that this rally is currently as strong as March 2009? The evidence is three >300 days with %B Bucket >1.0 and the Current %B of the S&P 1500 these last two days up at 94.2% and 91.0%, respectively, which is very strong. In addition, we have had three Eureka Signals in the last three weeks which are essential at the start of a fresh rally. Therefore the Low Road Scenario for the Hindenburg Omen Harnessing is dead:
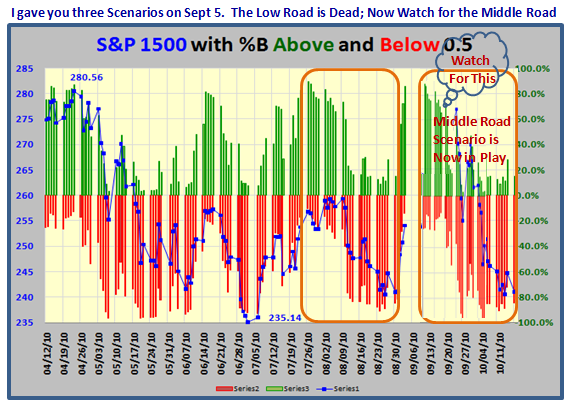
Now look for the Middle Road Scenario to happen…don’t know when and hence I have included a gap before it begins to fall. When that will happen is in the lap of the gods. The two snapshots show what to expect, but from a timing standpoint given we don’t have an utter collapse, this should play out around the Mid-term Election timeframe:
But, as I have shown you, keep an eye out for when the stocks of the S&P 1500 top four buckets, i.e. >0.7 drop below 500 and those below 0.3 increase above 500! The longer it stays up, the Middle Road Scenario eventually gives way to the High Road Scenario. But let’s stay focused on the Middle Road for now. If it plays out, then it should bottom around the time of the Mid-Term Election:
Of course the Market is extended, but extended can get more extended until it dies. %B gives us the early warning signs usually before it does. You will learn all of this at the seminar in four weeks time. Hurry, hurry, hurry and sign up!
Best Regards, Ian.
 Ian Woodward's Investing Blog