 Ian Woodward's Investing Blog
Off to the Races or Left at the Post?
I don’t often start with a Caveat, but I sense we have the makings of a decent rally. However, as you well know, tricky as this market is, it can turn on a dime and fade next week. We dodged a bullet on Friday when we had a very strong 2% move in most markets which triggered the fourth Eureka in this past month. So enjoy the information below and use it as you see fit:

You are familiar with the following chart, but I thought you would like to see what has transpired with the Index of the Top 20 Market Indexes and XL Series ETF’s since last I posted this chart. Note how it dipped into the “Yellow” zone on Thursday, but shot right back up on Friday back into the “Green” zone by skipping a bucket in the process.

In the course of this recent rally we have had three days when the S&P 1500 had over 300 stocks with %B >1.0…the Upper Bollinger Band (BB). That is 20% of the stocks and is an indication of confirming the strength of the move. In addition we now show that the number of stocks with a strong ERG of 270 and higher recorded 46 stocks for those that also have a strong Bongo Weekly, i.e., Green. I show a sample list of the types of stocks that are leading the Market:

We will soon know if this Rally has some stuffing by keeping an eye on two important items.
1. The first is that we are at a critical juncture in terms of the Rainbow Charts for the swat of moving averages around the 17-dma, 50-dma and 200-dma, as depicted by the green, blue and red “waves” respectively. Note how they are about to go through the 200-dma to produce a Golden Cross.
2. If we look at the High Jump for the 17-dma and 50-dma together we can see that current reading is at around 13% above. We need to watch if this Index can stay up for either 3 or 6 weeks to give assurance that the Index continues to hug the Upper BB as it goes up:

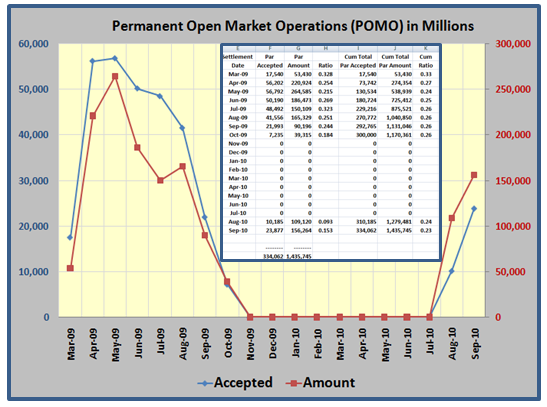
Now I am sure you are wondering what has caused the sudden change in the mood of the Stock Market when it seemed inevitable that we were headed down into a further Bear Market of 20% down with gloom and doom of a double dip Recession. It will not be a surprise to you that the Fed has started up the Quantitative Easing (QE) one more time with what is called Permanent Open market Operations (POMO). You remember the following chart which I have used back in 2008 and then again when POMO was introduced in October 2009 to explain the real reason for why we had such a remarkable rally through 2009:

It will also not surprise you that the fresh start on POMO began on August 17, 2010 just a couple of weeks before the fresh rally took off. The graph shows there was a nine month hiatus and the pumping of liquidity is off and running…the big winky-winky of the week:

Now let’s review the bidding in the “Harnessing the Hindenburg Omen” saga which I started a few notes back, and remind you that Scenario 1, the Low Road is defunct and we are now on the Middle Road, Scenario #2. Here is where we currently stand:

Case #1 which may peter out in a couple of weeks takes us into early October. Since %B for the S&P 1500 is back up at 89.7% (0.897), the Market has a fighting chance of staying up for the next week and then trailing off as depicted below. It is meant as a pictorial of what to expect and by no means am I soothsayer:

…And here is Case #2 which extends the rally into the 3rd week of October, just before the Seminar:

I’m sure you get the idea of what I am inferring as this would take us close to the 40 days or so since the last Hindenburg Omen fired. Let’s see what transpires.
Best regards, Ian.
