Ian Woodward's Investing Blog

Archive for November, 2010

Stock Market: Forewarned is Forearmed!

Tuesday, November 9th, 2010

My good friend, Robert Minkowsky summed up today’s action as shown below.  I used it as the headline to Grandma’s Pies, and you should all know tomorrow is crunch time.  We had a Shot across the Bow with a Distribution Day today, so keep your powder dry, your finger on the trigger and see what tomorrow brings. 

So far it is a natural and orderly pullback from an oversold Market, but tomorrow needs to perk up.  The Bears are still relatively dormant as seen by the Inverse ETFs, but with the heavy hit on Silver and Gold today and the dollar turning up, we can be in for more trouble on the Stocks.  Longer term it still feels like the Market Makers want to keep it bouyant!

Best Regards, Ian.

Stock Market: Uncharted Waters for %B

Sunday, November 7th, 2010

What a turn up for the books when the Stock Market took off on Thursday, November 4th, 2010, a day before Guy Fawkes Day when the Brits celebrate with fireworks catching the crafty fellow just before he attempted to blow up the Houses of Parliament back in 1605!  Uncle Ben flew in true to form with his POMO pumping of $600B, which drove the dollar down on that day, and shot the Market into new high ground for the moment.

As my good friend Ron Brown says “Watch the Dollar” so keep a beady eye on its direction and if it continues down so goes the Market UP!  The Uncharted Waters came in the number of stocks of the S&P 1500 landing in the %B >1.0 Bucket, with a resounding 570 stocks as I discussed in earlier blog notes the last few days.  Eventually we will pay the Pied Piper, but enjoy it while it lasts.

As we would expect, the Accumulation into A and B Industry Groups has risen to a healthy 70%, and there is still room to grow before we reach the danger zone of 75%: 

We are now into the 11th week of this Rally, and although we suffered from droopy drawers a week ago, the Market has new life which should live for another five to ten days before we see some form of correction.  Play this close to the vest but enjoy it while this rally lasts.  The financials have a shot in the arm to help boost things along.

We are now into New High Territory since the Peak of the last rally and are sitting at 282.52 on the S&P 1500, with 82% of stocks above %B of 0.5:

Note that the S&P 1500 %B is ABOVE the % Stocks Above 0.5, which is a rare occurrence:

The Low Road Scenario is a Shot Across the Bow…even if there is a big knee jerk down we have a decent cushion.  A one day drop of >1.5% in the Indexes should produce a Phoenix and a Little Kahuna to the downside, but one should only get nervous if the ratio of 1500 Stocks is <65:35 for %B above and below 0.5, respectively.  If it drops below that level, as shown by the dashed red line, the party is over.

So let’s turn our attention to the Higher and Highest Road Scenarios, and there is no better way to estimate this than to use the High Jump Indicator.  In addition, we can also use the recent statistics for when %B for the SPY reached these heights as I explained in a couple of Blog Notes ago.  Here are the key numbers from that Note:

Provided the pundits try to prop this Market up, it would not surprise me if they aim for 2700 on the Nasdaq and ~1300 on the S&P 500.  These are enticing round numbers which are certainly in reach for a climax run, and are not out of the equation for target setting:

Now let’s try my trusty High Jump for the Nasdaq using both the 50-dma and 17-dma:

Summarizing all of the above numbers leads us to watch 2610, 2650 and 2700 as High, Higher, and Highest on the Nasdaq.  You know my sign off lines by heart now…Never fall in love with YOUR Scenario.  By all means establish targets for the high and low road scenarios, since that is part of doing your homework.  However, let the market tell you which one it is on.

I hope you are enjoying this new stuff on blending %B into the equation to give us a good feel for which way the wind is blowing. 

Best Regards, Ian.  

A Special Hello to Theresa!

Saturday, November 6th, 2010

Theresa Wrote:

We really appreciate your prompt response to Robert via your blog so we all can benefit from your insight. We especially appreciate all the time & effort you put into digging up the old data to further substantiate your analysis.  You definitely have outdone yourself on this one!

Now may I ask 2 stupid questions?

1. What clues do we look for to see how long/severe the potential correction may be before we head for the Christmas rally?
2. Do you see a rotation out of tech sector into financial based on Friday’s action?

Theresa…Thank you for your note of appreciation.  You are one of the faithful ones who always gives encouragement, and you never ask “stupid” questions.

Here are the clues to look for:

1.  It’s back to basics…I taught Peter 15 years ago and you 10 years ago to watch the High Jump.  With a Strong Eureka coupled with a Breakout Gap up on most indexes (probably an Exhaustion Gap), we should expect strong momentum as evidenced by the 570 and 500 S&P 1500 stocks recorded above the Upper Bollinger Band, i.e. >1.0.  That implies that the High Jump will reach for its normal “Higher” record of about 23% for the Total of the 17, 50, and 200-dma as shown in “High Jump Individual Lines” in your Charting Module using the S&P Super Composite 1500 IDX in Major Market Indexes.  If the Momentum is relentless, expect this to rise to 30% as it did back in 7/09.  Although the Total Index itself may start down from its peak, expect the Market Index to continue up for a few days more.

2.  I also taught you that the Greatest Leaders rise above the 9-dma.  However, I emphasized that when they rise above the 4-dma to watch out for a climax run as Indexes, Industry Groups and Stocks cannot sustain that steep a rise for very long.   When the 4-dma turns down, and then plunges through the 9-dma (these days most use the 8-ema), the party is over, ESPECIALLY if there has been a 1-day correction of >1.7% in most of the Major Market Indexes.  Eventually the 9-dma (or 8-ema) will have crossed over down through the 17-dma, and if it is to be a severe correction, the 17-dma will break the 50-dma.  By then you snoozed too long so you will lose…big time.

3.  If we have a big correction, then for sure it will be accompanied by a Phoenix and at least a Little Kahuna to the downside. That implies that “Buckets” will be skipped to the downside. A little Kahuna means 2 buckets skipped and a Big Kahuna implies at least 3 or maybe 4 buckets skipped to the downside.  You have a lot to catch up with when you next attend the seminar.  I know, I know, happy family affairs are far more important.

4.  By then Elder’s Force Index 2-ema followed by his 13-ema (Ron’s favorite indicators) will have turned from Green to Red.

5.  More recently, you have learned about 12 Drummer’s drumming.  That suggests that we have UPTO 12 days before the current Rally corrects.  I covered all of that in my last note, so you are on guard for what to look for.  Please understand that the last long rally that ended after 65 Trading Days, took only two days to break from its high when it recorded over 500 stocks >1.0.

6.  Ron has pinpointed the action of the Dollar as a critical item to watch these days.  The market is currently working inversely to the fortunes of the Dollar.

7.  Again, as I have taught you for ages, no strong rally can have wings without both the Technology and Financial Sectors on fire.  As you well know, Technology has been strong throughout this rally, but the Financials have been in the dog house, and it is no surprize that the XLF ETF has taken off these last two days since the POMO action reported by Helicopter Ben of $600B.  I would be very surprised if Technology stocks gave up the ghost.

And there you have it!  Best Regards, Ian.

Stock Market: Twelve Drummers Drumming!

Friday, November 5th, 2010

I’m sure you are saying “A Trifle Early for the Santa Claus Rally”, but you take it when you can.  However, the message has a different meaning and one that should stick in your memory forever.

My good friend Robert Minkowsky as always is on the ball and wrote:

Ian; For the S&P 1500, %B > 1.0 was 570 yesterday or 38%. There was a Strong Eureka and we had 2 Little Kahunas this week. If we start counting the days of this rally from 9/1 today is the 47th day. The average of the # stocks > 1.0 during this period is 150. Your chart in the newsletter shows the top rally for the S&P 1500 at 52 days.

It looks as if we will break that barrier with this run that started yesterday and that may turn out to be a climax run.

Any additional thoughts?  Best regards,  Robert

Ah Robert!  You crafty fellow!  When I saw 570 and %B above the 1.25 threshold, I immediately went back to see if there were other recent occasions where that number hit the history books.  Not in my books that only go back to 1999.  However, I was lucky enough to find an article which says there have been three occasions on 11/06/1996, 09/05/1995 and 12/23/1991 on the SPY , i.e. the true days of wine and roses:

So,  if History is to repeat itself, we are golden up to the next twelve days.

But those few readings are not enough to have any statistical significance.  However, as luck would have it here is a sample of events that hit 1.15% for the SPY (not the S&P 1500).  It’s still not statistically significant, but close enough for Gov’t. Work to at least know which way the wind should be blowing:

Again, take this mumbo jumbo for what it is worth, but the message is that the losses are minimal and there is about a 75% chance that the Market will be up about 2% to 5% after ten sessions.  Your observation regarding my point in the newsletter is spot on about looking for a climax run, but let me take you back to an earlier Newsletter where I suggested that when the S&P 1500 reached above 525, that twelve drummers drumming was the answer! I said then:

“You will recall the following chart I alerted you with on the Blog Note of August 8th, just a week ago that gave us the clue that something unusual had transpired on 07/26/2010.   There was a sudden gush of 536 stocks in the S&P 1500 moving in one day to being well overbought and sitting outside their Upper Bollinger Band, from 307 stocks the previous day.”

In that Blognote of August 8th I posted this chart which suggests we have 1 to 13 trading days to the peak after the S&P 1500 Index hits >300: 

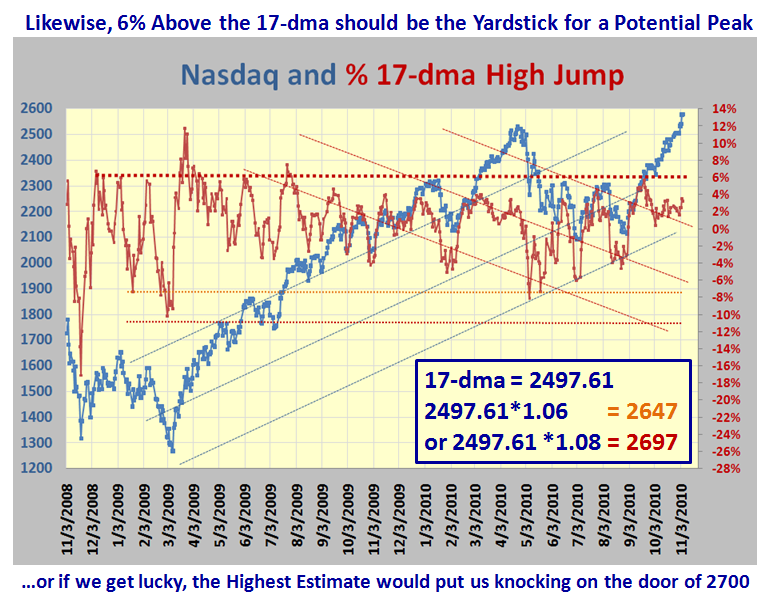
It goes without saying that this current “Bump Up” beats all others in strength, and the only caution out of all of this is that the higher they rise the harder they fall.  Remember that the most money is made and lost at the Fat Tails end of the business, i.e., >2 Standard Deviations, so Make Hay while the Sun Shines and keep an eye out for the Drummer Boy in Trading Days!  Now what should you turn to, to keep an eye on EXTENSION…the High Jump!  Corrections there will be, but how much is in the lap of the gods!

I know what you are all saying “So much to remember, Ian” but you must admit I do boil it down for you…if only you would remember!  I will use this in my Blog with a lot more to come and a Partridge in a Pare Tree!  I will do another note this weekend.

Best Regards, Ian.

The Bulls Have Breathing Room

Wednesday, November 3rd, 2010

Now that the Mid-Term Election and FOMC report are behind us, Bulls have breathing room to move this Rally higher.  We are now in the 10th. week, and although it is a long way from the gloom and doom days when the bruhaha on the Hindenburg Omen burst on the scenes on August 12th and 20th., we are now practically into the Santa Claus Rally period! 


We had a wild and wooly ride today and the High Frequency Traders (HFTs) had a field day when the Fed report on QE2 or POMO came out.  They shot the market down, took out all the stops and shot it back up again to finish up eking out a few points on the upside.

…And look what happened to the VIX at the same time.  It finished at below 20: 

The Quantifiable Edges Fed Day Guide suggests that the next ten days are in the Bull’s favor with a minimum of a 63% chance of a winning trade over the first four days and as high as 89% chance for a 6 to 8 day trade.

This market was stuck in the mud two days ago and now it is showing signs of life again.  The underying internals of the S&P 1500 has risen from the teetering stage to at least having some breathing room again, and Grandma’s Pies are a lot tastier and sweeter today, with the Inverse ETFs driven back into their cubby holes:


If we look at the %B for the Nasdaq and S&P 1500, we see they are well into the safe zone having jumped up from around 0.70 to the 0.90 – 1.00 area, which implies the Bulls now have a decent cushion should there be a strong shot across the bow:

You are all familiar with this next Chart as we have faithfully followed its progress for the last ten weeks and we are now coming to the end of High Road Scenario.  As you can see we were on the hairy edge of heading down, and although we are not out of the woods, at least the major divergence I showed in my last note has improved.

…And the last one which we have featured for the same time.  As you can see we are knocking on the door of a double top, which is where this Rally seems to be headed:

So, there you have it…as they said in days past “May the Force be with You!”

Best Regards, Ian.

Copyright © 2007-2010 Ian Woodward
Disclaimer: Commentaries on this Blog are not to be construed as recommendations to buy or sell the market and/or specific securites. The consumer of the information is responsible for their own investment decisions.