Ian Woodward's Investing Blog

Archive for February, 2011

This Stock Market is Back to Stalemate!

Saturday, February 26th, 2011

In my last blog I gave you the simple short term three road scenario for last Friday: 

  1. High Road Scenario – Big Bounce Play
  2. Middle Road – Pause to Refresh
  3. Low Road – Correction with %B below a ratio of 30:70

Well, we got the bounce play which was strong but not strong enough, so we now sit at “Pause to Refresh”.  This means that we wait for next week to see if the tug-o-war between the Bulls and Bears can resolve the Stalemate of the QE2 vs The Middle East Crisis & the resulting Price of Oil:


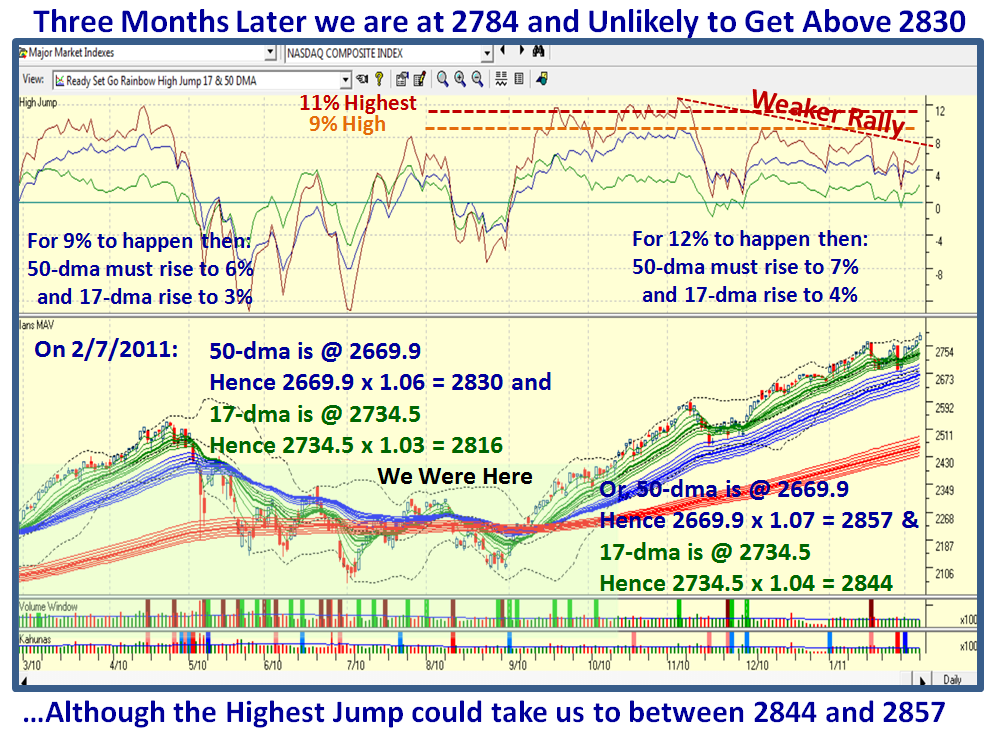
So why do I say “Stalemate”, you may ask?  It is just my way of stating the CURRENT Status going into next week.  My good friend Chris White who will be at the HGS Seminar from March 26 to 28 gave me the keys to paradise with his special set of software add-in that allows me to show you all this good stuff in relative terms.   You will recall the picture which I first gave you all of three months ago before the Santa Claus Rally where we were at a similar stage of events.  You will also recall that I informed you that the natural bias of the numbers for equilibrium is not 50:50 but 55:45 with a slight bias to the right hand buckets, otherwise the market would not have risen all these 100 years; so loud cheers for Chris with a Hip, Hip, Hooray!  Note that Bucket #8, >0.6 <0.7 is the one to watch in the sloshing exercise as the market swings to and fro.  When that is at a peak, you can expect a “Normal Distribution” which says the market can go either way.  Here is the picture for the S&P 1500 at that time:


So now, by comparison, we fast forward three months later and we are back to Stalemate, but with a decided positive bias from the previous day and a major gloom and doom picture (not shown) from the day before that…so you see a familiar picture:


Well, you say “Ian, that is only for the S&P 1500; what about the ten Market Indexes which you have taught us to follow?”:  Immediately you see that big shot across the Bow on 02/22/2011 and 02/23/2011, which took us from the Safe Zone up in the 80’s and 90’s to the dreaded 30’s in a matter of two days flat.  In addition, you will note that the Twelve Drummers are Drumming once again, and we shall see if the market will cave in or resurrect itself with all the QE2 pumping that is underway.   Note that the Bounce Play is not to be sneezed at as three Indexes gave Kahunas and the rest were close to that…look at the bottom line:


…And now for the clue by comparing the “Internals” of the Bucket Sloshing for this week to last week, and as you can see there has been a marked deterioration.  Also, note how %B itself for each of the Indexes has dropped in concert with the sloshing, confirming the picture I have just shown you above.

“What’s all that yellow stuff at the extreme right” you might ask?  That shows a quick way of seeing that the so called “Bucket Sloshing” is leading or lagging the Bollinger %B for the Market Indexes.  When the signs are minus in that column, the Internals are leading.  It stands to reason…no matter how overbought or oversold the market is, the buckets themselves above and below 0.5 are not going to be 100:0 or 0:100, unless there is an utter calamity ala 1987, which I haven’t seen in this work so far.  In other words there will always be a “residual %” in either the top or bottom half, and I have done the homework that says a good rule of thumb is around 85:15 or 15:85 for overbought and oversold, respectively.  Take that rule of thumb to the bank.  The precise numbers for recent tops and bottoms are shown below: 


Notice how the top and bottom buckets of >1.0 and <0  for Market Tops and Bottoms, respectively, vary substantially depending on the strength of the sloshing at the extremes of the Market.  It clearly shows the ebb and flow of the market which this is intended to demonstrate.  It’s no wonder that we hit rock bottom with 48% in bucket <0 at the time of the recent Flash Crash when the average of all ten Market Indexes came down to 4%:96%, the worst I have seen so far in these past two years.  Don’t forget that the resultant correction was >17% over three months.

So where does all of this leave us for next week?  I return to our favorite summary chart that shows the road map we have followed faithfully for the past 26 weeks of this rally and I have color coded the last week in orange to depict “pause to refresh”.  We are by no means out of the woods and although the Bounce Play on Friday was encouraging we need to see a follow through day with an Eureka to stiffen our backbones that the Middle East crisis has subsided for now and that oil is once again in check; and let’s not forget that Uncle Ben with his QE2 pumping remains alive and well and continues to rule the roost for now. 


This time in four weeks we will all be engrossed in the HGS Investor Seminar which goes from March 26 to 28 and it is high time you signed up if you intend to come.  Thank you for attending the Webinar that Ron and I held last Thursday night which had a good turn out.

Best regards, Ian.

Red Alert: Stock Market Pause to Refresh or Correction

Wednesday, February 23rd, 2011

After today’s action in the stock market, the Three Road Scenario in the short term is simple:

  1. High Road:      Bounce Play Tomorrow
  2. Middle Road:   Pause to Refresh
  3. Low Road:       Full Blown Correction

This next chart needs no explanation and is the evidence that we are at the critical point.  In my last blog note I said the critical level is 30:70 and we are currently at 34:66…close enough for Gov’t Work:

Ron and I look forward to seeing you at the Webinar tomorrow evening.

All the Best, Ian.

The Real Test for QE2 vs Oil Spike Fears

Tuesday, February 22nd, 2011

At long last the Bears are licking their chops and wondering if it is their turn  after 26 weeks of patience.  The Bull and Bear action of the next few days and the outcome in Libya will tell the story:

It goes without saying we had a Major Shot across the Bow today, with nearly a 4 bucket drop:

The drop is severe enough that there may be a reaction bounce, and it is the extent of that bounce together with whether the Bulls can hold the line which will determine if this was again a one day wonder or at long last the time to pause to refresh if not have a decent correction.  The oil spike needs to be watched tomorrow, though the Futures Market shows a small positive bounce as I write for the DJIA, the Nasdaq and S&P 500.

On Friday we were back up in the “Safe Zone” with %B above 0.5 for the S&P 1500 up at 0.80, a very healthy reading.   Today it is sitting at 51.8 which implies that we are at the “Caution” Flag.  If it drops to 30, the Party is over for now as shown by the following chart which you have enjoyed from the past:

I hope to see many of you at the Webinar that Ron and I are doing on the third session on Impulse Indicators on Thursday.

Best Regards, Ian.

QE2 is Afloat & Buoying Up This Stock Market

Sunday, February 13th, 2011

My good friend and partner, Ron Brown, is under the weather so you will miss his Weekly Review Movie.  I am giving you a quick blog note which adds little that you did not know already…The QE2 is Still Afloat and Buoying up this Market:


Just look at the difference two weeks make from the end of January to now and you will see that we went from the brink of a correction to full speed ahead and darn the torpedoes. They came rattling back into the Small Caps, but now all Markets are once again in Overbought territory.  This Bucket Sloshing keeps us abreast of which way the wind is blowing and to what degree.  So enjoy the fruits of my labors which will stiffen up your backbones to realize this is an unusual market in unusual times. 

We are now over 700 days since the start of the Rally back in March 2009, and this is the 12th time since 1935 that such a feat has been achieved in the S&P 500.  The stimulus for this event this time is undoubtedly the QE2 mumbo jumbo; enjoy it while it lasts, but watch out when this Ship drops anchor as we should expect the tidal wave to flip the other way:


We are just six weeks away from our next HGS Investors Seminar and if you intend to come, please drop me a line at Ian@Highgrowthstock.com and let me know…it helps us with the logistics at this end.  Enjoy your weekend.

Best Regards, Ian.

Stock Market: Don’t Count Your Chickens Before Hatched

Wednesday, February 9th, 2011

I’ve been fooled before and I’ll be fooled again, but this Market is a wonder to behold.  Inching up day-by-day on light volume and all we can point to is Uncle Ben and his wonder elixir called POMO or QE2!  That is the beauty of always having three scenarios and letting the market tell you which one it is on.  So, one more time the lesson learned is “Never Count Your Chickens Before they are Hatched”:

On January 28th, the Market Internals were signaling that we were on the brink of a correction, and here we are barely ten days later and it could hardly look stronger.  The Bears were denied and the Bulls came roaring back:

Here is the updated picture of the Yin-Yang with 5 buckets down followed by 4 Buckets up and now an overbought S&P 1500 along with all the other Market Indexes:

Helicopter Ben is still whirling around town with his QE2 and you may as well enjoy the complacency while it lasts:

At times like these, curb your euphoria to what are reasonable upside targets.  Once achieved, either set higher targets or watch out below.  There is seldom any better way of gauging what might be a reasonable target than the High Jump tool.  The next chart is a busy one, but if you haven’t learnt it by now, then it is high time you did.  When rallies get long in the tooth, they invariably show a tendency to be struggling on making recent previous High Jump targets.  In this case I am using only the 50-dma and 17-dma as my guide as we are already a trifle extended from the 200-dma to say the least.  Note how much weaker this rally is compared to the burst of enthusiasm from the 9/1/2011 timeframe to that small pause to refresh in November for two weeks just before the Santa Claus Rally.  The bottom line is that if this rally continues to show strength then around 40 points higher is as much as one might expect.  I show the targets for both the High and Highest Scenarios.  Don’t quarrel with me for not showing the Highest at 12% at this stage of events.  Let’s get past 11% first:

That should give you plenty to chew on till the next time. 

Best Regards, Ian.

Copyright © 2007-2010 Ian Woodward
Disclaimer: Commentaries on this Blog are not to be construed as recommendations to buy or sell the market and/or specific securites. The consumer of the information is responsible for their own investment decisions.