When the Bough Breaks the Canaries Will Fall!
June has invariably been a volatile Month over the past six years, but the week going into the July 4th Holiday should give us a “Kicker” to the upside.
At times like these where the Market is Oversold but has failed twice in recent weeks to achieve any reasonable Bounce Play, it pays to evaluate both sides of the coin.
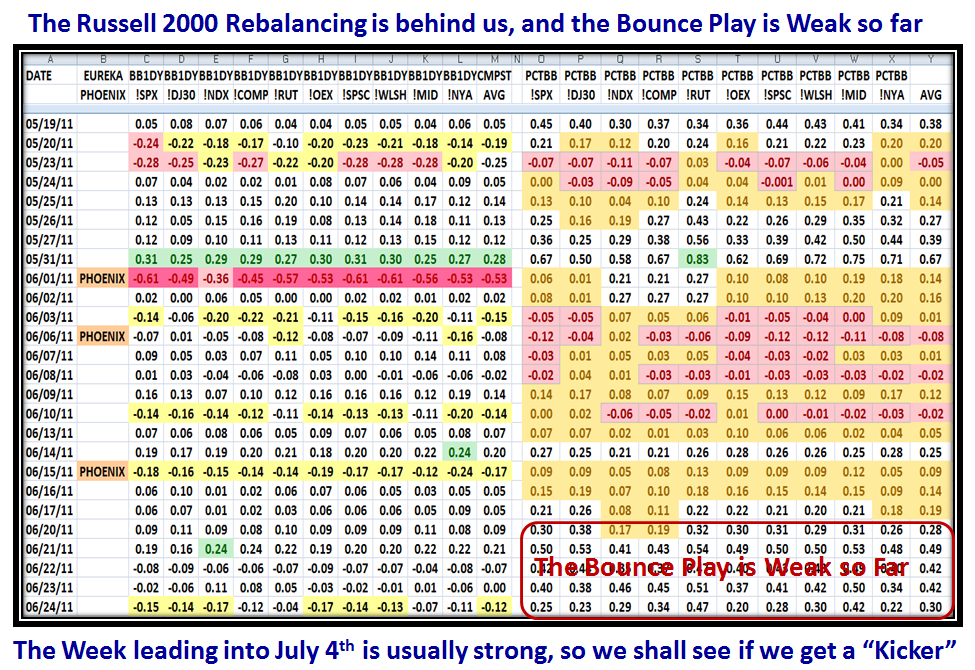
Maybe it is the time of the season when Graduations, Weddings and Vacations are affecting the results as usual, but the Bounce Plays these past ten days have been putrid to say the least and given that, the natural bias is that the Market is headed down further. However, as I constantly remind you it is a quirk of History that 70% to 77% of the time for the Nasdaq and S&P 500, respectively, the Markets turn back UP from this level. We are now at that crucial point, so we shall see if the floodgates open and we head down or we hold here and at least have a decent bounce play going into July 4th:
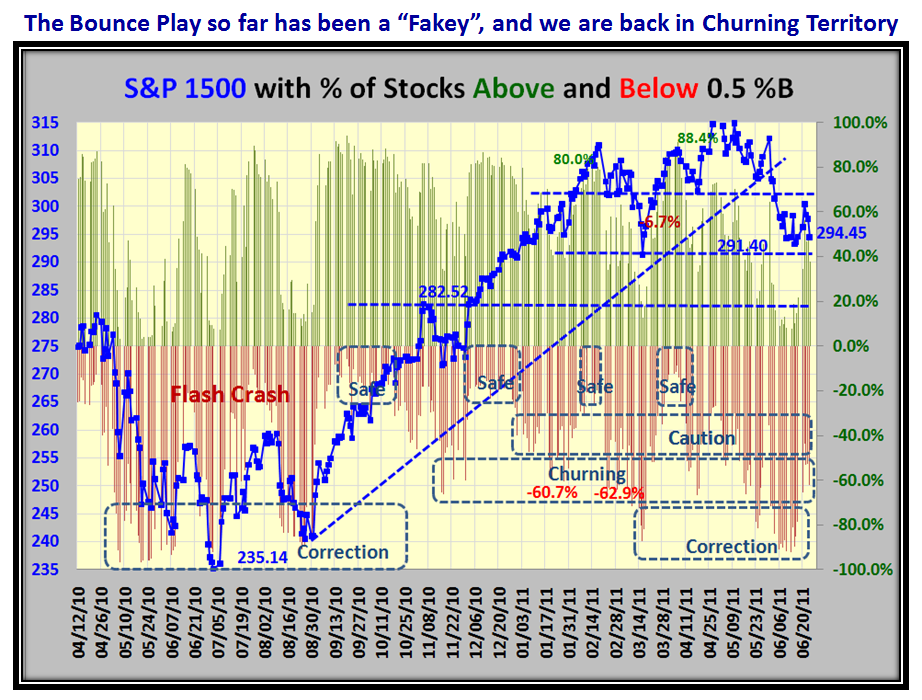
…And for those who prefer to see the various levels of Correction, here is that view. it is not surprising we are “Churning”:
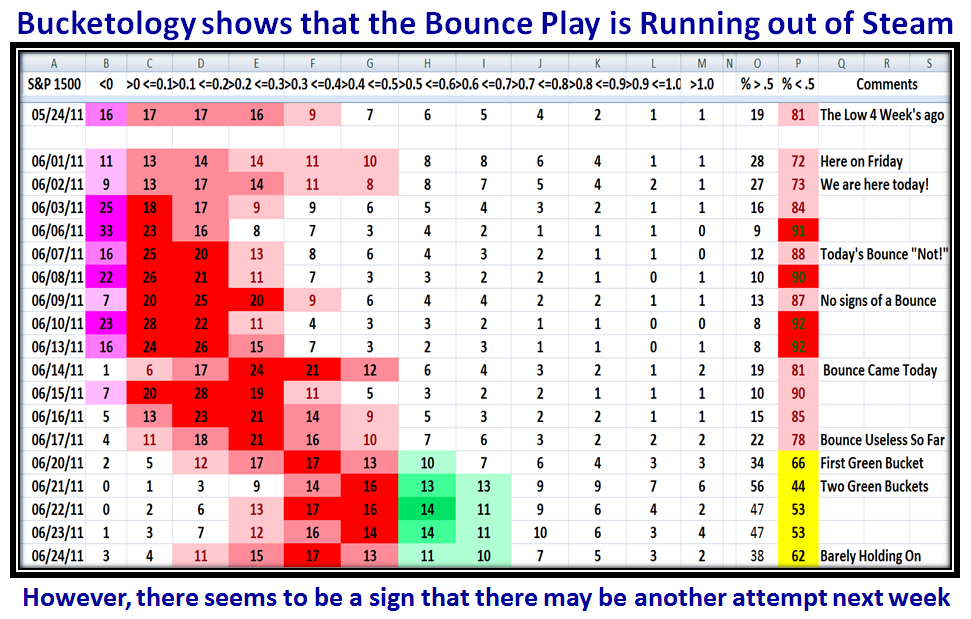
For those who avidly follow the Bucketology, the picture is no better and on Friday we headed down one more time:
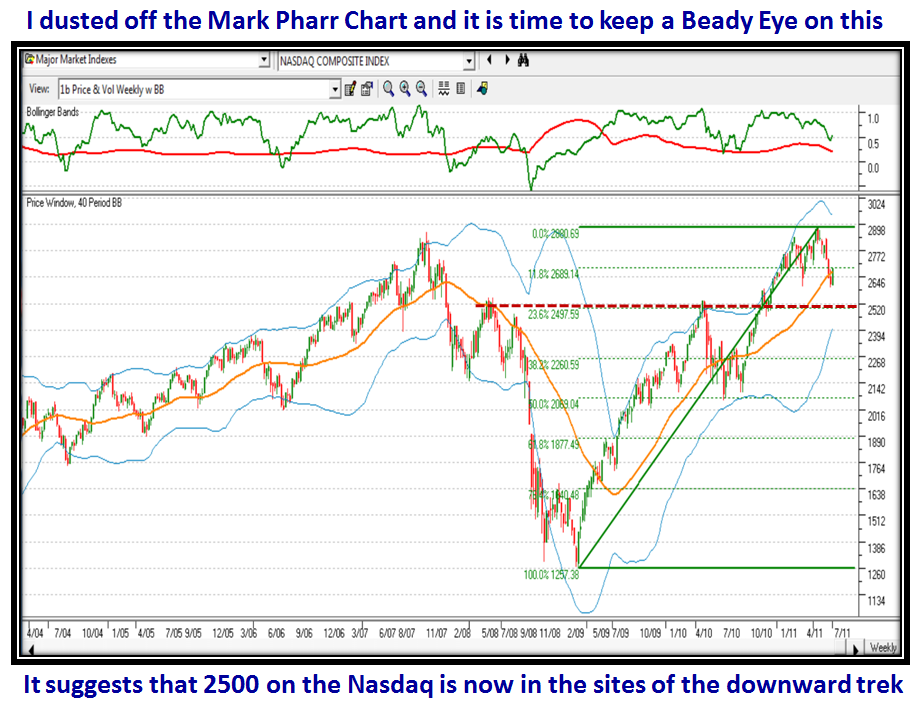
Given where we are at this stage of events, I dusted off what I affectionately call the “Mark Pharr Chart” named after one of our faithful followers who was interested in the long term buy and hold picture, which I conjured up for him several moons ago:
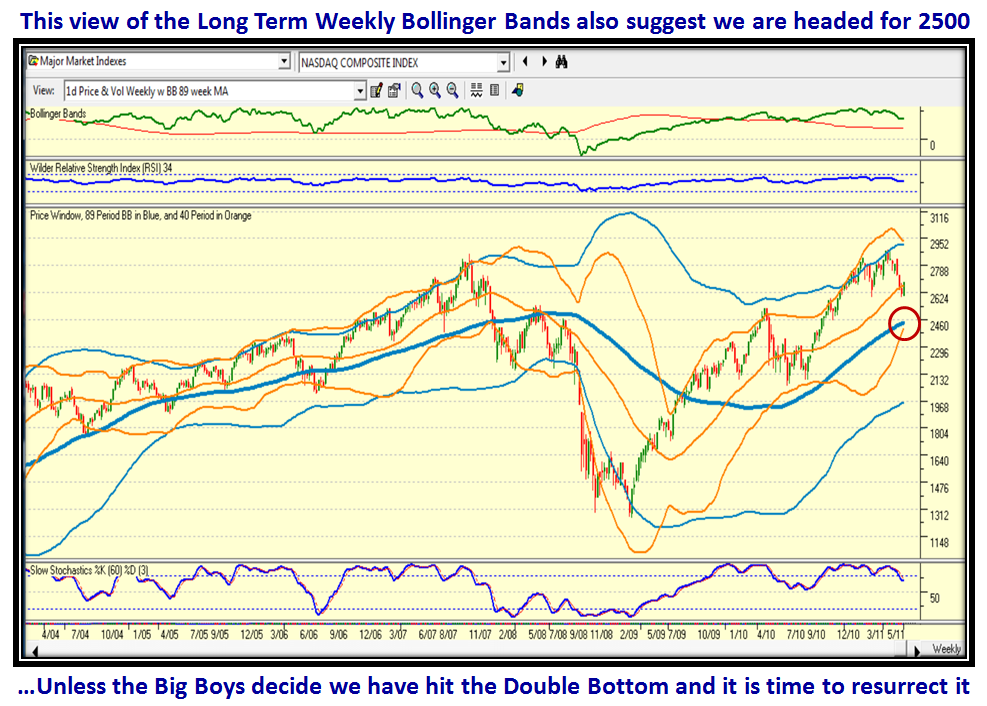
For good measure, here is another one I conjured up a while back on the same theme using Bollinger Bands of 89 and 40 Periods with Weekly Charts:
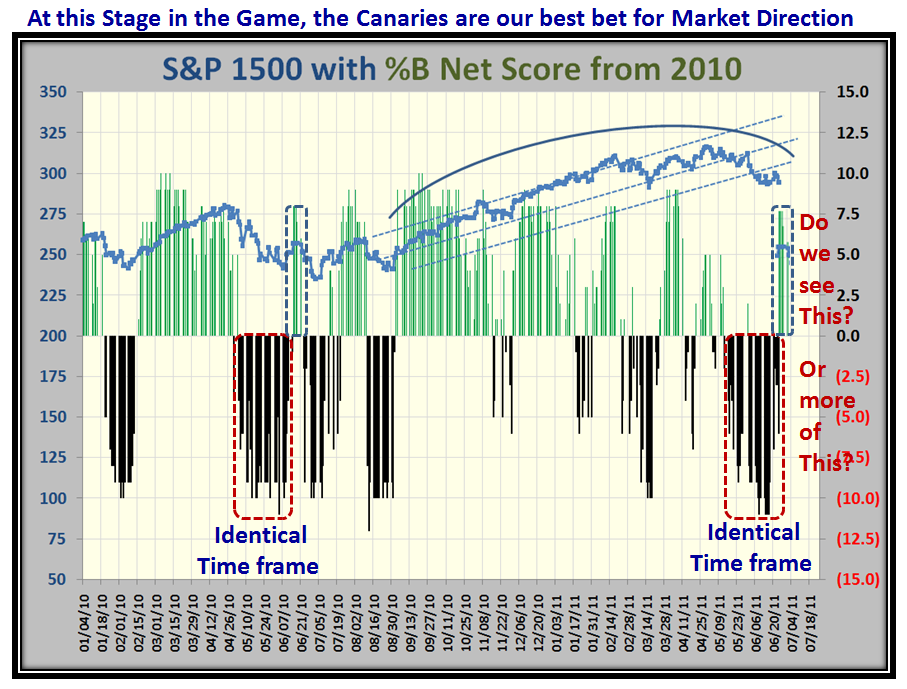
History never repeats itself exactly the same way, but let me compare this year to the Flash Crash of last year, not that I am expecting a Flash Crash, but the similarity was striking and this time last year we had a “Fakey Relief Bounce Play” in the last week of June as shown in the next chart:
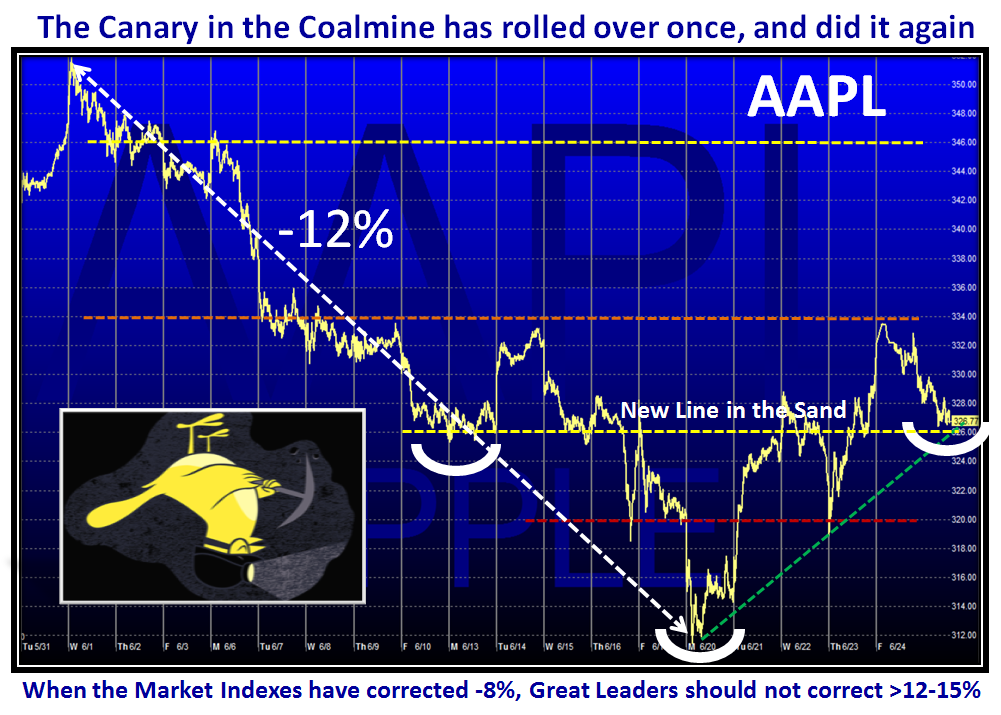
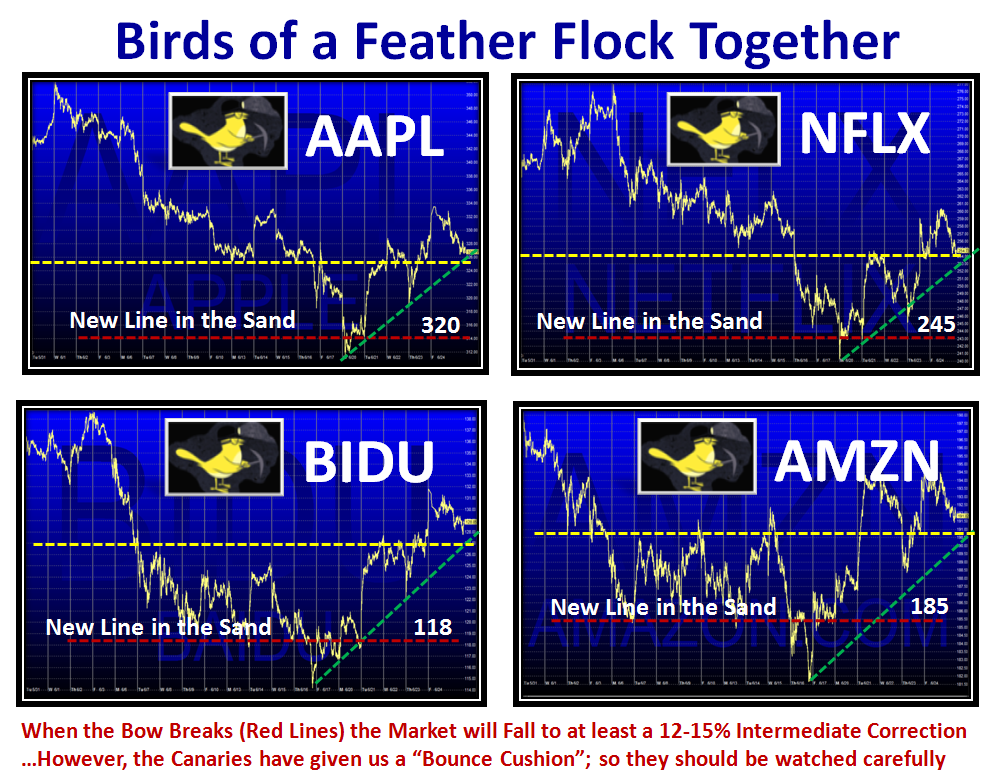
Now let’s turn to where the glimmers of hope may be to give the Bulls some breathing room in the week to come…always keep an eye on the Canaries:
What struck me was the similarity of the Bounce Pattern that each of these four Large Cap leaders produced this past week or so…judge for yourself:
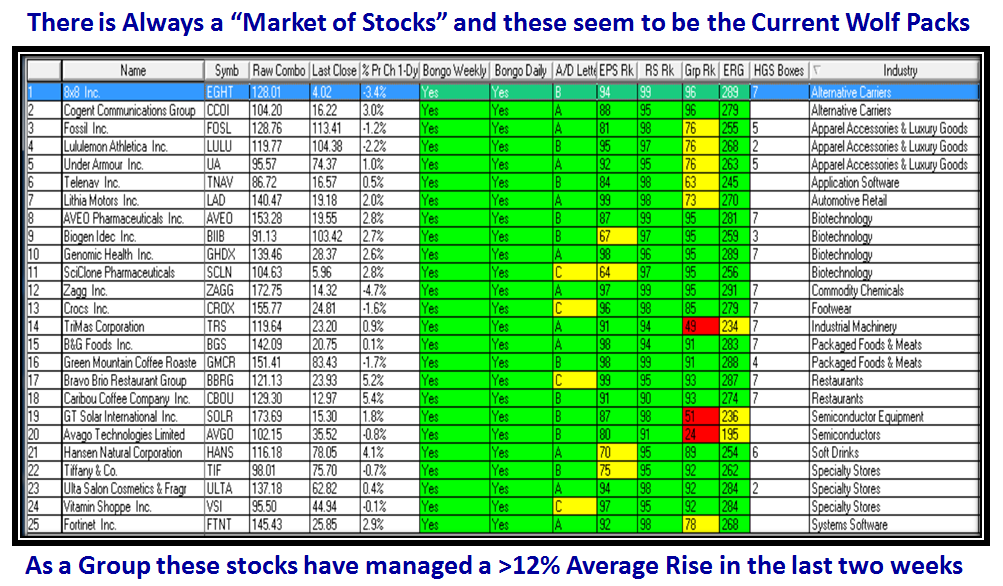
Fast on its heels, my good friend Robert Minkowsky reminded us that there was an unusual bounce in ERG 255 and ERG 270 stocks this week, so I felt it was high time to do my homework and offer you a set of 25 stocks that have shown signs of life this past few weeks that look promising leaders:
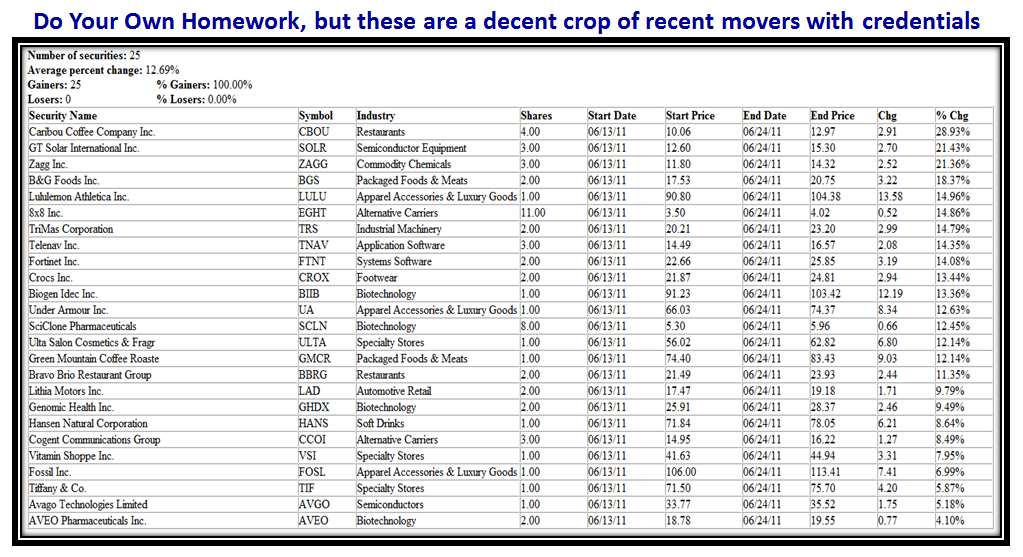
There are a couple of tiddlers in the bunch, but I am not recommending any of these stocks, so you do your own homework. Obviously seasoned HGSI Software users will immediately take note of the sea of green with both Bongo Weekly and Daily Green along with an RS of over 90, strong ERG and plenty of Box stocks to boot. Also some wolf packs emerge as seen on the right hand side of the chart. Here are the results for each stock for the past three weeks:
Now you have a Game Plan to go either way depending on what the MARKET Indexes, the Canaries and the Leading stocks tell you next week. If the market continues down then watch to see if the “Bow Breaks” and the Canaries fall, but if it revives itself going into the July 4th Weekend don’t be surprised if it is just a short term Bounce Play for another Fakey the way it happened this time last year as I showed you above.
Best Regards. Ian.
 Ian Woodward's Investing Blog