Ian Woodward's Investing Blog

Archive for July, 2011

Stock Market: Uncertainity Weighed Heavily on the Market

Monday, July 11th, 2011

With all the recent writing I have done getting the Newsletter out, Carpel Tunnel is back in my right hand so I will keep the typing to a minimum:

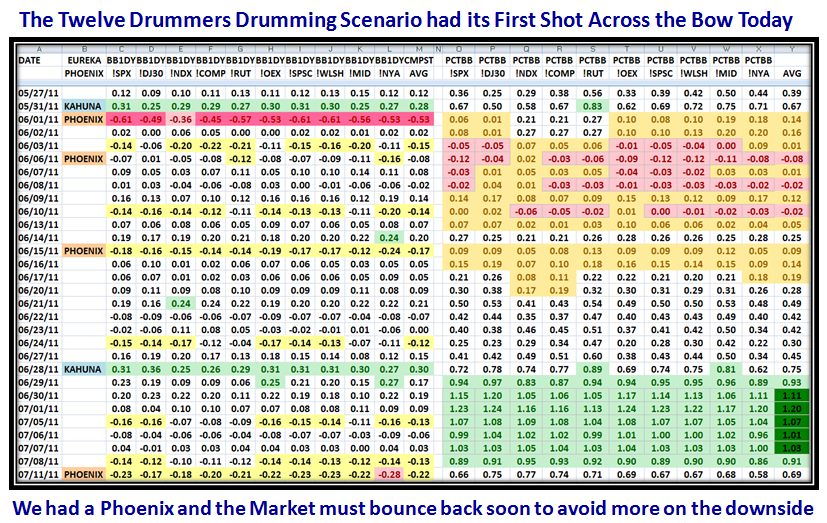
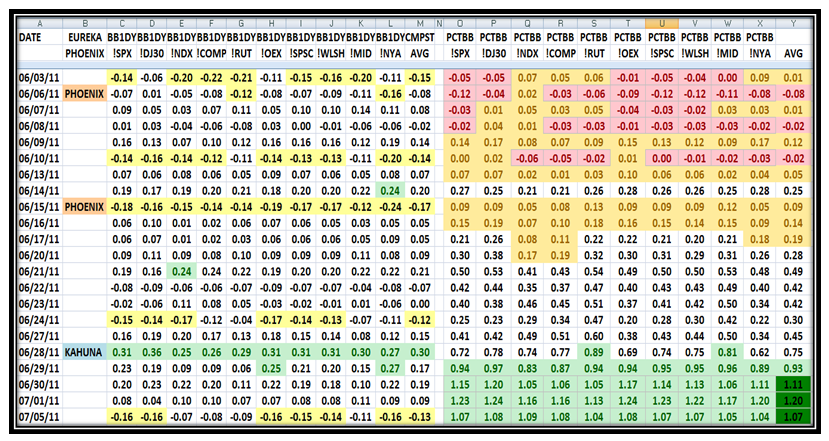
You know the symptoms…once we hit a peak WITHIN twelve days one should see a correction.  How big nobody knows:

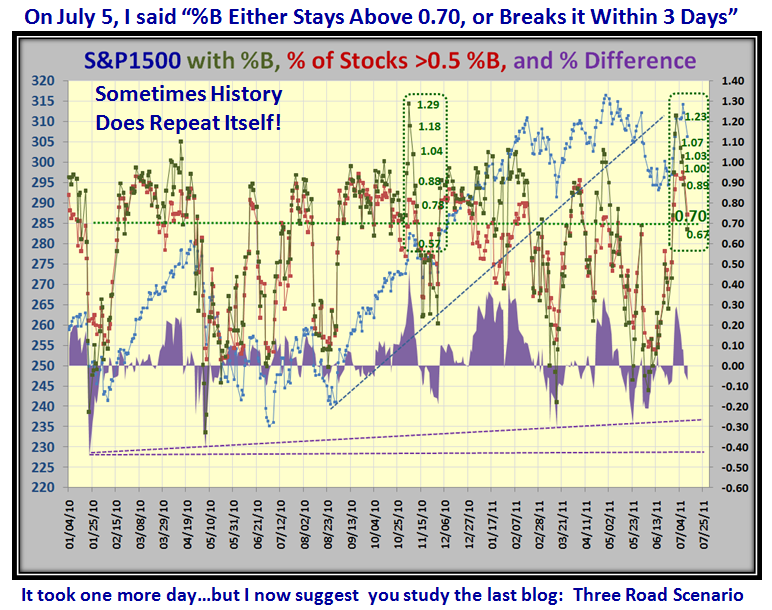
Who says “History Doesn’t Repeat itself?”  Well close enough for Gov’t work:

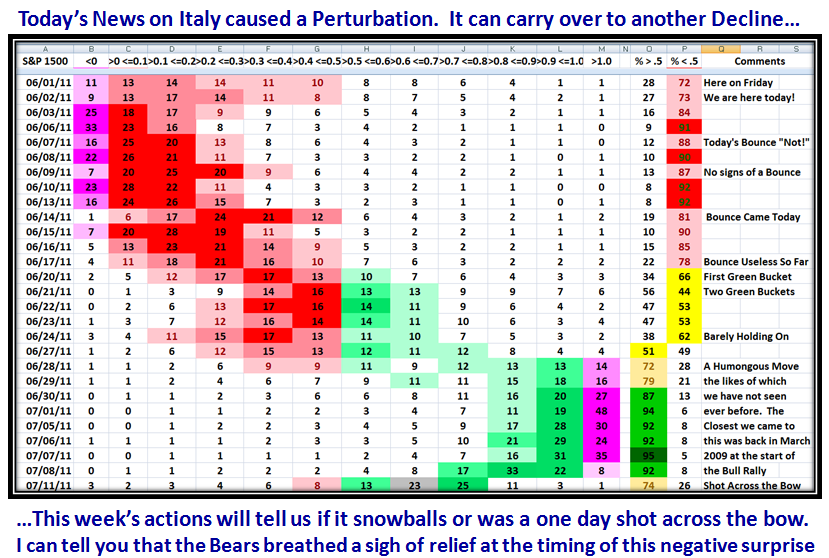
A shot across the bow, but we still have a decent cushion…a bit of luck for the Bears for such a turn of events, who were biting their finger nails:

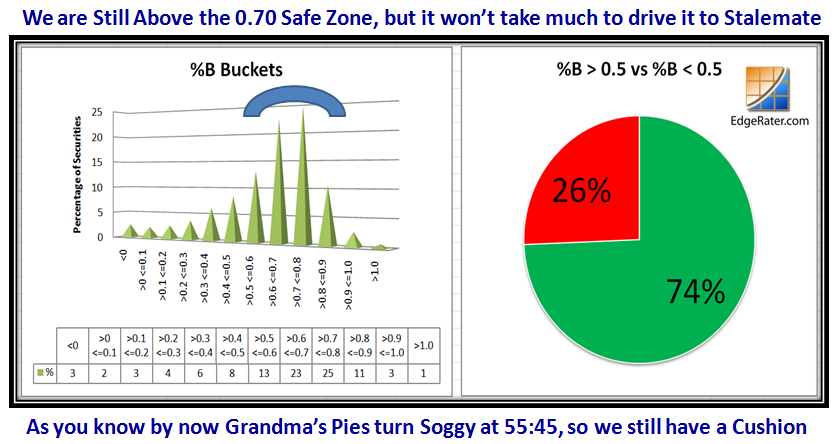
Grandma’s Pies are still in the Safe Zone, but one more day like today can turn them pretty soggy:

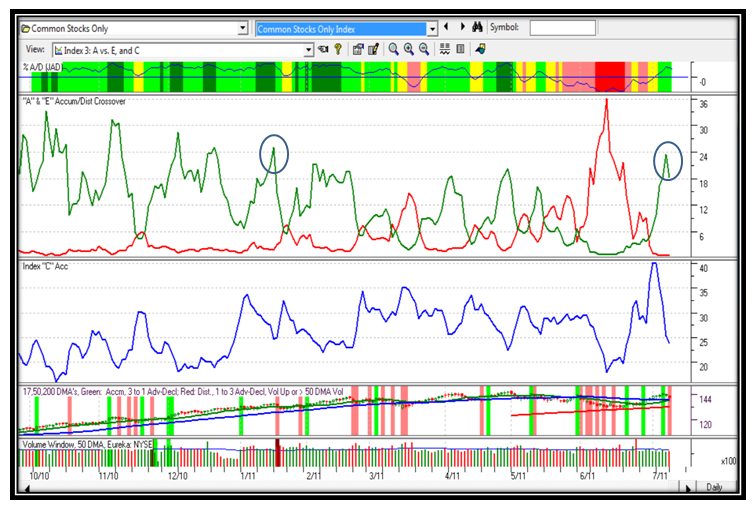
“A” Accumulation has turned back as expected, but not enough to be alarming at this stage:

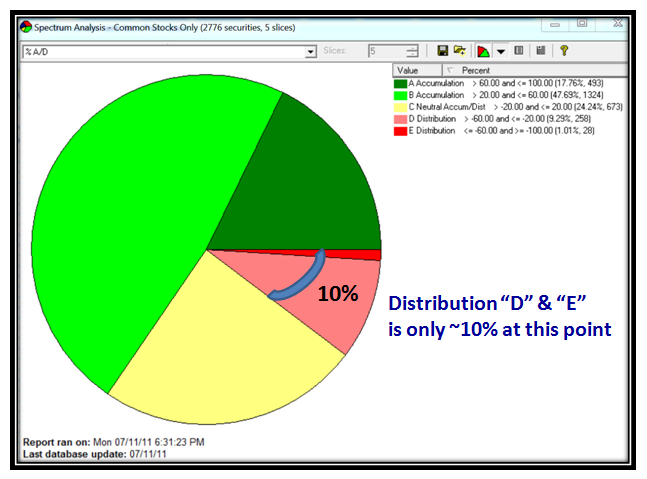
This Pie Chart shows more clearly that Accumulation is still strong with only 10% in “D” and “E”:

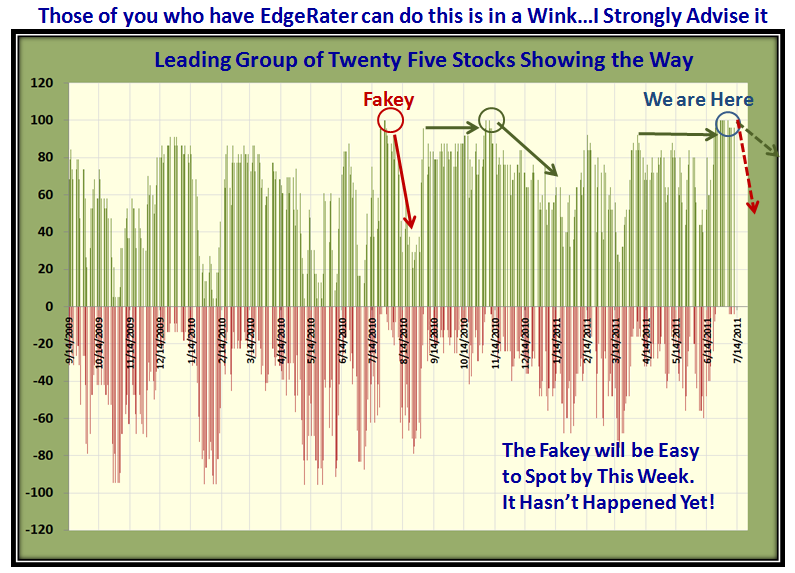
The strong group of 25 stocks I featured a couple of blog notes ago are still holding up, but has slid down a bucket or two though still above 0.5:

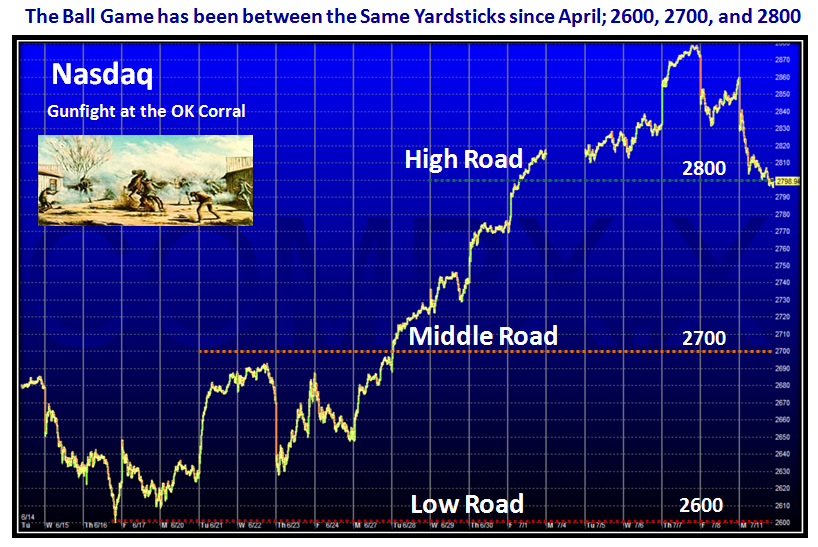
The Ball Game for the overall market hasn’t changed in several months and stays between 2600 and 2900 as I have shown before:

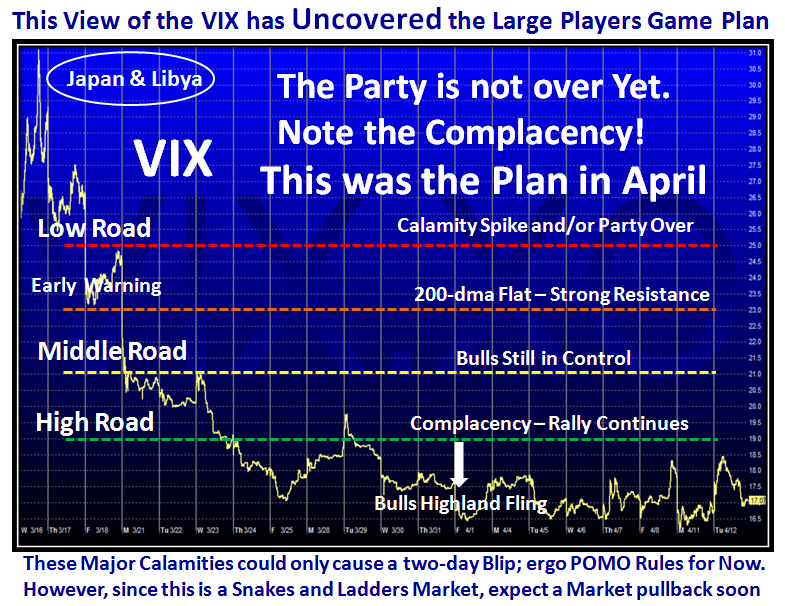
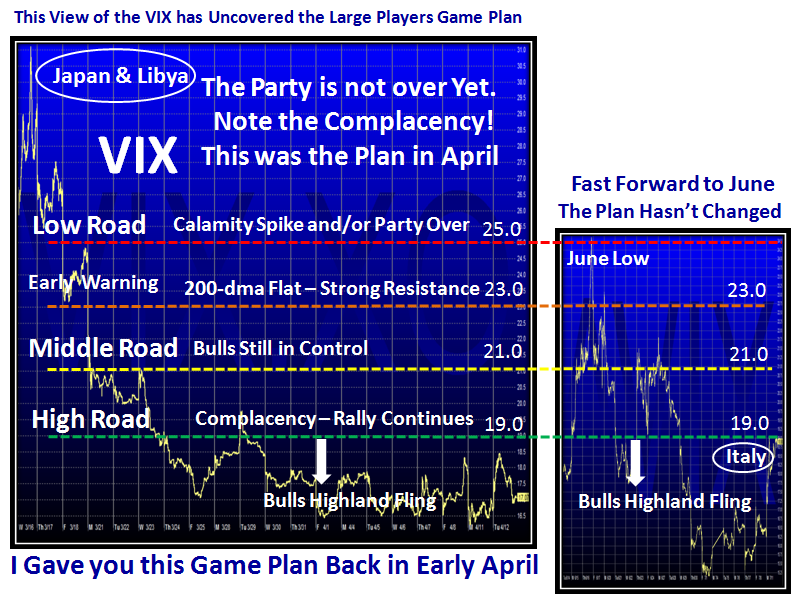
The Bears are now focusing on the VIX and similar instruments…this is good for Type 1 and 2 traders.  I gave you the Game Plan Moons ago:

…And here is where we sit today with a fast forward to June:

…And there you have the picture to help you plan for the week ahead.

Best Regards, Ian


Stock market: Three Road Scenarios

Tuesday, July 5th, 2011

At this stage of events, it seems easier to hypothesize the three Main Road Scenarios.  The Stock Market has played into our hands and here is what may unfold in the next week or so.

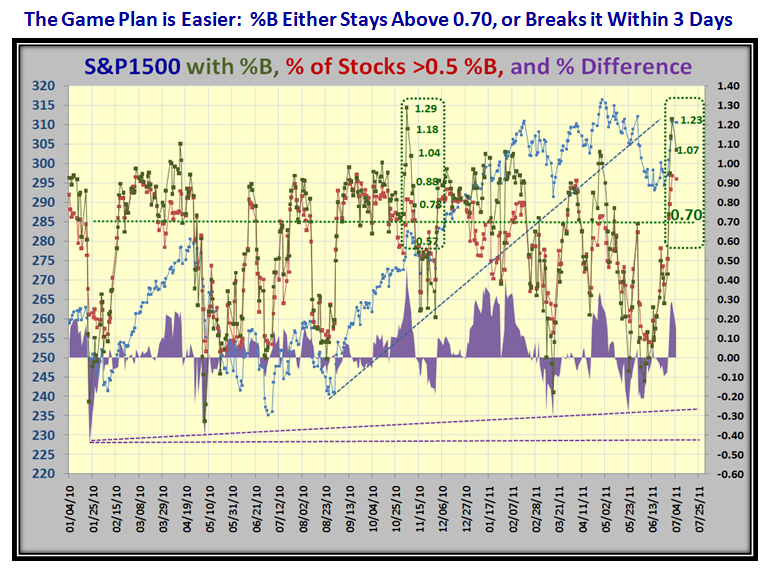
You have seen the chart below when I coined it as the Purple Chart, which helps when a Market is either Overbought or Oversold:

Please compare the current stage with that around mid November last year to identify what “MIGHT HAPPEN”:

1.  The Middle Road Scenario: The S&P 1500 will fall to below 0.70 for %B within the next week
a.  We should expect at least a Kahuna to the downside…that implies a one-day skip of two buckets down
b.  It also suggests a Price drop of >1.5% in the S&P 1500 or about $4 in one day
c.  %B for the S&P 1500 will drop BELOW the reading of the % of stocks in the S&P 1500 >0.5 %B
d.  Subsequently in the ensuing week %B MUST not fall below 0.25, and then must rebound
e.  The Price of the S&P 1500 will HOLD above its current low of ~ 294 at or near a triple bottom
f.  The Canaries give up their significant recent gains and again will be testing their lows

2.  The Low Road Scenario: Given the Middle Road Scenario to 0.2, %B falls further below the Bandwidth
a.  Invariably this requires at least a 2% Price Drop and one can expect repeated one day Bucket Skips
b.  At this stage, the Bears will have control and the Floodgates can open on full throttle
c.  The S&P 1500 can suffer several 1-Day Price drops of 2% or more
d.  %B (green line) will drop faster than the % of Stocks above 0.5% (red line)
e.  The Purple Area Chart will once again go negative to around -0.2 or lower

3.  The High Road Scenario: Given the Middle Road Scenario to 0.2
a.  %B RISES and recoups to 0.9 or higher
b.  The S&P 1500 quickly rebounds and attempts a double top, either blowing through or being rebuffed
c.   We review the bidding at that stage, but it will certainly require good news on the Debt Ceiling Fru-frau
d.  There is no further unrest or negative surprises on the PIIGS front
e.  Volume picks up to give conviction that the Bulls are ready to flex their muscles

Always let the Market tell you which Scenario it is on.  At least we now have a cushion from the Strong Bounce Play of last week to give breathing room to the downside.

Best Regards, Ian.


Stock Market: A Fork in the Road at the Crossroads

Sunday, July 3rd, 2011

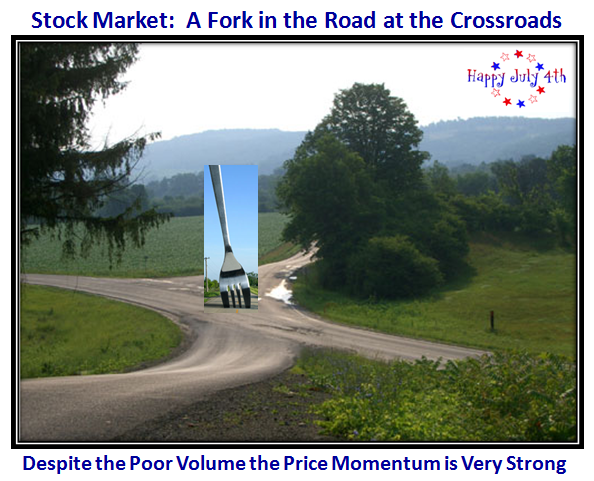
A Happy 4th of July to you all as we ponder where this market goes next week.  Those who have followed my blog these last few weeks got the Game Plan alternatives over a week ago with the last two blog notes.  So now we come to the Fork in the Road at the Crossroads:

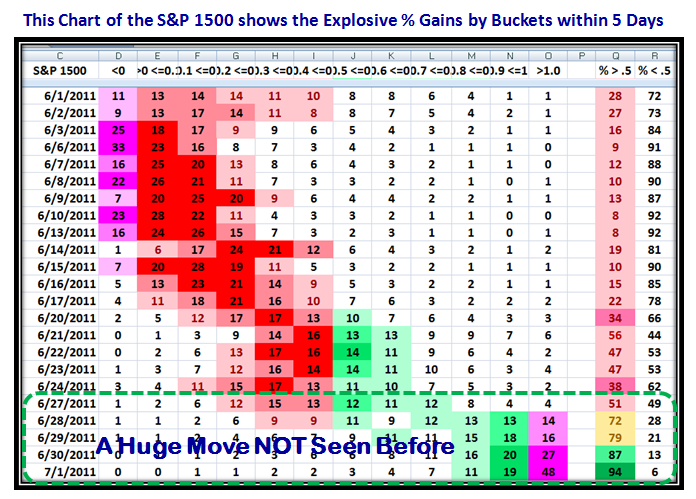
This past week was a Blockbuster in terms of Price Gain from an Oversold situation, the likes of which broke all records in its momentum.

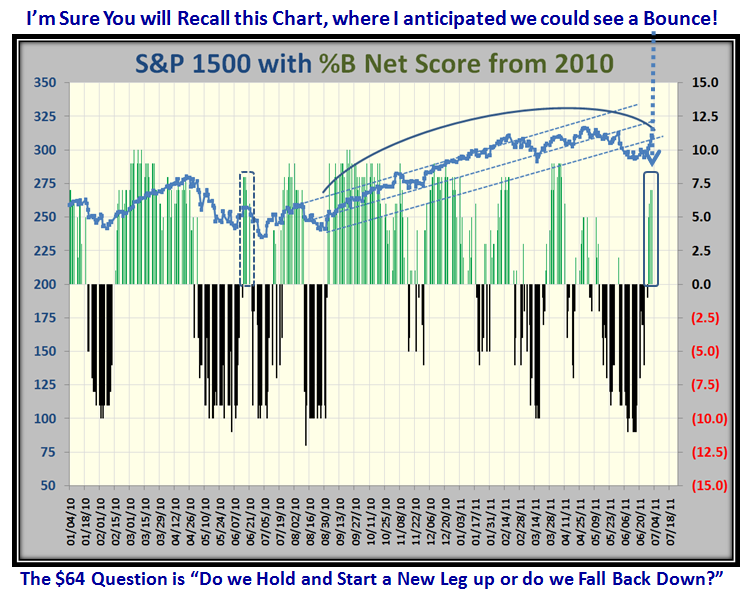
The $64 Question is whether this is the start of a decent Summer Rally or just a Flash in the Pan due to a confluence of three forces that came together  simultaneously to cause the explosive move this past week: Window Dressing, the End of the Quarter and Half Year, and a Market that was so Oversold that at least a Bounce Play seemed certain to be on the cards, especially as two previous attempts fizzled before they hardly started.

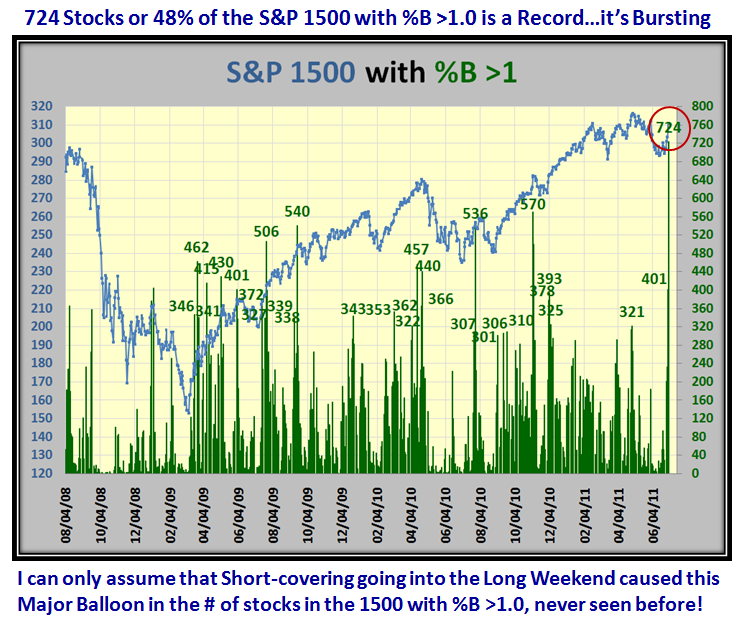
Just look at the results of the Buckets and especially the 48% of S&P 1500 stocks sitting above the Upper Bollinger Band in Bucket >1.0

That 48% or 724 stocks is the highest on record, so this again was no ordinary move:

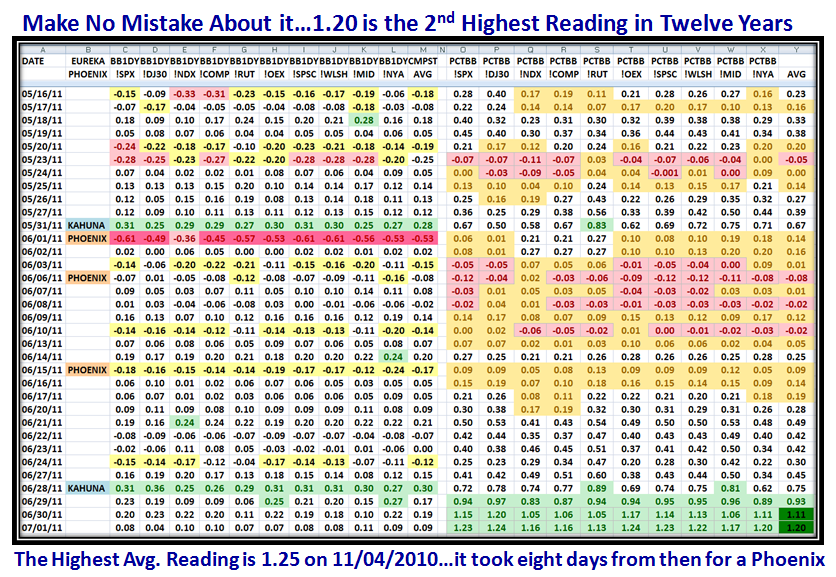
…And if that is not enough, here is the result of that Bounce Play which has materialized as I hypothesized last week:

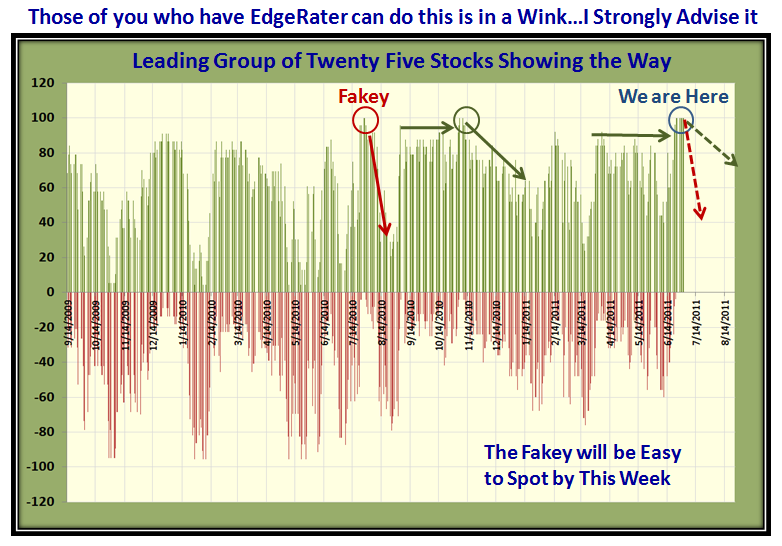
Here is an update to the picture I gave you last week showing two alternative Scenarios for this coming week…The Fakey will be easy to spot:

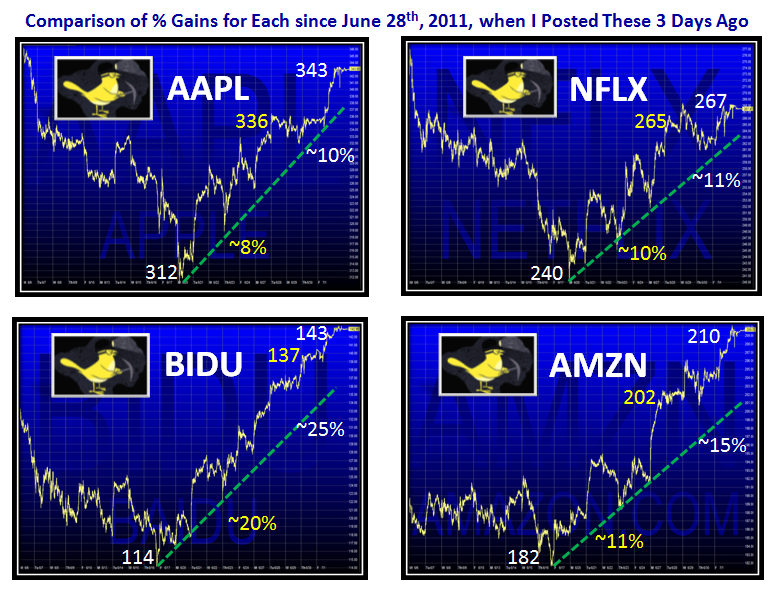
…And here is how the Canaries performed this past three days since the previous one with the improvements in % Price Gain (shown in white):

So there you have it, and again a Happy July 4th to you and yours.

Best Regards, Ian.


Copyright © 2007-2010 Ian Woodward
Disclaimer: Commentaries on this Blog are not to be construed as recommendations to buy or sell the market and/or specific securites. The consumer of the information is responsible for their own investment decisions.