Sttock Market: More Champagne while Watching the Super Committee
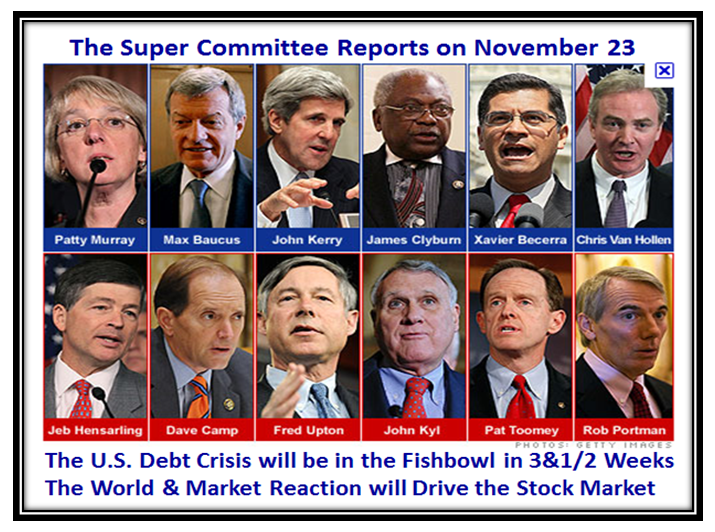
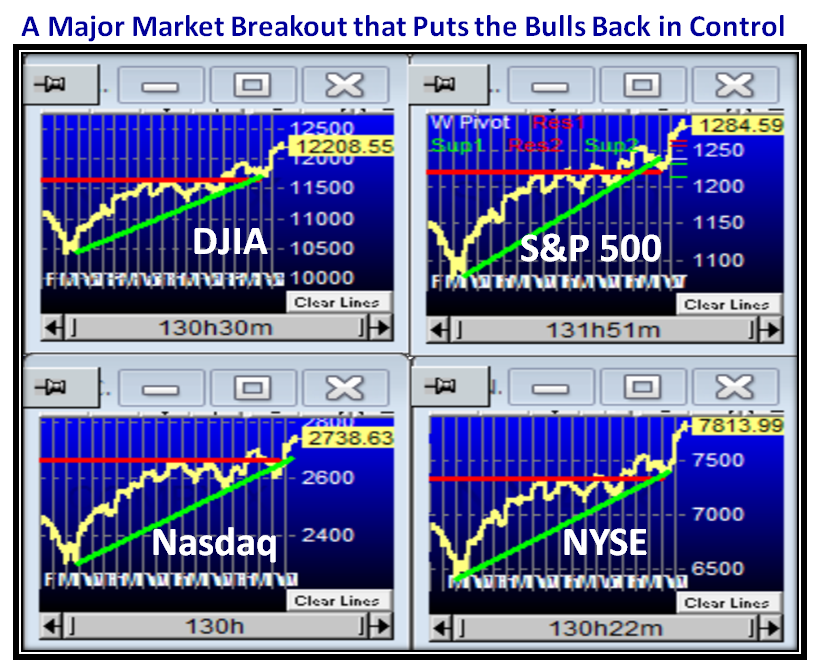
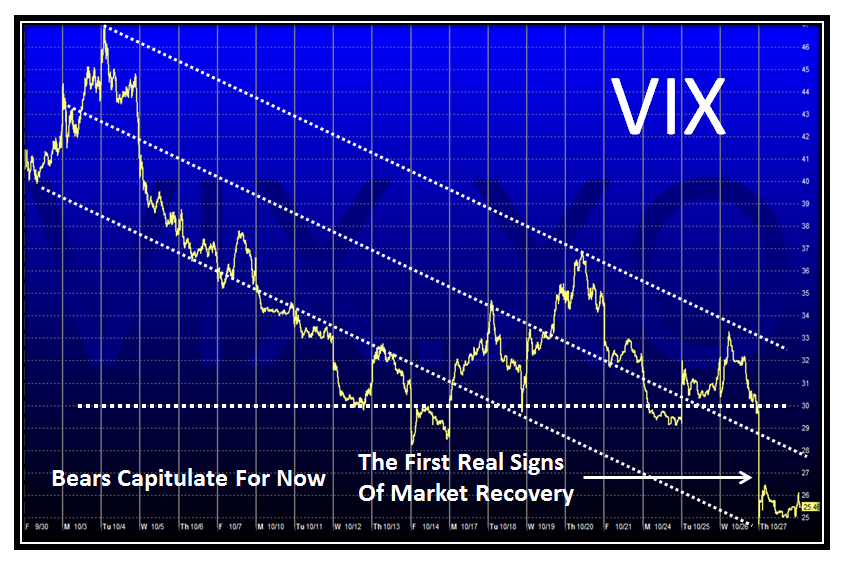
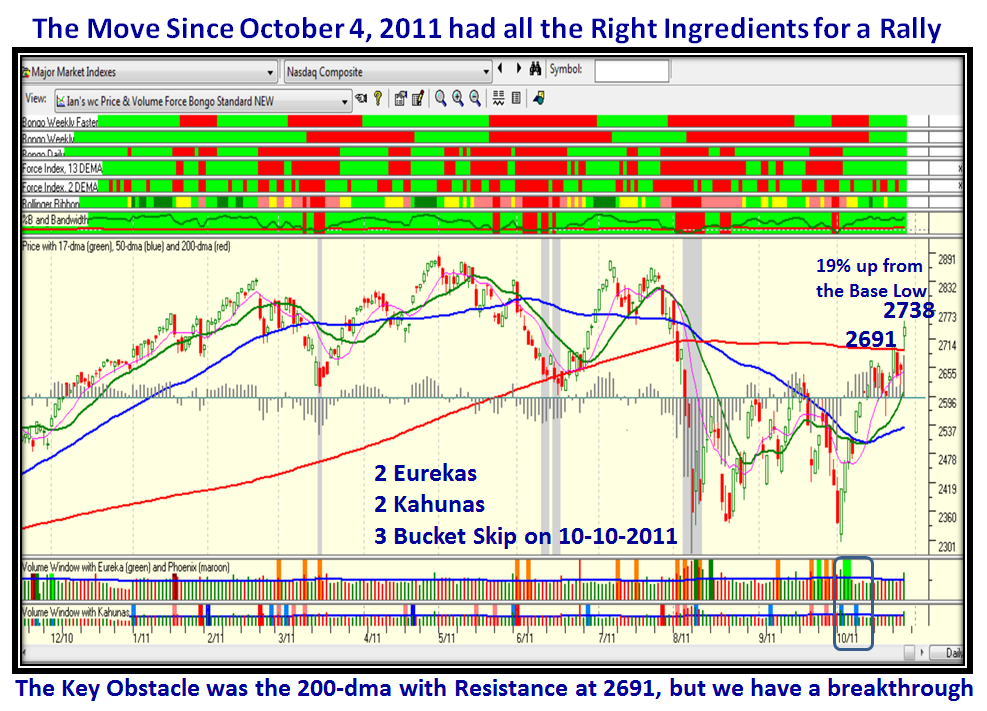
Sunday, October 30th, 2011Since we have learned in this last year that the Stock Market is mainly News Driven more so than in previous years, any sustained Rally coming out of an explosive move we have experienced these past 3&1/2 weeks is highly unlikely to last as long as the Days of Wine and Roses ala March 2009. If you do not pay attention to what is due up by way of news to say nothing of the surprises we get every other day, then most Type 3 & 4 Intermediate and Long Term Investors will get killed. The next big day to mark on your Calendar is November 23rd., the day before Thanksgiving, when the Super Committee MUST deliver the goods on the Debt Crisis Issue.
With that as an introduction, Paul has a follow up question to my note of yesterday:
Paul R Says:
October 29th, 2011 at 7:10 pm
Wow Ian great blog and answer to my question.
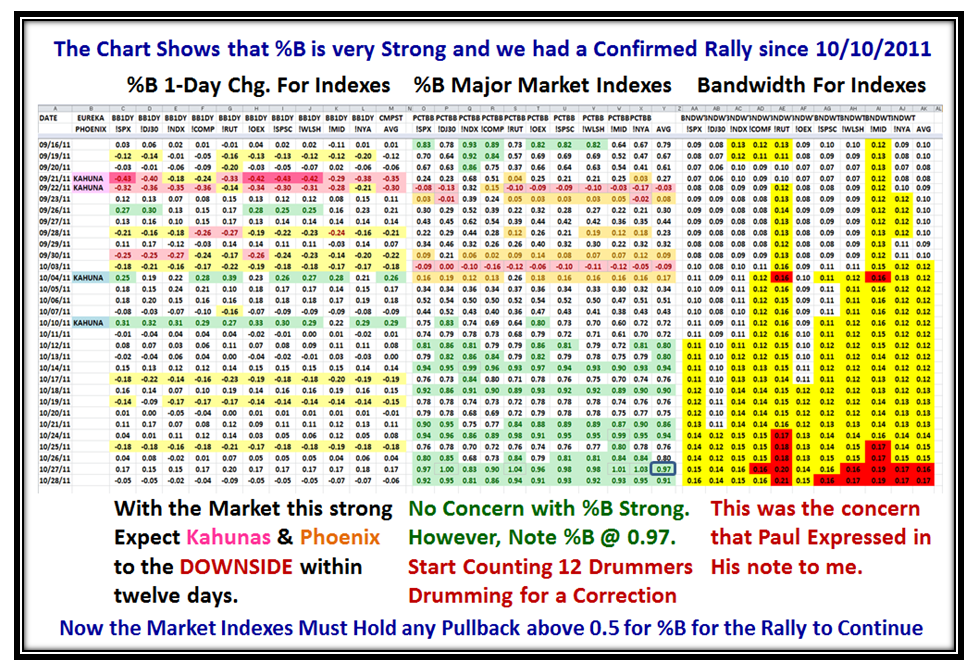
Here is another question for you, looking at the .97 %B average and the band of drummers warming up, for a decent sustained rally what %b range would you like to see each evening?
Paul R
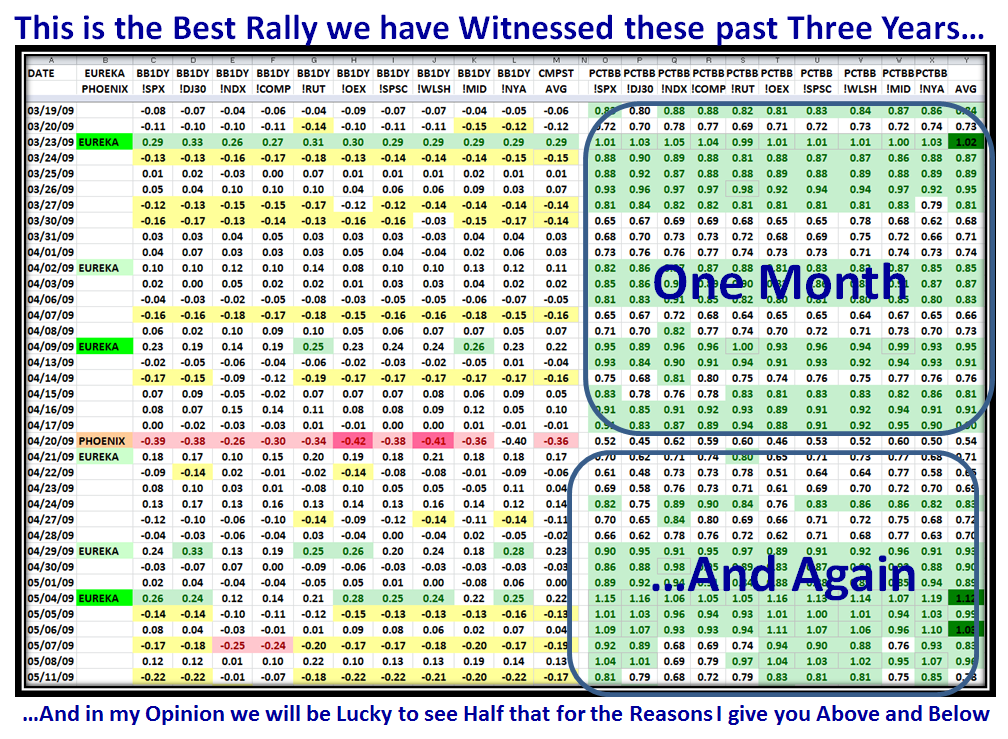
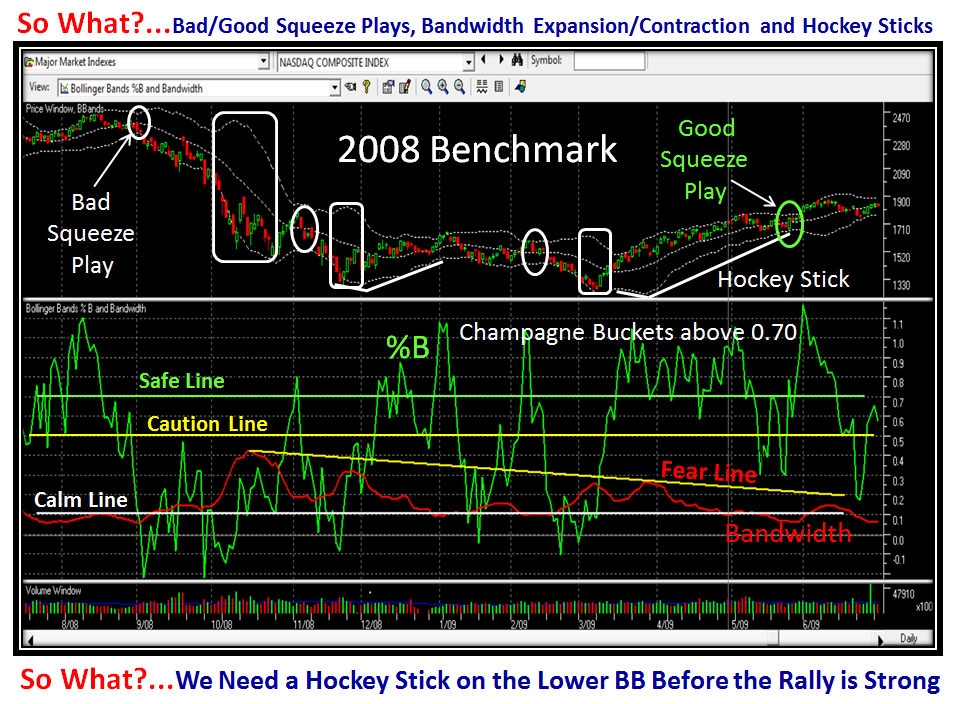
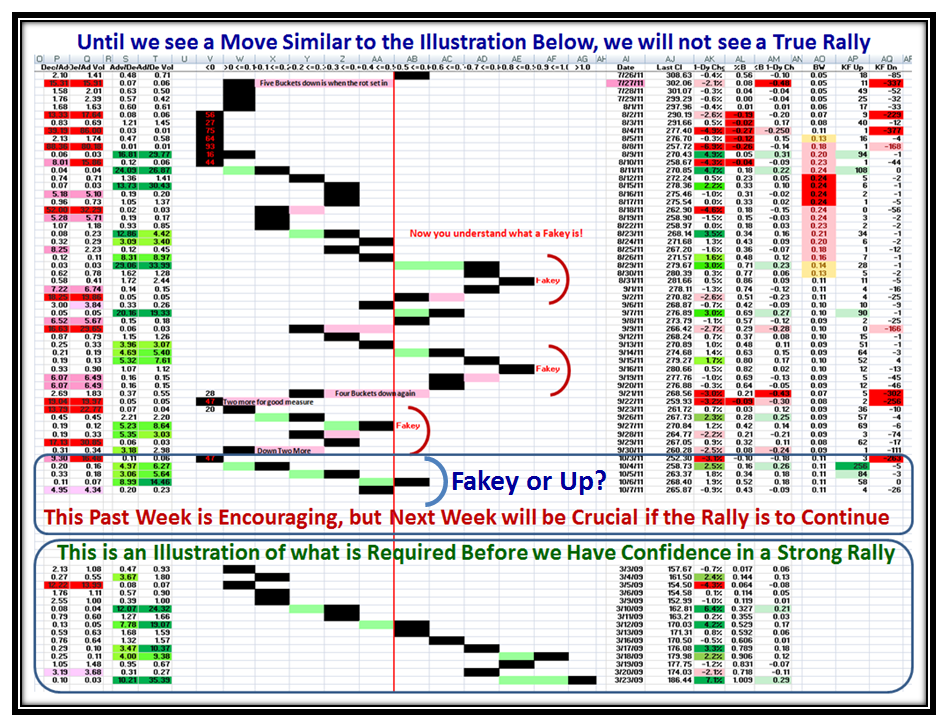
Hi Paul: Now you want “Jam on it?”, as my Mother used to say when I was a little boy as she gave me Tea and Crumpets. I’m no Soothsayer, but I can give you a feel for what to look for. Using the Benchmark of the Strongest Rally in the last three years when the Market exploded upwards on March 10, 2009, we see:
1. Once the Composite Average for ten Market Indexes reaches a peak, it stays above 0.80 for four days before it descends to 0.60 to 0.80
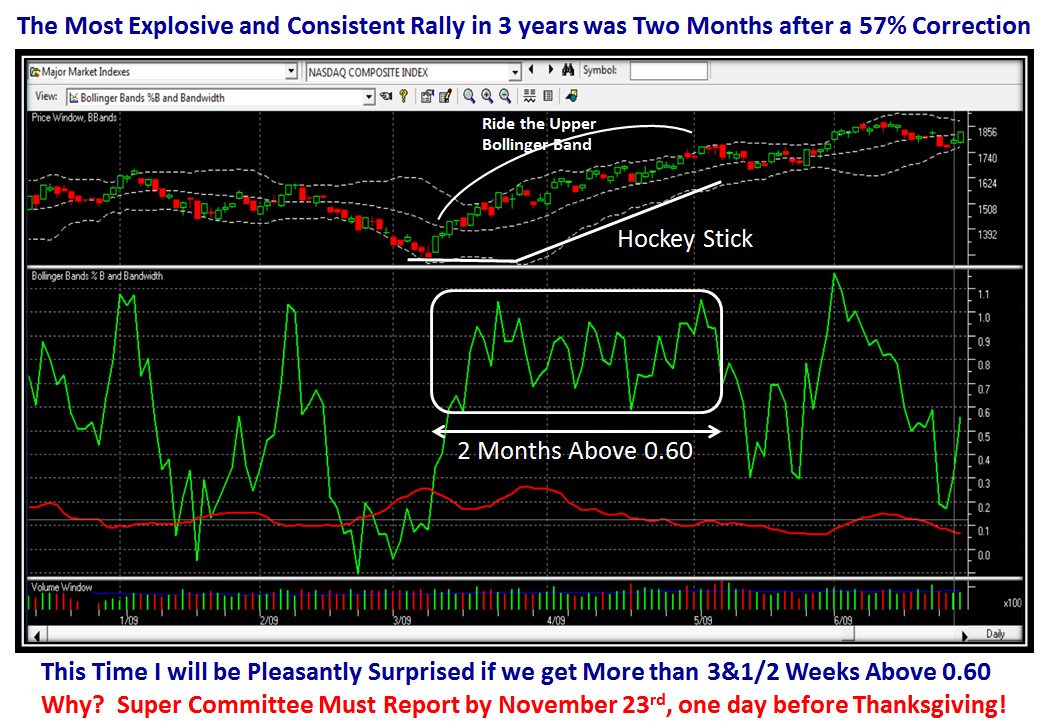
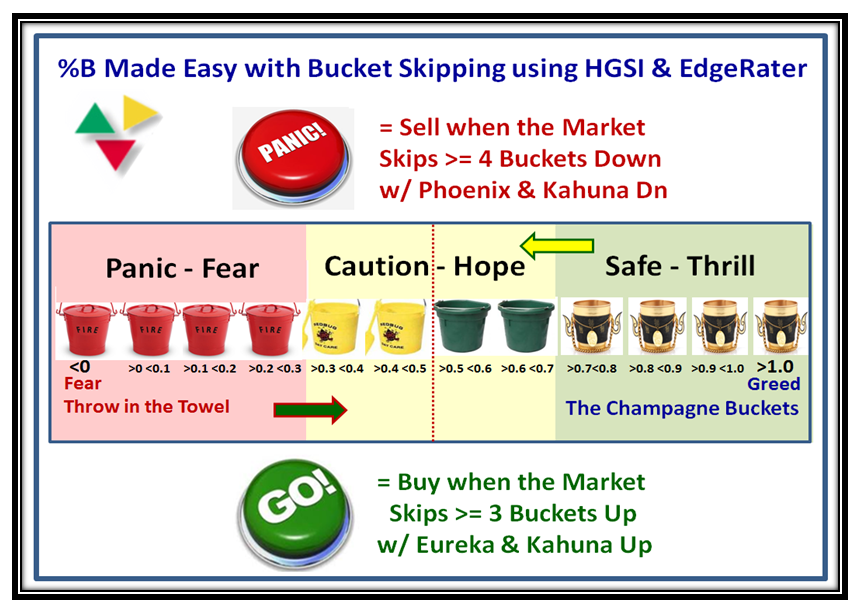
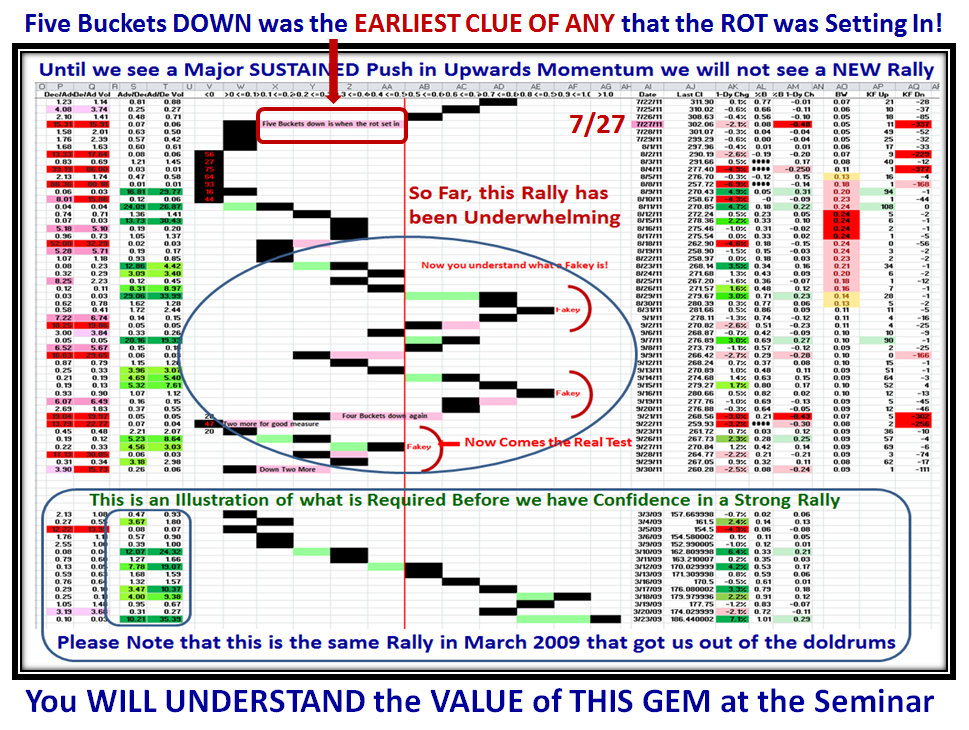
2. If the Rally is very strong, Composite %B can stay above 0.60 for a Month, dip briefly with a Phoenix and three to four buckets down in one day (Major Down Kahuna), and then survive for another month, as shown below:
Likewise, all of this can be followed by all Users of the HGSI software as shown in the chart below:
3. The more normal rise and fall is that a Rally will stay up above 0.80 for four days and then gradually fade to BELOW 0.50 within 12 Days from the peak…hence Twelve Drummers Drumming.
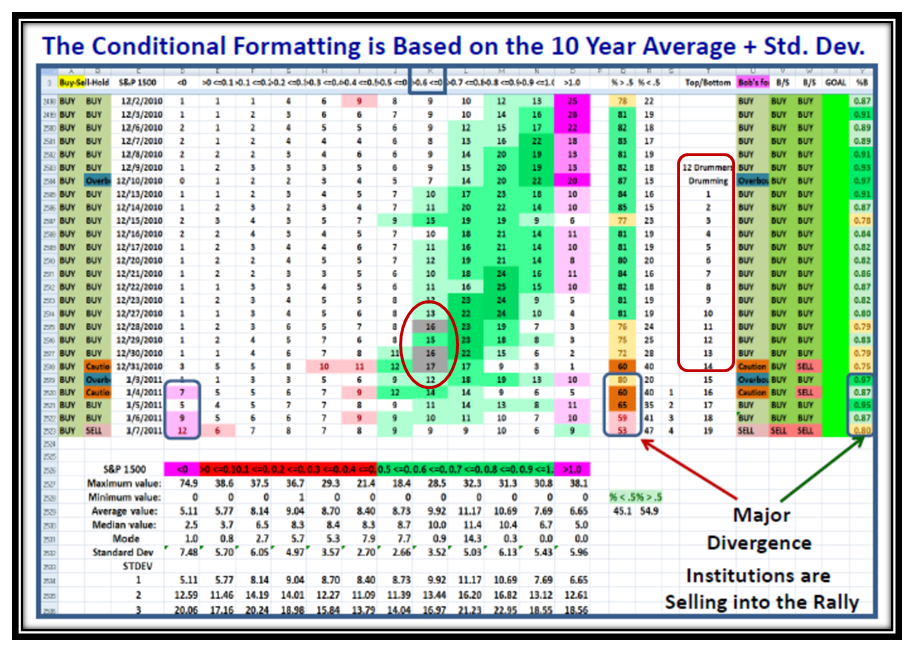
4. The earliest clue that the Market is Correcting again is when %B for the S&P 1500 registers >16% in Bucket 0.6 to 0.7, hence my statement of 12 Drummers Drumming and Sweet Sixteen! (Seminar Attendees need to review the omnibus set of slides for March 2011, where you will find chapter and verse on this towards the end on Pages 369 to 388. The Section is called “Defining Market Tops with %B and Bucketology using the S&P 1500”). For those who read this blog, you can find references to this concept in Blog Notes dated November 5th. and 6th, 2010.
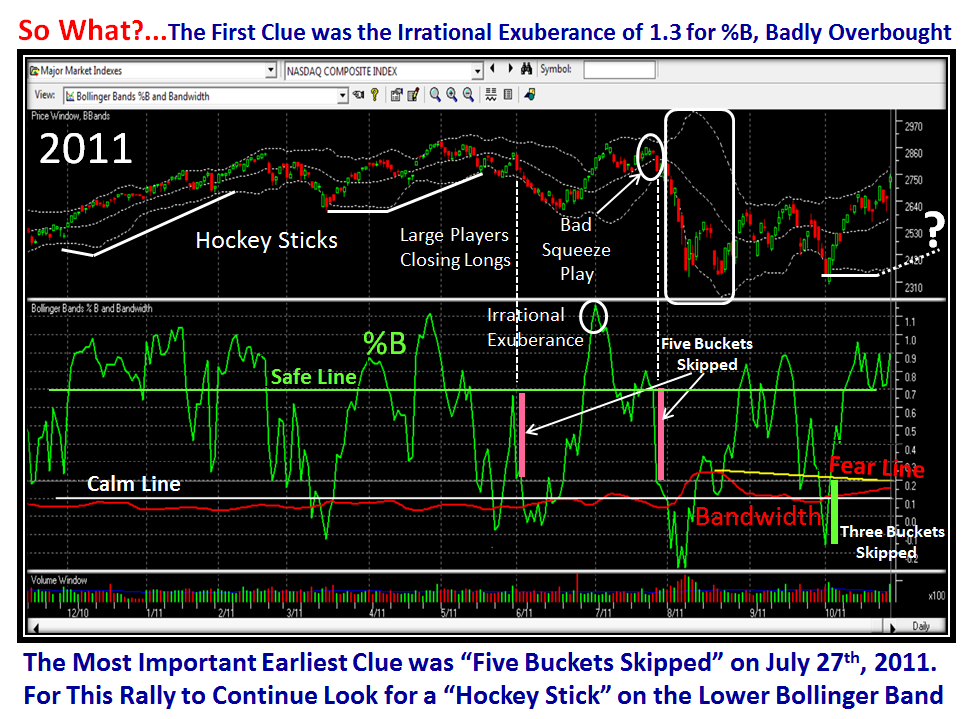
…And here is a sample of what to look for, and please note the red circle in the middle of the chart around Bucket 0.6 to 0.7 for the “sweet sixteen” which is the earliest clue that the Market may start to deteriorate:
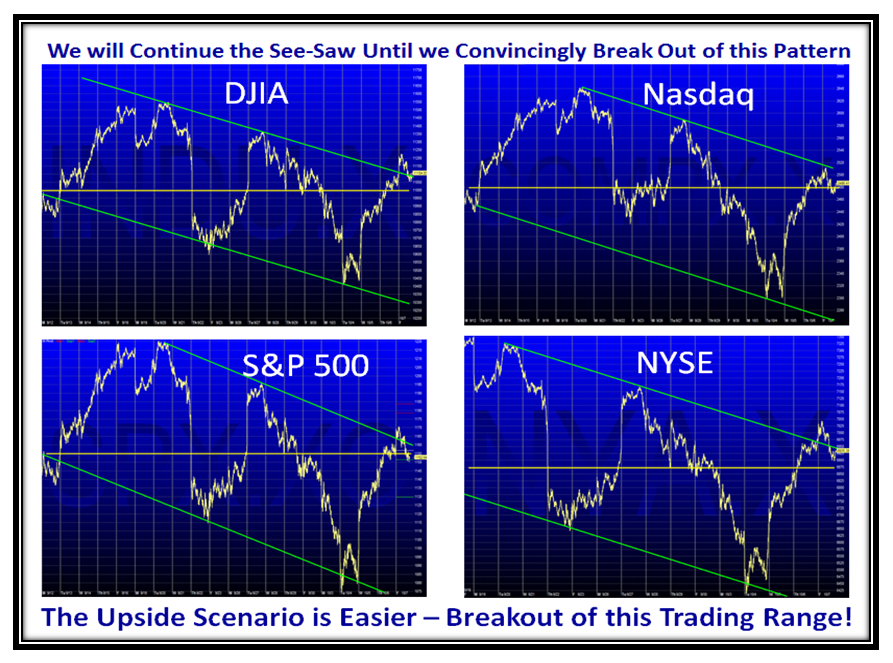
No one can predict what the Market will do, and I can only give you clues of what to look for as the Market tells you which path it is on, day by day, week by week until we get to Thanksgiving Turkey. Then comes the Santa Claus Rally to look forward to, so there is hope if the Super Committee can come up with good news.
Let me turn the tables on you and anyone else who cares to chirp up…please give me the heads up of what you see as things unfold in the next three weeks as to which way the Wind is blowing ahead of a Catastrophic Failure or a Pleasant Surprise and you will be a better man than I Gunga Din!
Best Regards, Ian.
 Ian Woodward's Investing Blog