Ian Woodward's Investing Blog

Archive for November, 2011

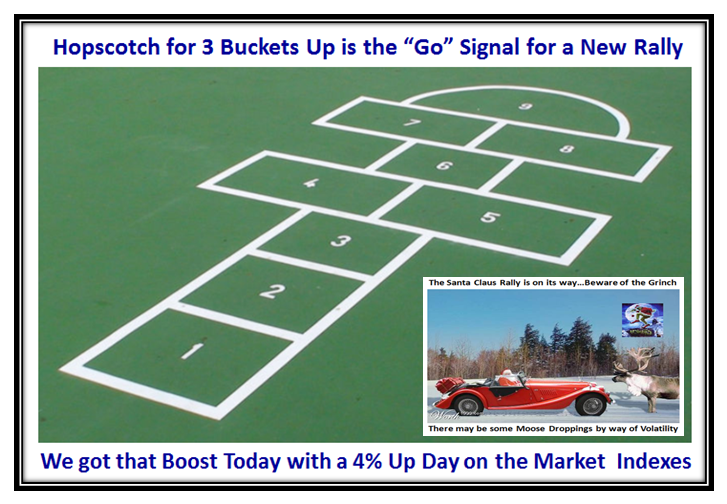
Hopscotching to a Santa Claus Rally?

Wednesday, November 30th, 2011

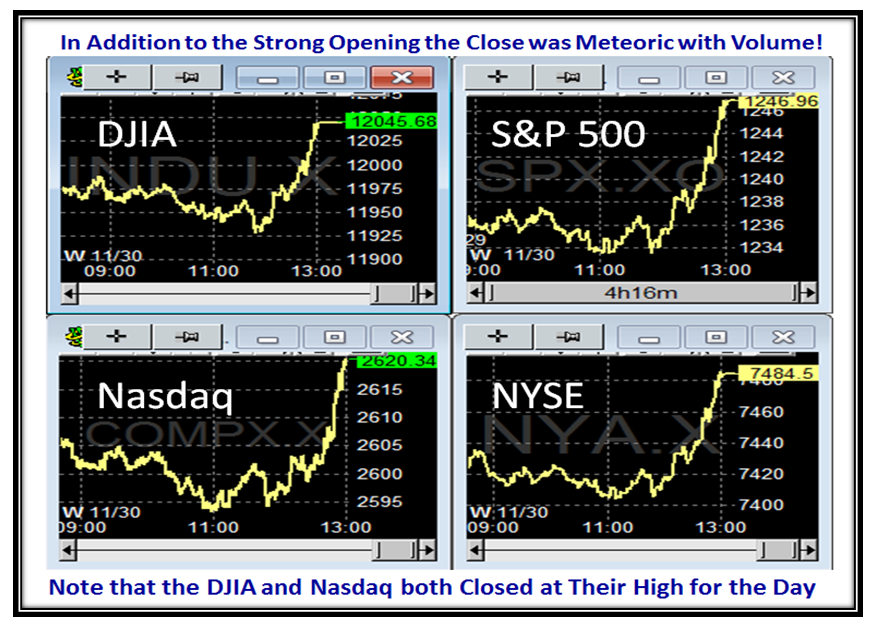
The Dow Jones Industrial Average had the best day since March of 2009, up 490 points or 4.2% to close above 12,000.  Actions by central banks worldwide to combat debt crises spurred the broad rally.  The Federal Reserve said Wednesday that it joined some of the world’s major central banks in a coordinated action to inject liquidity into the global financial system.

I can tell from your favorite hits on this blog that you are all itching for a Santa Claus Rally and for sure this has all the makings of a fresh run.  Three Buckets Up together with two Eurekas and two Kahunas within three days is just what the doctor ordered to spark this tricky market into a fresh move to the upside.

The charts below show the strength of the move at the close of the Day when all Indexes rose rapidly as the Shorts threw in the towel and volume surged for the first time in ages.  This explosive move is matched only by the likes of the sudden burst back in March 2009, so we can hope that this will follow suit and not fizzle out in a few days.

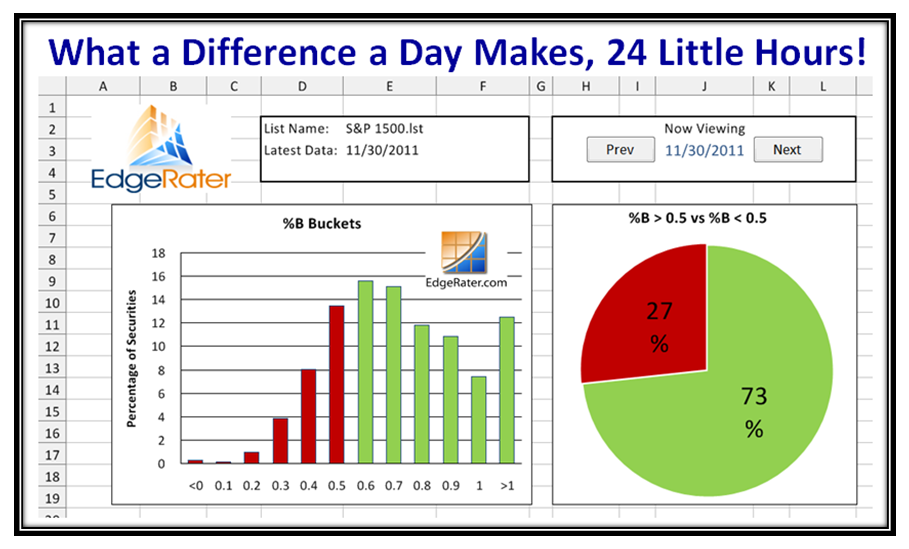
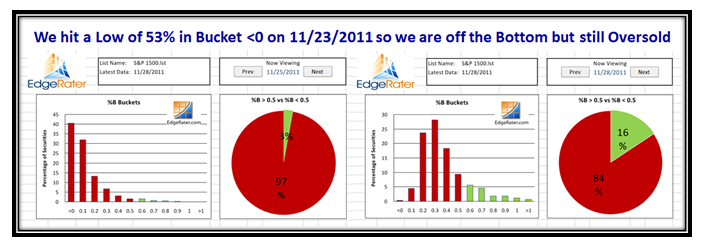
It goes without saying that all boats are now out of the mud and we have a healthy picture for stocks above and below 0.5 on the %B for Bollinger Bands.

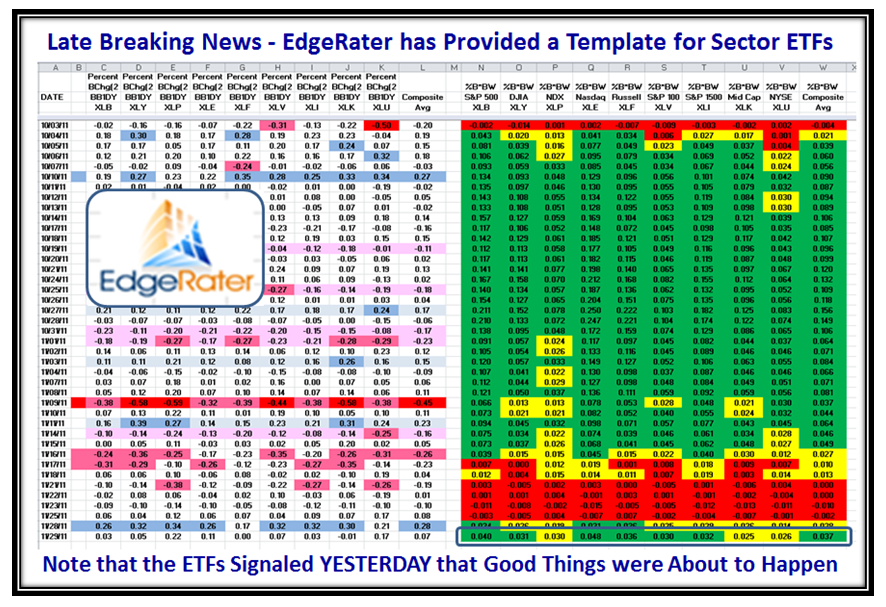
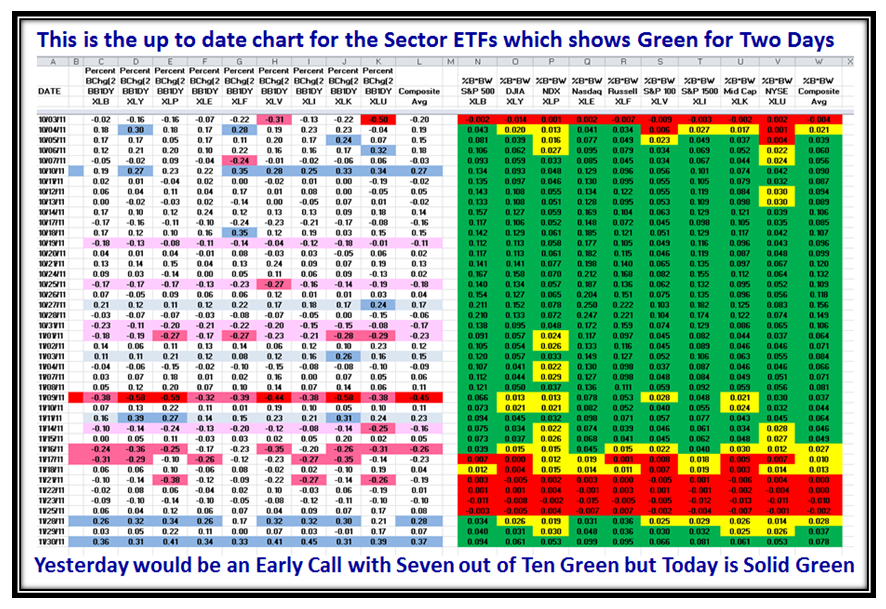
Now for some exciting Late Breaking News!  My good friend Chris White has turned up trumps by adding a Template in his EdgeRater Version 5.0 Product which provides insight into the Sector ETFs for the XL_ Series.  You will note at the bottom of the following chart that these ETFs were already signaling that good things would happen today based on their movement yesterday with six ETFs and the Composite Average all showing “Green” signals just one day after the Turn Around Day which I mentioned in my previous blog:

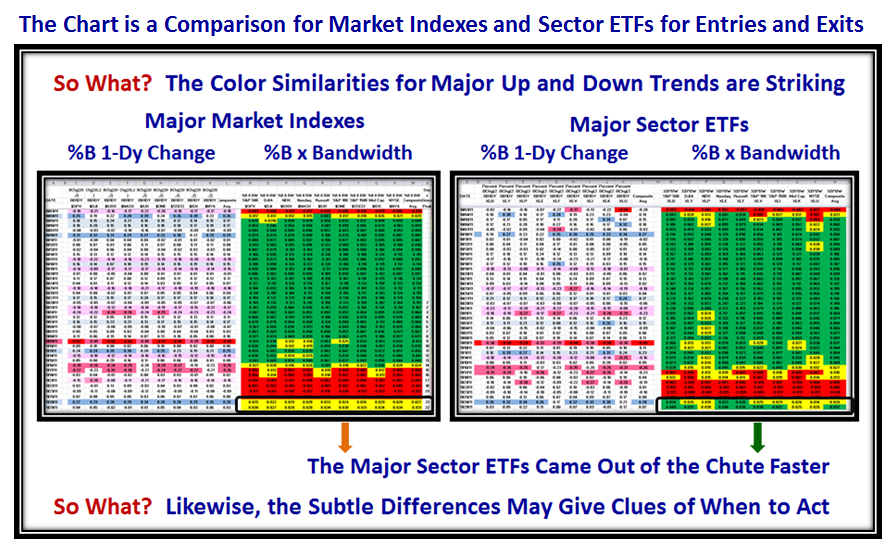
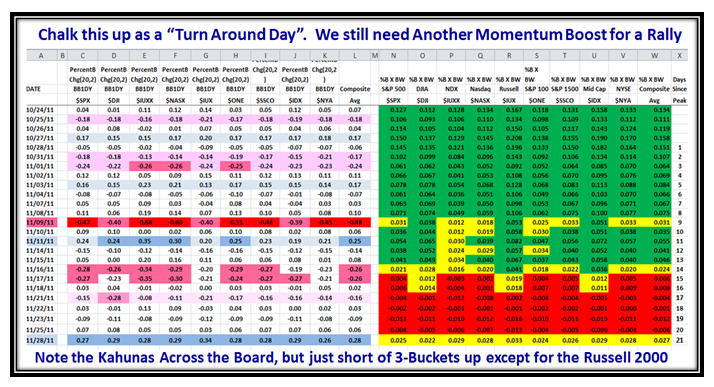
Having the ability to compare both the Major Market Indexes as well as the Sector ETFs stiffens up our backbones by seeing both the similarities and subtle differences to give clues of when to act as shown below.  The colors explain the similarities and differences…the numbers are not important for this illustration.

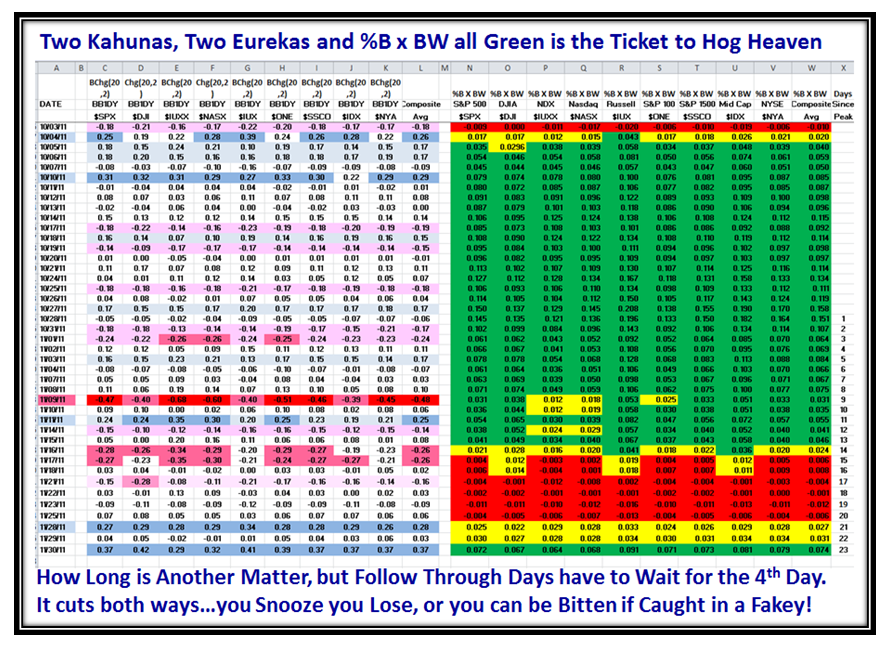
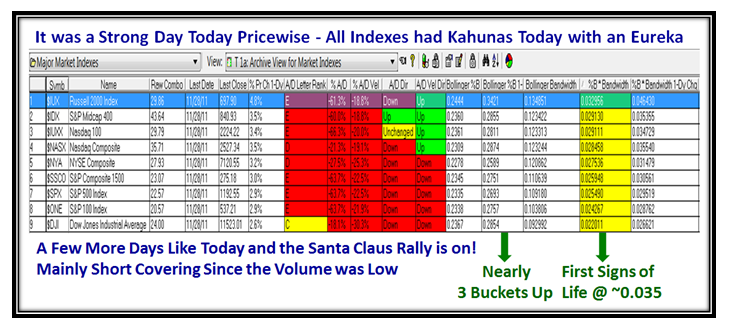
Now let’s look at the action today first for the Major Market Indexes and then for the Sector ETFs.  We immediately see that we have another run of Kahunas across the board and %B x BW is completely Green for both charts, which suggests a strong “Go” as of today for both sets of Indexes.  Yesterday would be an Early Call using the ETFs only:

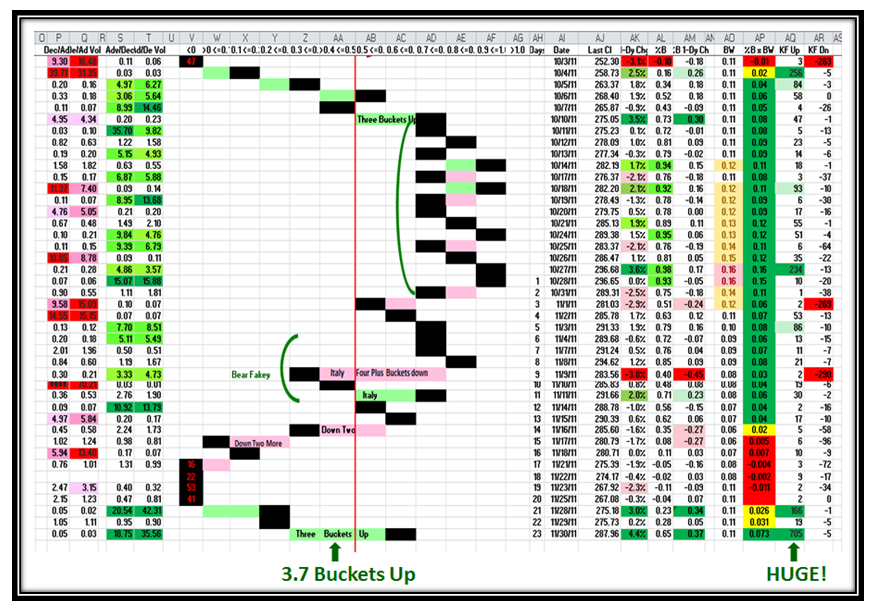
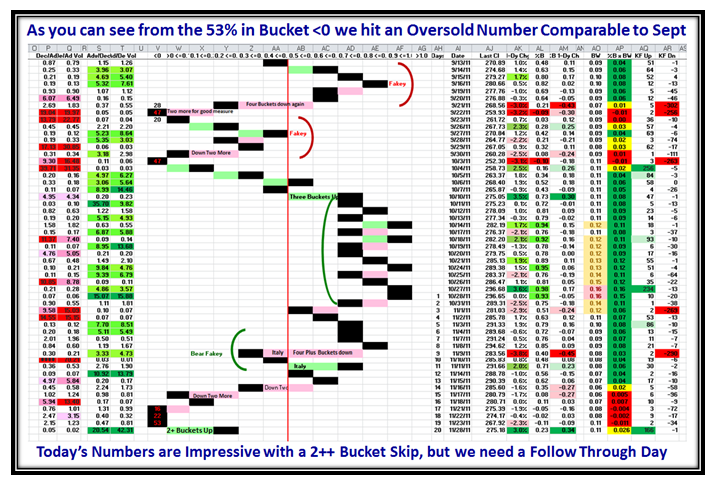
As I have mentioned many times before, a 3.7 Bucket Up Day is a sit up and take notice moment as it happens fairly rarely.  Of course when all Market Indexes are up over 4% it hardly matters as that of itself is very significant.  However, since we have essentially had this type of move twice within three days as shown on the next chart, that certainly shows that we have fresh strong momentum to the upside.  Just look at the 705 Kahuna Force Up moves registered today…that is not just short covering or I will eat my hat!

As we well know we still have the major hurdle of getting above the 200-dma which has been a bugaboo for this rally three times before and it could fizzle out once again.  However, as my youngest grandson of ten is known to have said “We will cross that bridge when we come to it!”.

There is always a balance between Risk and Reward, so play it the way the Market tells you to play it.

Best Regards, Ian.


Stock Market: Black Friday & Cyber Monday Hope for Santa Claus Rally

Monday, November 28th, 2011

Just when things were looking a trifle bleak with all the misery we put up with the past two weeks, we had a ray of hope today that we might still eke out a Santa Claus Rally.  U.S. stocks jumped as optimism grew that European leaders would come up with a new plan to resolve the region’s debt crisis and following a strong start to the holiday shopping season.

Except for the Volume which was disappointing for such a powerful snapback, it was a very strong day pricewise, and all Market Indexes had a Kahuna.  We also chalked up an Eureka after suffering three Phoenix signals to the downside last week.  A few more days like today are needed before we can even hope that the Santa Claus Rally is on, as it would seem that today’s volume action was mainly short covering, or the pundits were taking an extra day off to digest their Thanksgiving Turkey!

Let’s not get too excited as yet as one day does not a rally make!  The Market took a terrible beating as shown by the pie charts below which indicate that all boats were stuck in the mud and are still oversold despite the excellent day today:

Just to drive it home, here is the usual picture which shows the buckets for the S&P 1500 and we can readily see the damage that was done last week before we bounced back with a 2++ Bucket Skip up today.  This could be the start of a new rally, but we need a Follow Through Day and then some more momentum to get through the resistance that we now face:

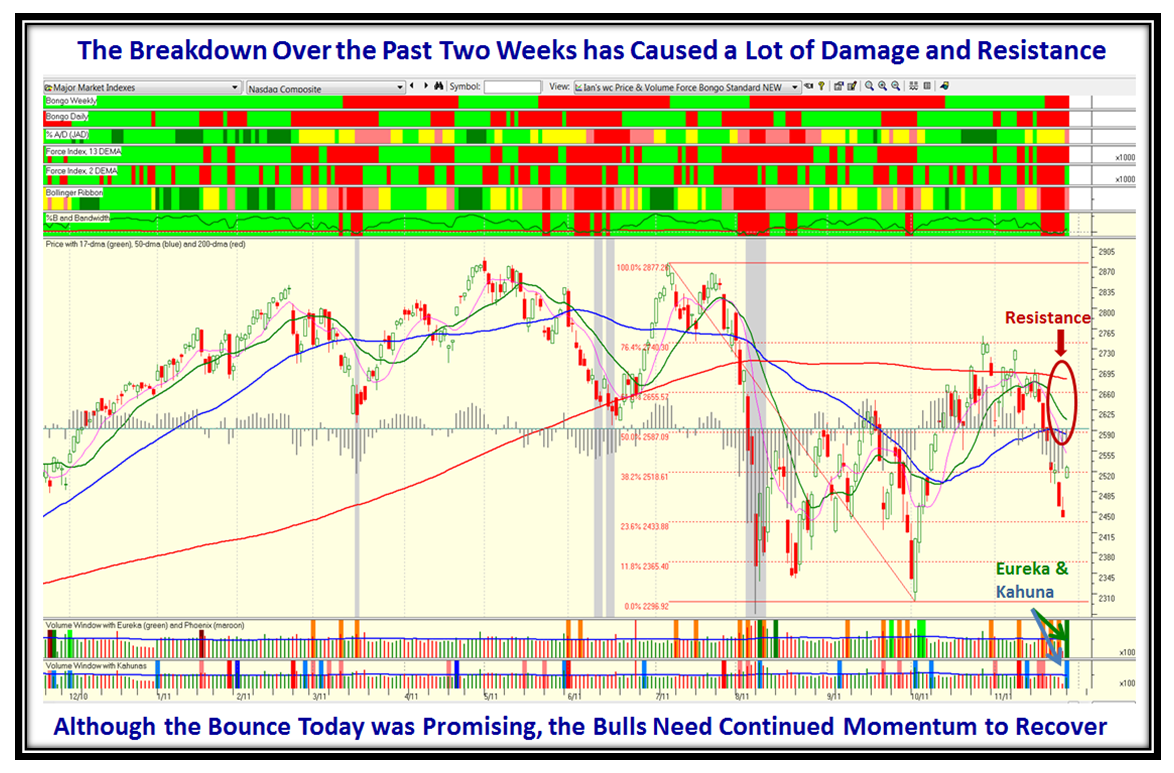
…And Finally, we can see that we have a long way to recover with the 50-dma and 200-dma hanging over our heads as this Market tries to right itself and either drive for a strong Santa Claus Rally or fall back once again to head down and test the lows at 2300:

Let’s hope I can resurrect our favorite picture of Santa Claus in his Red MG having to contend with a few Moose Droppings along the way, but hopefully overcoming the grinning Grinch who might be waiting in the wings to ruin our fun.

Best Regards, Ian.

Stock Market Windsock: Anemic!

Sunday, November 20th, 2011

It goes without saying that the events of the past week have turned this recent Rally to Anemic:

Continuing with the recent theme on the blog of %B x BW, allow me a little sentiment with this picture:

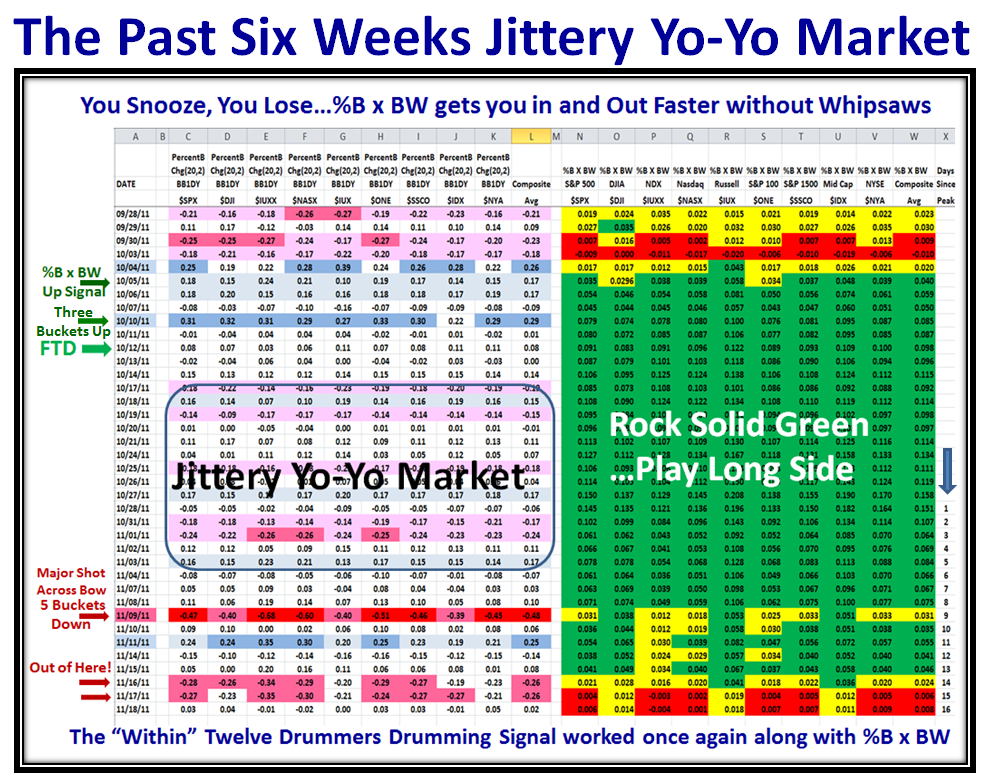
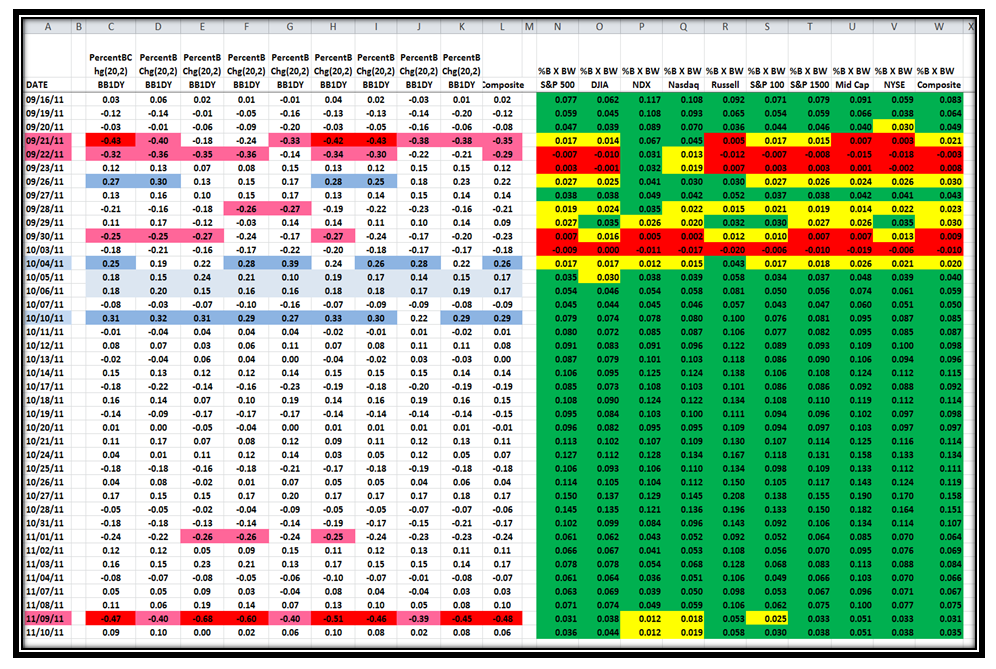
Here are the recent results picking up from the last Blog Note, which shows the Process is working very well:

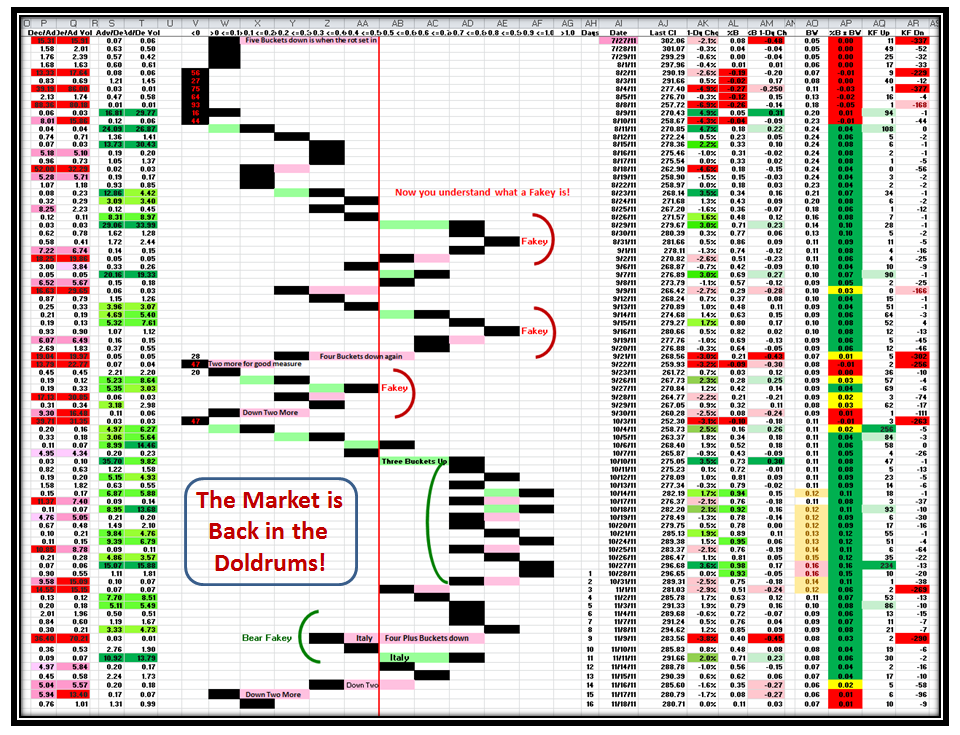
The Five Buckets down on 11/09/2011 turned the %B x BW to mostly yellow, nine days from the Market High, and despite an oversold bounce two days later, it was not enough to stave off the rot that had set in, and 11/16/2011 and 11/17/2011 cooked the rally to “Market in Correction”.  The Process got you in 4 to 5 days early and did the same on the way out.  Note the eight days of a Jittery Yo-Yo Market which would drive most to nightmares, but the technique kept you in until the true major warning sign of FIVE Buckets Down.  That Rule is Golden!  Take it to the Bank.  Likewise 3 Buckets up together with Eurekas and Kahunas within a week has proven solid for a Fresh Rally provided %B x BW is also Green as seen above.

Here is the corresponding picture that you are now familiar with, which shows the Market is very weak:

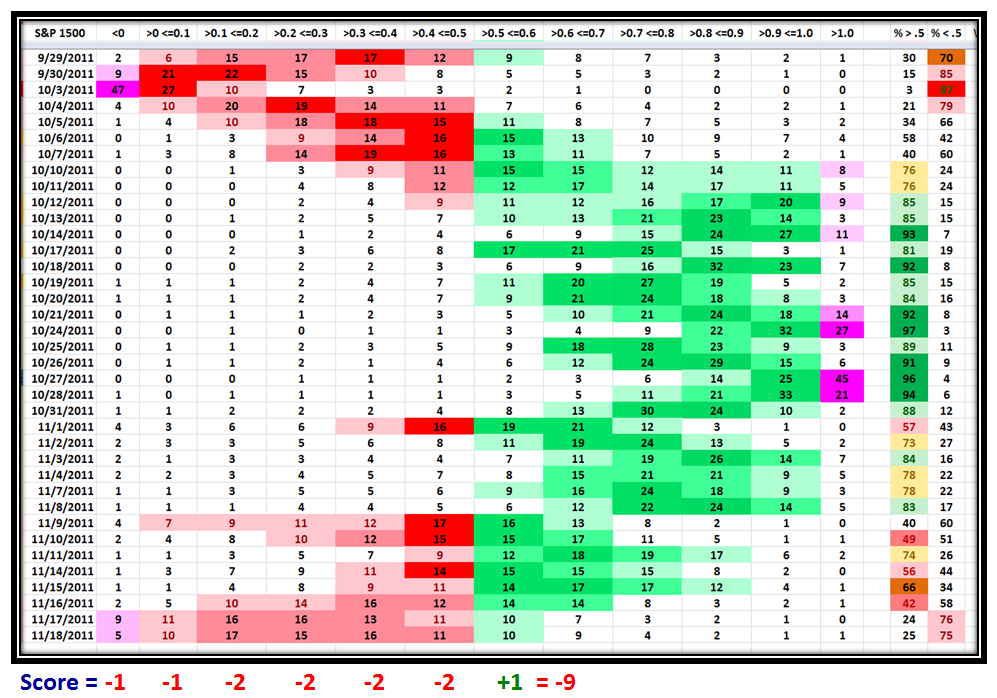
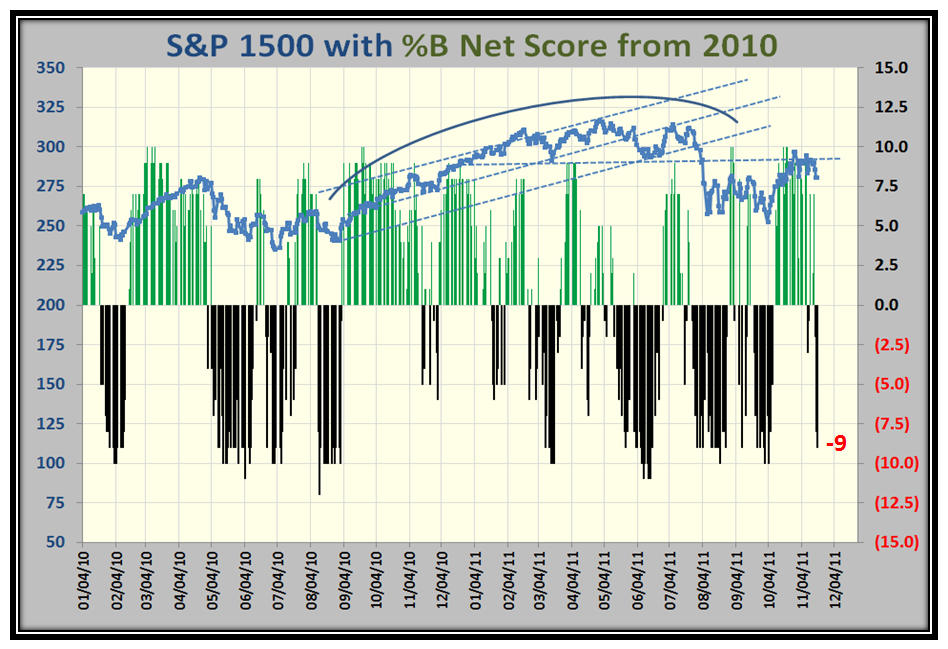
…And here are the %’s in each Bucket for the S&P 1500 with Color Coding to emphasize strength and weakness, which shows the score is -9:

The Score of -9 confirms the Anemic State of the Market, and here is what it means relative to past history.  Note that when the score is this low, it has a struggle to recover any time soon:

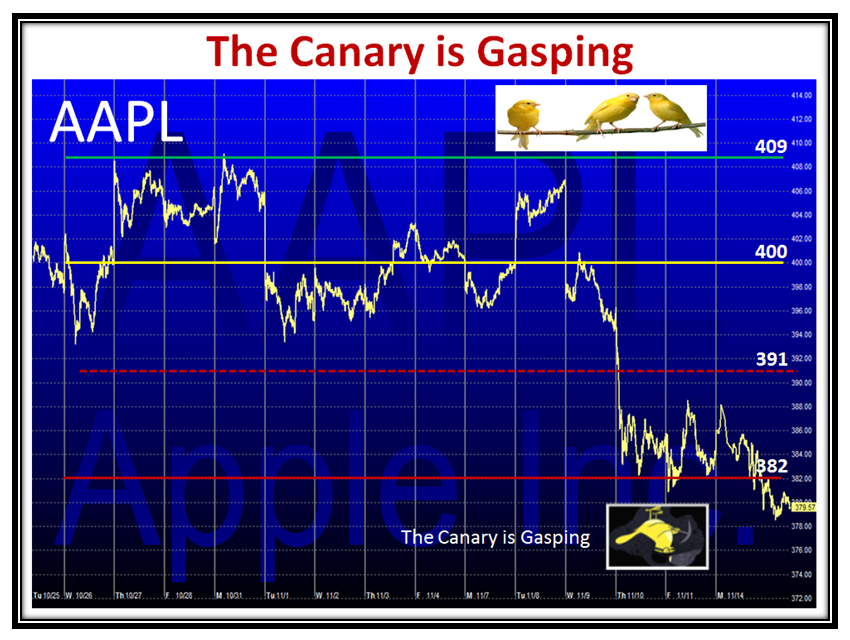
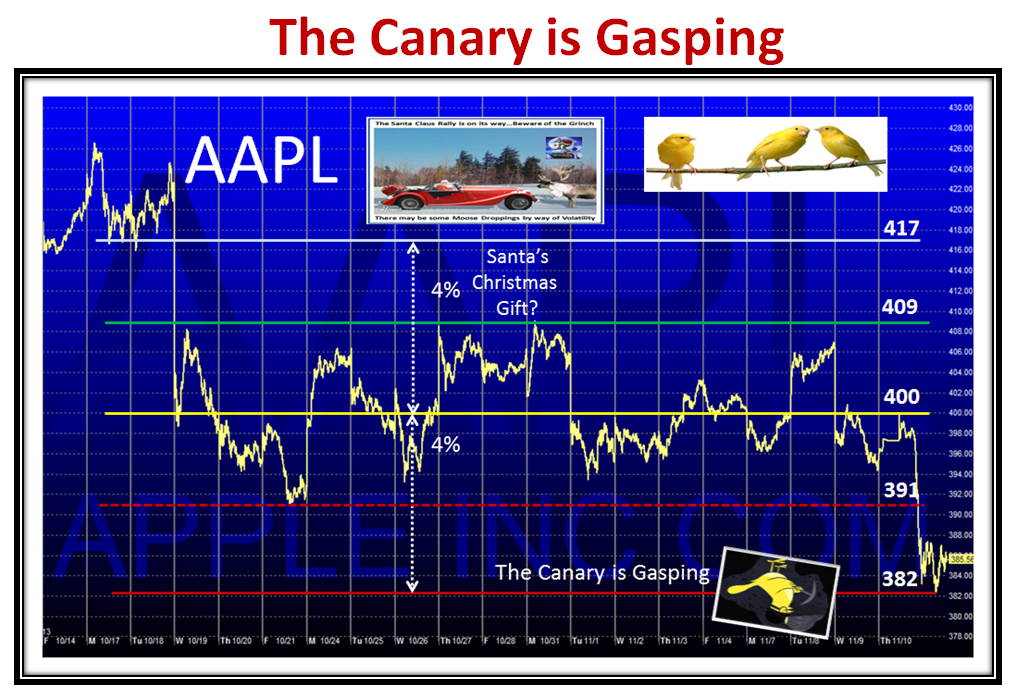
Let’s not forget the chief Canary AAPL, which is Gasping at this stage:

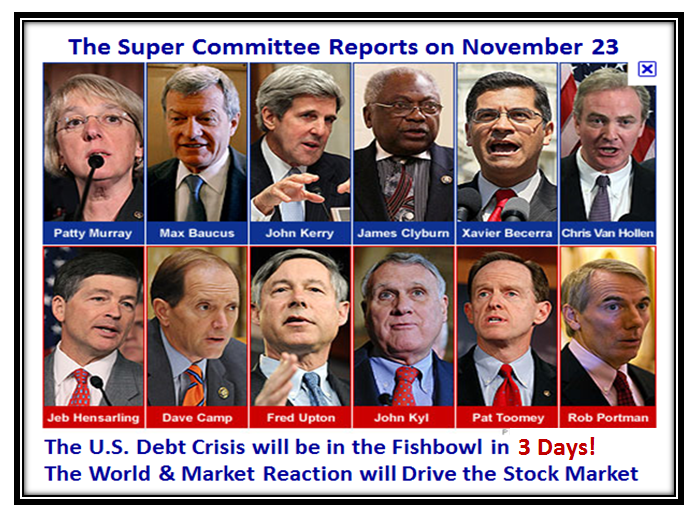
So What?…I don’t have to remind you that the Supercommittee of 12 have a deadline this coming Wednesday, and they are deadlocked.

Keep your Powder Dry! With Best Wishes for a Very Happy Thanksgiving from the HGSI Team,  Ian:


You Snooze, You Lose…Update

Thursday, November 10th, 2011

Ian,

The new charts and bigger size was very helpful to see the tools in action.  Would it be possible to update with 11-10-2011 data to see the change we got today with the market moving back up?

Thanks,

Jim

Have a heart, Jim, but in the spirit of answering you, here is just one chart updated.  If you had any idea of how long it takes me to do this stuff, I’m sure you would not want me to sit up late tonight.

In my last note I said that the %B x BW changed to just two yellow, with NDX and Nasdaq staying Yellow, but the S&P 100 changed back to Green.  You can see the change above.

Good luck, Ian.

Stock Market: You Snooze You Lose

Thursday, November 10th, 2011

Last night I gave you my latest results of the research I have done using %B x Bandwidth, and it seems that the picture I left you with was too small to understand since it is not enough to trust, but one must verify.  The hour was late and all I got was one response to what I believe is breaking new ground.  However, I see my friends from Qatar are taking note!  Be that as it may, I repeat…You snooze, you lose.

My good friend Chris White has provided me with the tools to show you why I have confidence using his EdgeRater Product, where he does the whole kit and kaboodle for you in a Template.  It doesn’t get any easier and you judge for yourself as I unfold this good stuff step by step as to whether between my work and his tools we may make and save you money by keeping you on the right side of the market…more so than most:

Now to address the one response I got today, which I appreciate:

Ian,
Thank you for your timely blogs to help us stay sane in this crazy market. I increased the size of your last chart in the blog as much as I could (twice) but still cant read the numbers ( 21″ monitor) and what it is saying. Is there any way to blow that up and resend it? Thanks, Bob

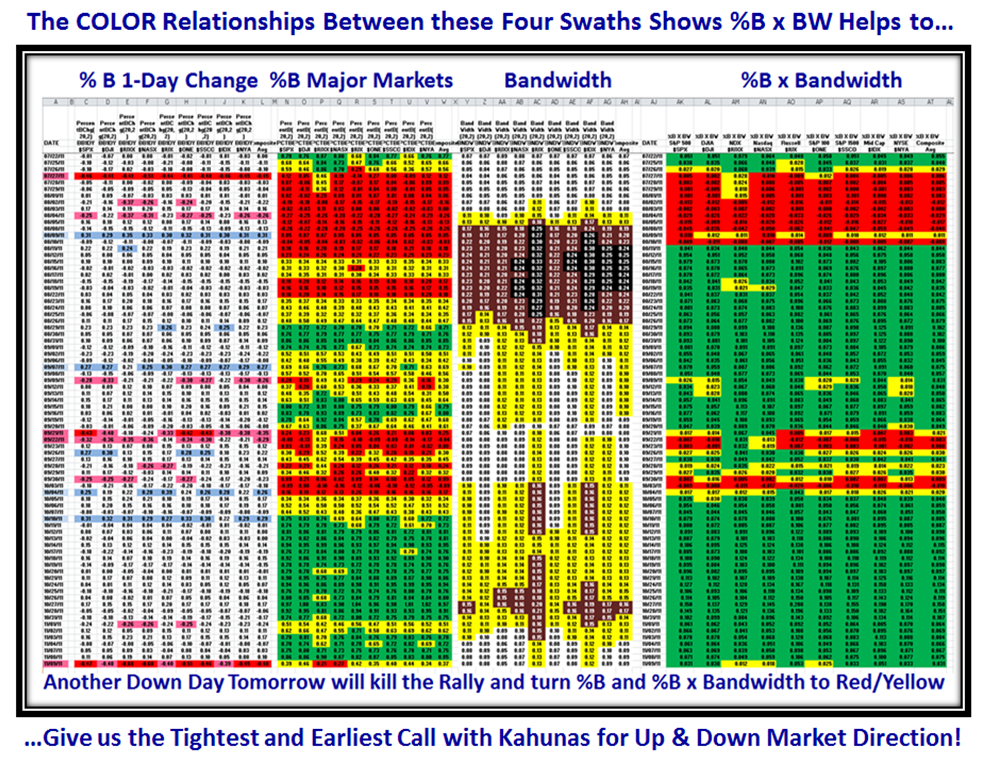
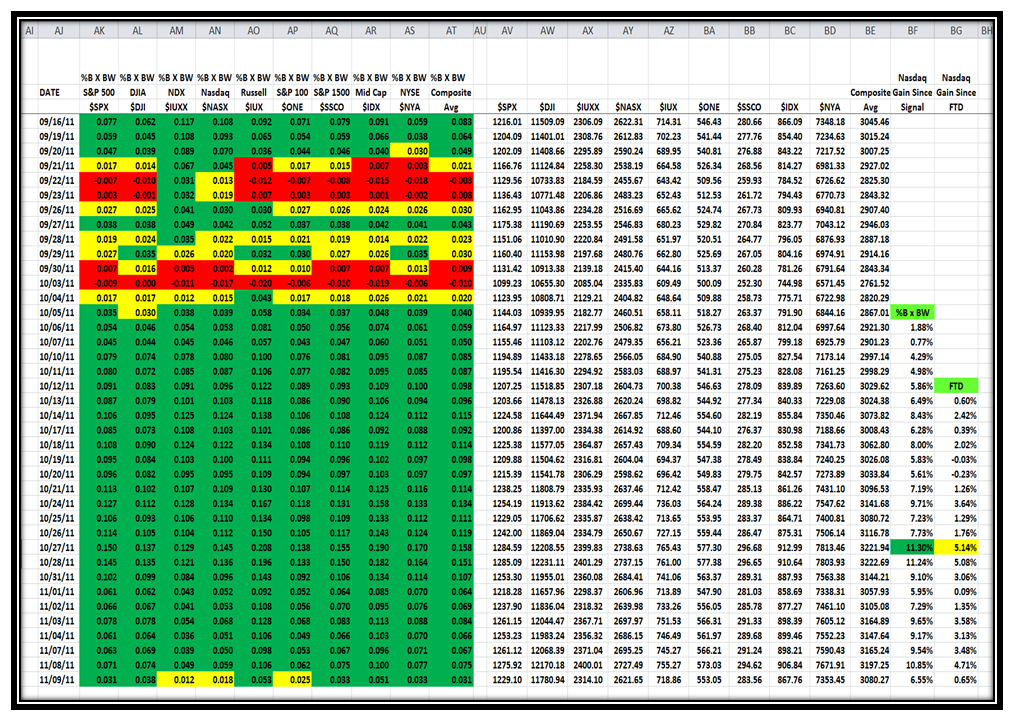
Bob, your wish is my command.  Here is a step by step view of the four swaths, starting with the original with all four scrunched together to give you a general view as I did late last night, and then the “Real Proof in the Pudding” or the “So What?” is the fifth swath of %Gain from the day of the Signal.  This first chart showing all four swaths was intended to give you a general view of the inter-relationships, and maintains continuity for you from last night’s blog note:

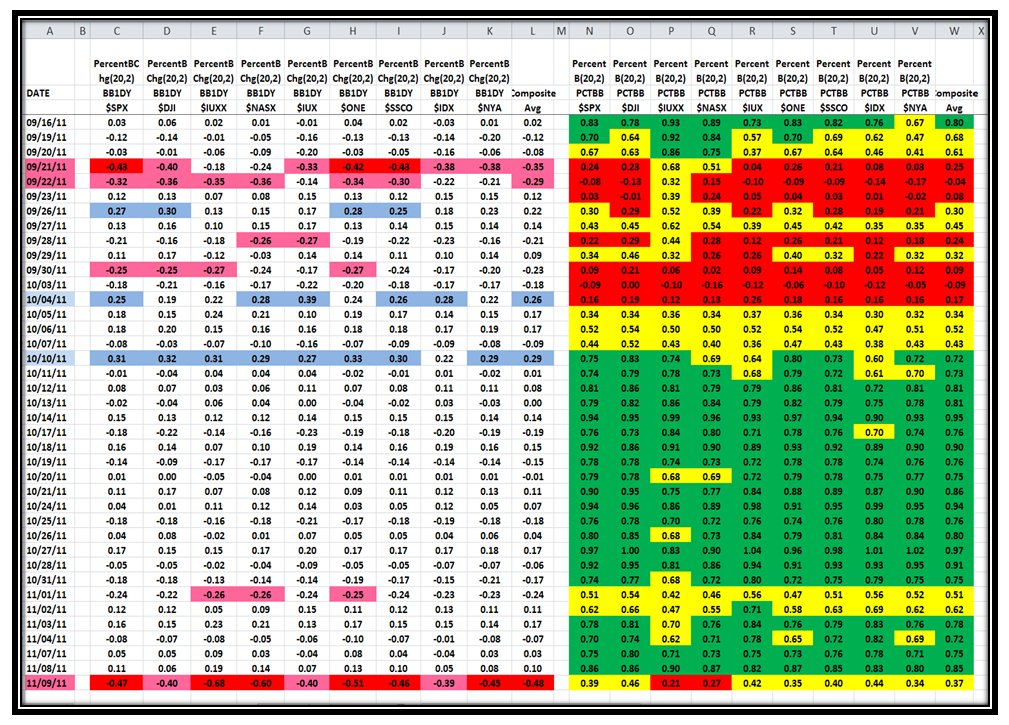
Now here are the first two Swaths, %B 1-Day Change and %B, and hopefully you can read the numbers this time, when you click on the chart itself which will give you a bigger picture.  Note that when we see a string of Kahunas down or up, as we see on 09/21/2011 and 10/10/2011, respectively, %B essentially changes color in unison

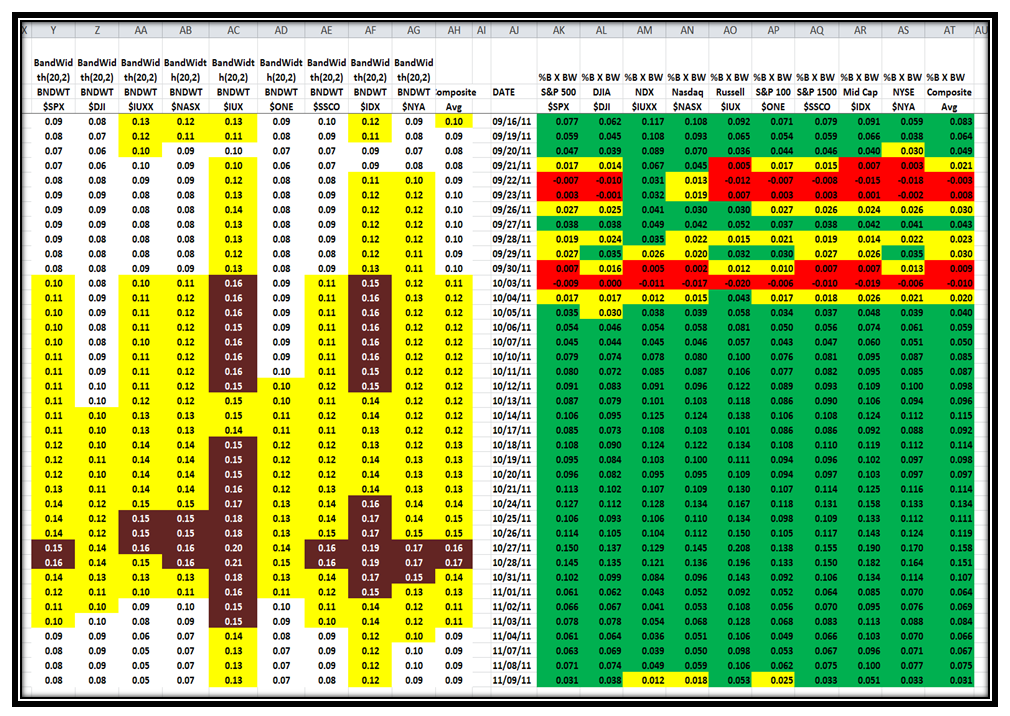
Next we have Swaths 3 and 4, Bandwidth and %B x BW:

If we look at the last line, we see that Bandwidth had mainly the same readings and identical Conditional Color Formatting, while %B x Bandwidth showed that three numbers changed from Green to Yellow, signaling a caution but no major change, implying that although we had a 4&1/2 bucket drop in most Indexes in %B, the Rally was not yet dead!  I have not updated the chart for today’s readings, but as you would expect given that it was a ho-hum positive day the colors for %B x BW improved to just two “yellows” for the NDX and Nasdaq, while the S&P 100 came back to “green”.  I am not for one minute suggesting that the Market is not on shaky ground, which it is, but it is still not dead!

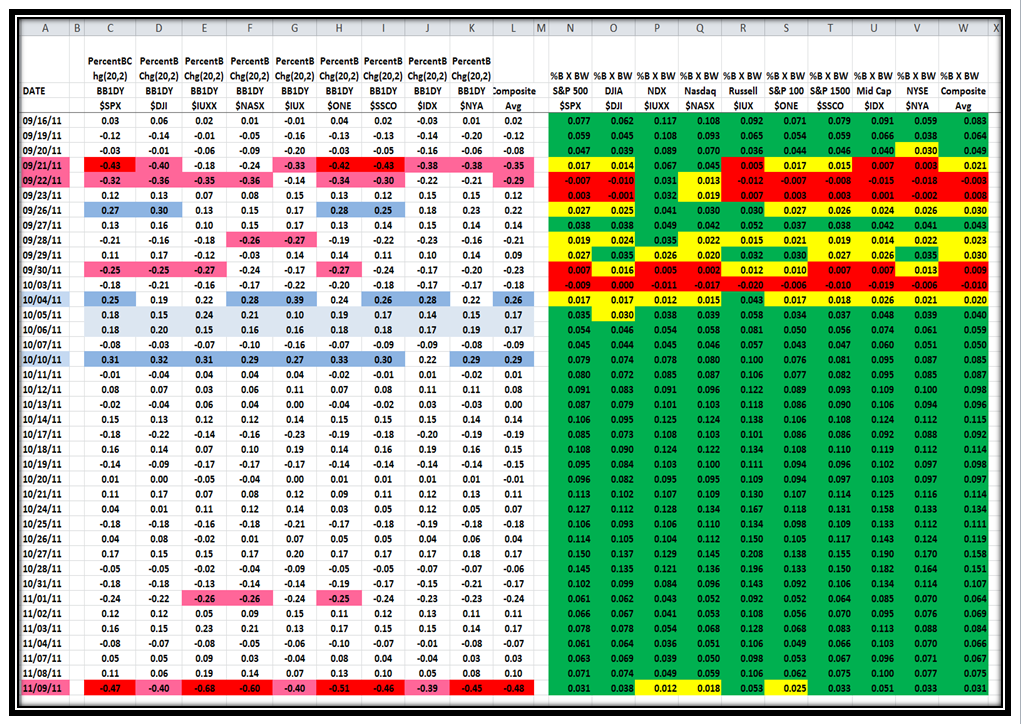
Next, just to prolong the agony, since this is the first time I am walking you through the logic, I show Swath 1 and 4, %B 1-Day Change and %B x BW.  However, you will note that this time I have colored the swaths for 10/05/2011 and 10/06/2011 with a light blue just to draw your attention that although there were no Kahunas on those days, the momentum was still impressive with what I would call 2/3rd. of a Kahuna on both days…remember that a Kahuna is 0.24.  In other words we see three days in a row with strong Momentum from 10/04 to 10/06, which resulted in %B x BW changing color to “Green”, implying that the signal that recovery with a New Rally was confirmed on 10/05/2011.  Obviously by 10/10/2011 when we had another strong swath of Kahunas, the %B x BW was sitting with four days of solid green.  Please understand that the Follow Through Day was not signalled until 10/12/2011 which was two days later.

You might well be asking when does this process signal that the market has turned back to a Bear Market or that the Rally is dead…I would want to see at least six of the Market Indexes turn to Yellow/Red for %B x BW.  Likewise, I am equally sure that you are saying “So What?”  The answer is on the next swath which shows the %B x BW together with the actual Index close prices, which comes back to my opening picture of “You Snooze, You Lose!”

The So What is that with the process I have shown you you stood to double your gains at the peak, between friends, over the FTD system.  Yes, of course, the Market is under pressure…it ought to be after a ~5 Bucket drop and it will take good news out of Europe and momentum buying from the Large Players or we head down into the doldrums.  I have always taught you to watch the Canaries in the Coal Mine and my charts of four Market Indexes in the previous Blog gave you the picture that we are flirting with the lower support levels too close for comfort.  But, for tonight to round this blog note off, let’s just look at the “Go To Canary”, AAPL, and you will see that it is Gasping and nearly out for the count!

So there you have it.  We will see how useful this is going forward.  We are at a critical point, but not yet out for the count!

Best Regards, Ian.

Copyright © 2007-2010 Ian Woodward
Disclaimer: Commentaries on this Blog are not to be construed as recommendations to buy or sell the market and/or specific securites. The consumer of the information is responsible for their own investment decisions.