Akiva from Israel asks the following question:
Hi Ian,
I am not sure I am following your logic. If you are looking for stocks that may go up:
If in slide: “In the Warehouse Module”, the selection is on “Wolfpack up..”.
Why do you screen OUT (per 4 )- RS>80 and Stock > 200-dma)? These stocks with Box 7 should have the best potential of
going up.
Thank you for your dedication and close assistance.
Akiva
Akiva: With the HGSI software you can tailor your needs to whatever your heart desires! My lesson yesterday showed you the value of using Box 1 and Box 7 stocks primarily, and that has been the case over all these years. However, it all depends on Market Conditions at the time you start to ferret for winners. At least from the responses I got, most of you know that Box 7 stocks are where you will find the goldmine. For those who didn’t know it was right under your nose, now is the time to do some homework, and by the responses I got, they are sitting up and taking notice!
Now, coming to your specific questions, the reason I chose the approach I described were three considerations:
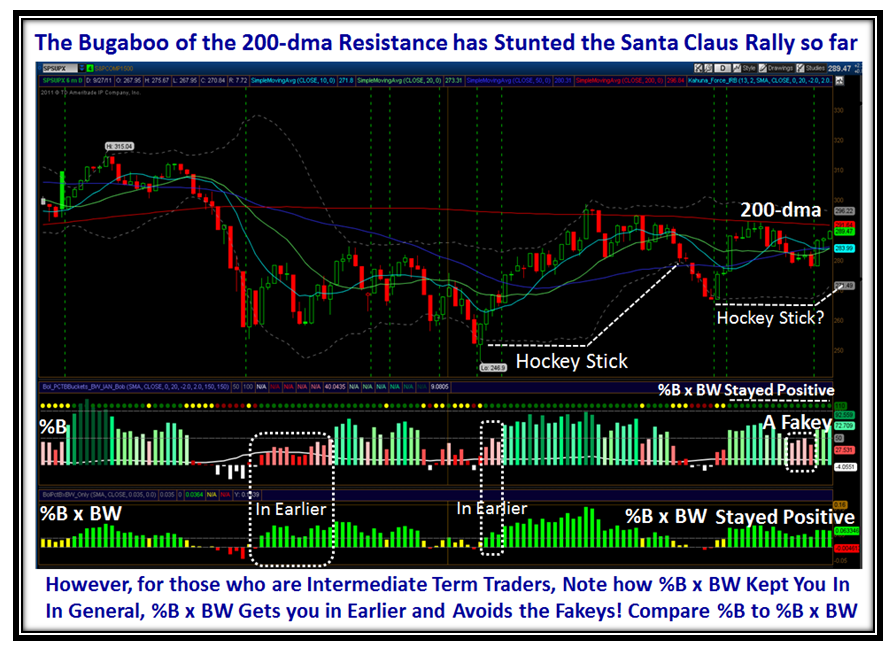
1. Market Conditions – Stuck in the mud with 200-dma Resistance
2. Showing Strength in a Weak Market
3. Eliminate Laggards for Best Results – and personal time factor.
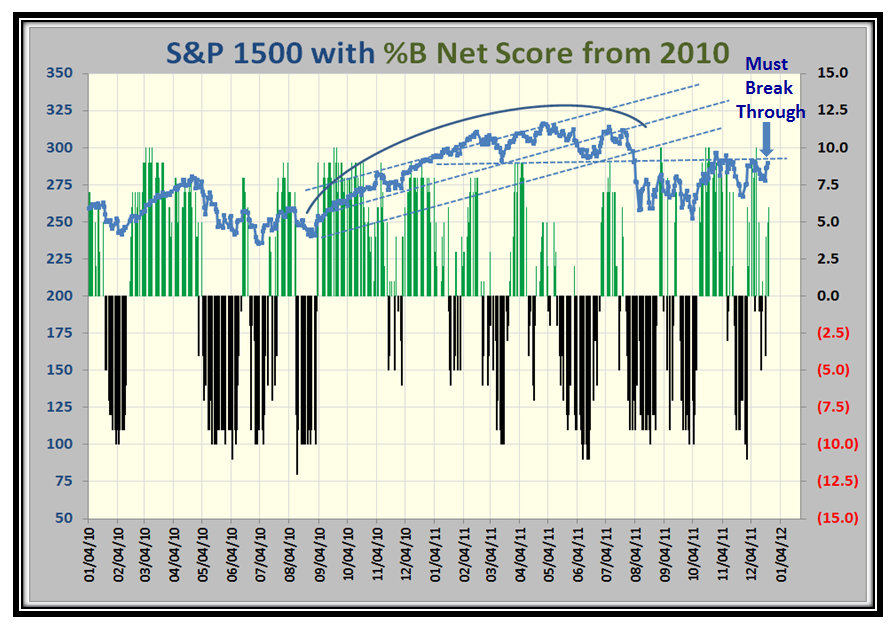
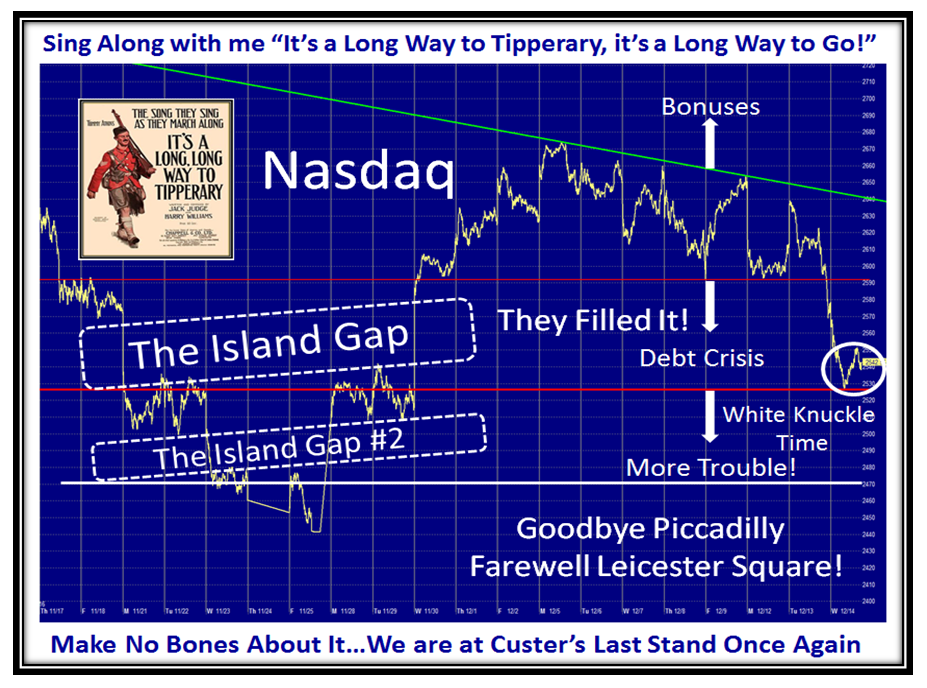
I have been preaching to the choir for several weeks and even months that this Market is stuck in second gear and until it breaks out significantly to the upside of the 200-dma, we will yo-yo around until the cows come home or until they fill the Island Gap which they sniffed at today. You noticed that all it took yesterday to focus on the problem in the market was the opening chart I showed you.
Building on that point, I wanted to show you how to prune the list from several hundred stocks down to the few that were the leaders in this current environment, so naturally any stock that had an Accumulation/Distribution of “D” was a laggard, so those are the first ones to prune. Again, if the stock itself was below the 200-dma, it too must be considered a laggard at this point in time, so out they go. Last but not least you want to work with Stocks that are showing some signs of life, so Relative Strength Rank of 80 and above pluck out those Leaders. So that was my rationale.
Now let me turn the tables on you…Are you interested in Bottom Fishing in this environment? I always say that your stomach is different than mine and if that is your bent be my guest, but you will soon see the frustration of playing with laggard stocks just because they are beaten down and supposedly cheap. Cheap can get cheaper.
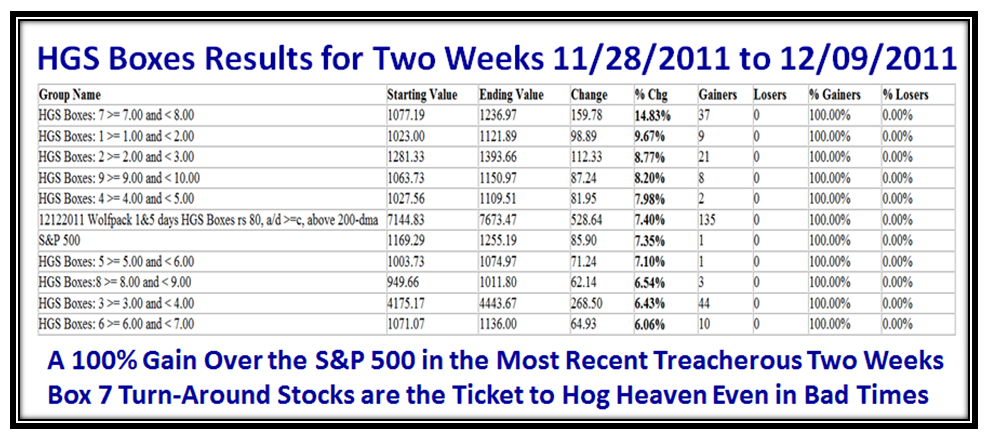
But more importantly the key question is did I MISS something by pruning the way I did? Let’s take a look. Here are the two week results I showed yesterday for the selection I chose:
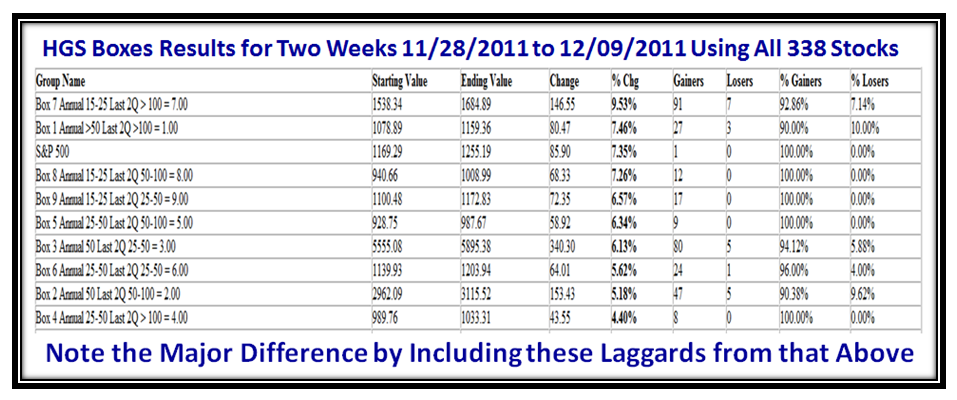
Now let’s look at the picture if I had NOT pruned those laggard stocks out:
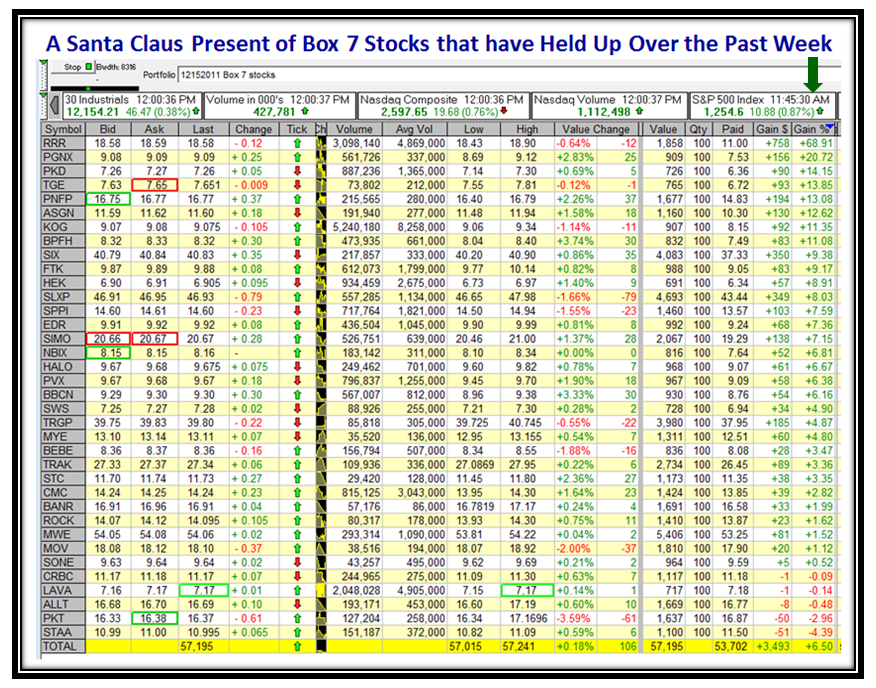
Box 7 and Box 1 still come out on top, but the results are no where near as good, so why waste our time? I would rather prune from 37 stocks than have to wade through 98 Box 7 stocks by flicking through the chart patterns to see if they are even worth bothering with. By the way, note that at this stage we have pruned a Database of close to 8000 stocks to just 37 to do the real homework. We know for sure that not only do they have Fundamental MOMENTUM but also Technical Momentum.
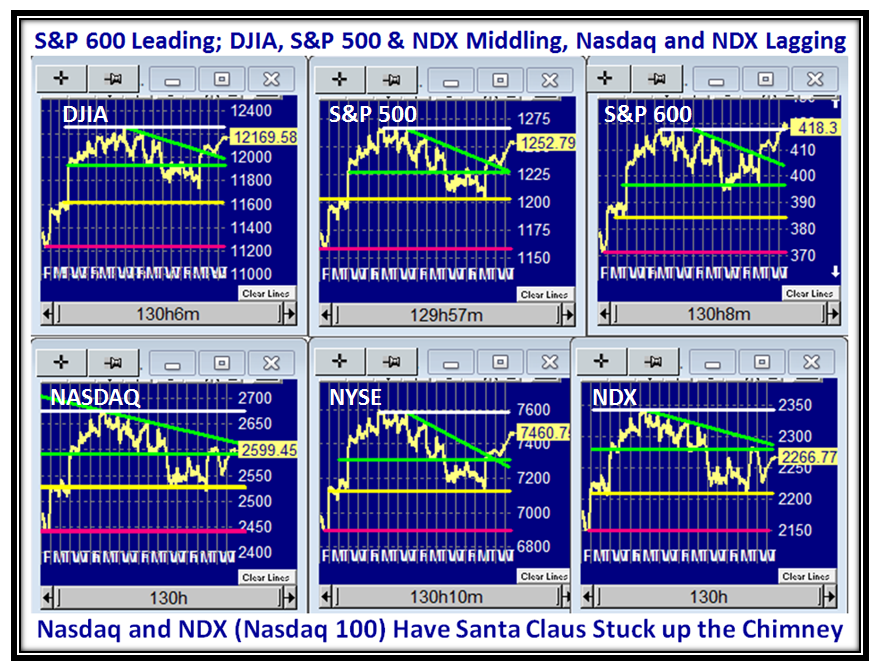
Let’s look at the Index charts for these two sets of stocks to see the difference. Immediately you will see that the set of 37 are leaders compared to the set of 98 which are laggards as I show in the next two slides:
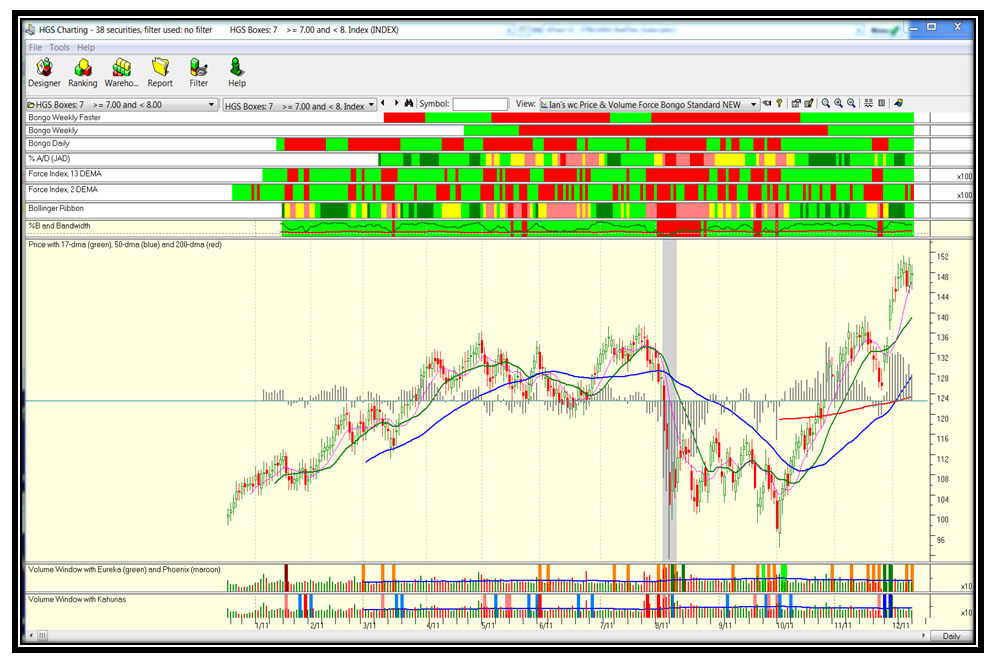
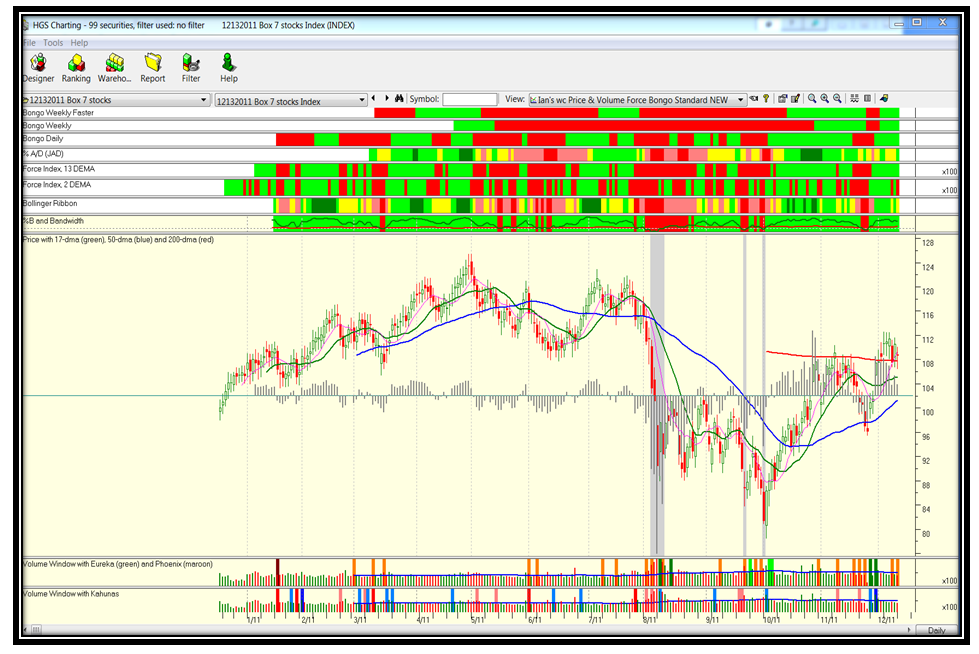
Now let me anticipate your next three questions:
1. “But Ian, if I buy from the set of 38, they are all extended…my chances of making money is less, isn’t it?” Wrong, they are the leaders, they will go higher IF the Market goes Higher. They will be hit hard, if the market goes down, because they are fat with profits. It’s all a question of timing, and Risk vs. Reward. That discussion takes three days of concentrated effort by Ron and myself and several others at the seminars to come to a common understanding. But at least you now know where the current goldmine is and when to strike when the iron is hot!
2. “And Ian, are you suggesting that I buy extended stocks?” Not at all, you have heard Ron and I say time and time again, be careful and watch for pull-backs. Also, if the stocks are extended get out your High Jump tool and see if the risk is too great.
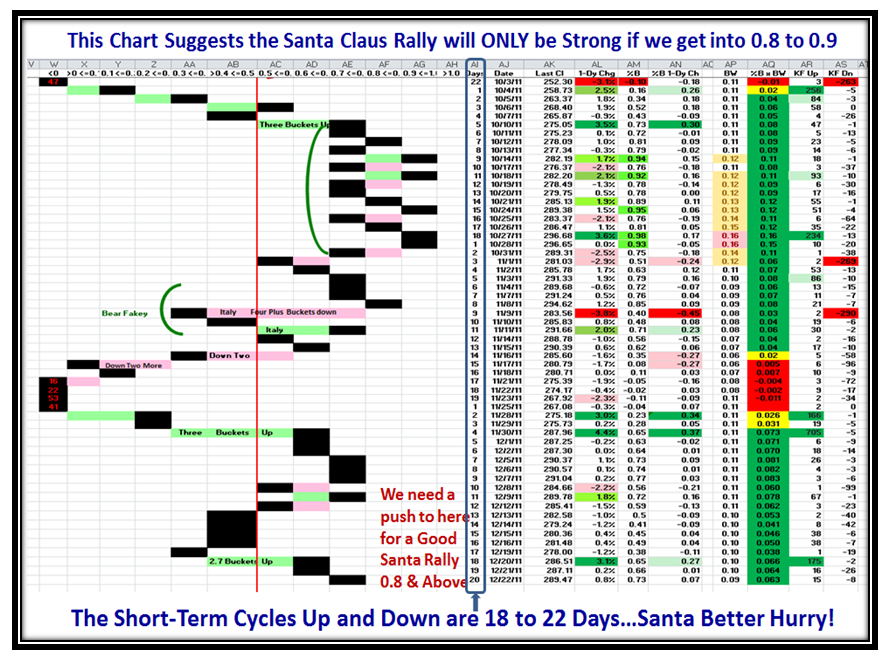
3. “But then …when do I hit the right moment”, you might ask? Hog Heaven is 2 Eurekas and 1 or 2 Kahunas within 5 days and if you get three buckets up with %B 1-Dy Chg, so much the better and go for it as I have proven to you time and time again over the past three years. Just look at the charts right in front of you and they are there staring you in the face. Likewise look at the two ORANGE Phoenix Signals in the last three days, which should be enough to tell you “Fools Rush in Where Angels Fear to Tread!”…a good old Frank Sinatra song from the past.
Now to cap this off, these last two Blog Notes are to show you the VALUE of the HGS Boxes featured in the HGSI software. If you believe there is a “Secretariat” Pony in here, then why not start at the beginning and use “All Securities” and then select all HGS Box Stocks from that list of ~8000 stocks. You should find about 631 stocks with HGS Boxes listed.
Sort on A/D Letter Rank for C or better and we get 453 stocks. Make Group From List.
Then try, %Cl/200-dma and you will cut that lot down by about half to 232 stocks. Make Group from List.
Lastly, apply RS Rank >80 and we are down to 187 stocks plus the index. Make Group from List.
Please don’t quarrel with me if your numbers are different…it is either pilot error, or different databases at different times and certainly not the HGSI Software. Invariably it is Pilot Error as most forget to remove a filter.
And Finally, if you want to work with only Box 1 and Box 7 stocks you will have 10 + 64 stocks, respectively, for a universe of 74 stocks…a reduction of 100 fold from the original 8000 stocks in the Database. Now do your homework with the Christmas Present I just gave to you all from the HGSI Team!
Best Regards, Ian.
 Ian Woodward's Investing Blog

