Ian Woodward's Investing Blog

Archive for December, 2011

HGS Boxes to the Rescue!

Monday, December 12th, 2011

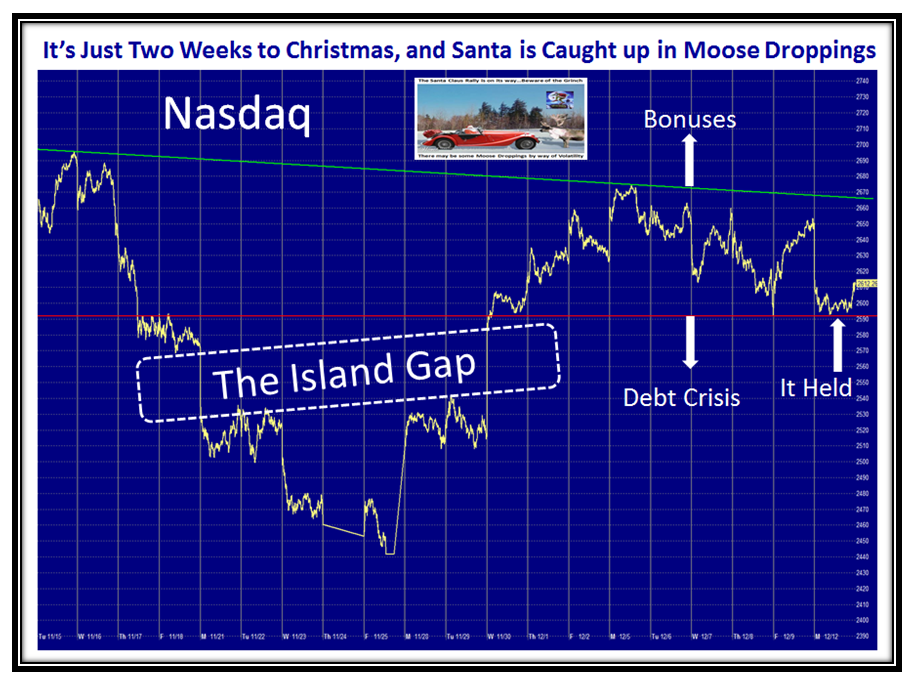
We had another “Shot across the Bow” today, and I haven’t waited to see the nightly results as we are back to the same old Yo-Yo Market that all of us are getting fed up with.  Those that are firmly in the Bear Camp are chuckling about the heavy resistance at the 200-dma and until that gets broken or the Island Gap I mentioned a week or so ago gets filled we will ying-yang around.  So I will summarize the Market situation with just one chart which says it all.  I can’t make a silk purse out of a Sow’s Ear!

Those of you who are HGSI Software users will get a treat in this blog note as I have stirred up enough interest to quickly demonstrate a feature you will only find in it, which should convince you that one can find profitable stocks in rotten markets for the short, medium and long term if you will use the HGS Boxes Concept I developed over 20 Years ago.  It is still as fresh today as it was back then:

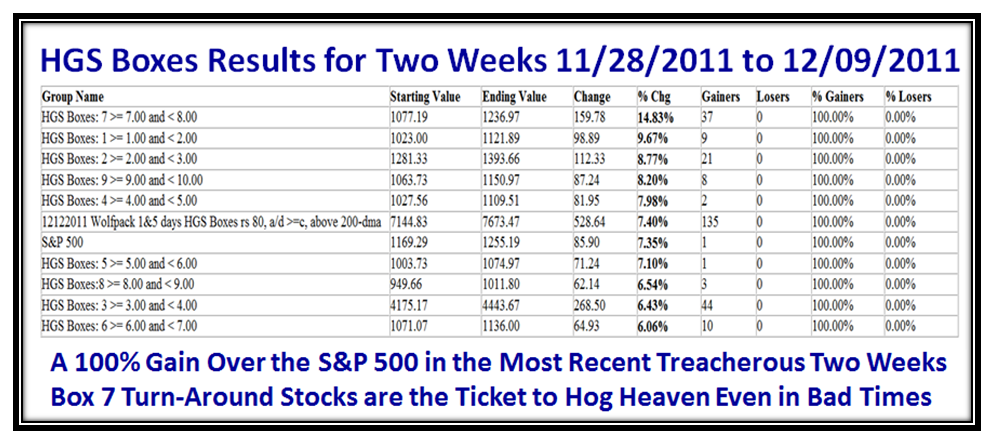
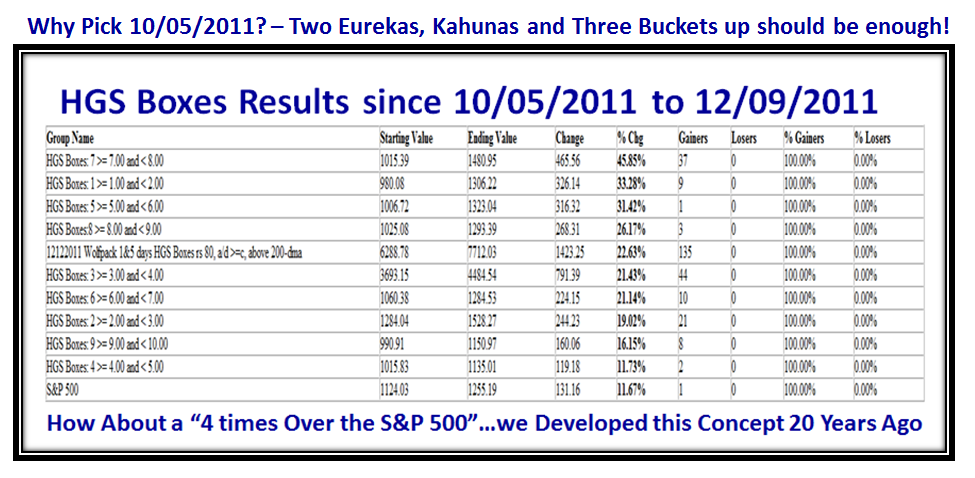
Those who follow Ron’s Weekly Movie were delighted with his subject of WolfPacks and his approach to ferreting for profitable stocks at times like these.  Building on his concept, I have chosen to use his same screen and use HGS Boxes to find the big winners.  It will be no surprise that the Box 7 Turn-around Stocks lead the way.  You and I know that the last two weeks have been a nightmare, but let me quickly show you how the various Box stocks performed recently, where you could have theoretically made 100% over the S&P 500 by just working with Box 7 stocks alone.  Let me first give you the results and then I will unfold how to find these gems in HGSI:

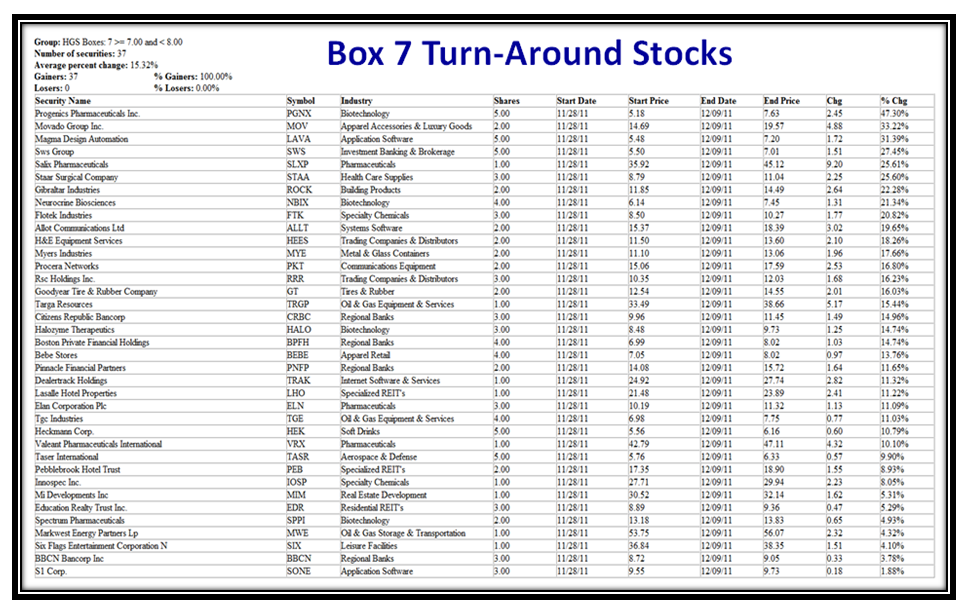
…And here are the stocks for Box 7 on the list.  The Majority are over 10% in ten days and a few as much as three times that, so it is impressive:

Some may turn up their noses at low priced stocks while others find it their cup of tea, but there is enough of a mixture of quality stocks to go around, especially when small-caps are again in favor.  The important factor is that they all have good RECENT Earnings Credentials by way of Earnings Growth in the last two qtrs. compared to a year ago…i.e., they have “Gas in the Tank”.

So how do you ferret for these stocks is now your burning question?  By the way, thank you for responding to my question on the HGSI Bulletin Board, many of whom already knew to watch for Box 7 stocks.

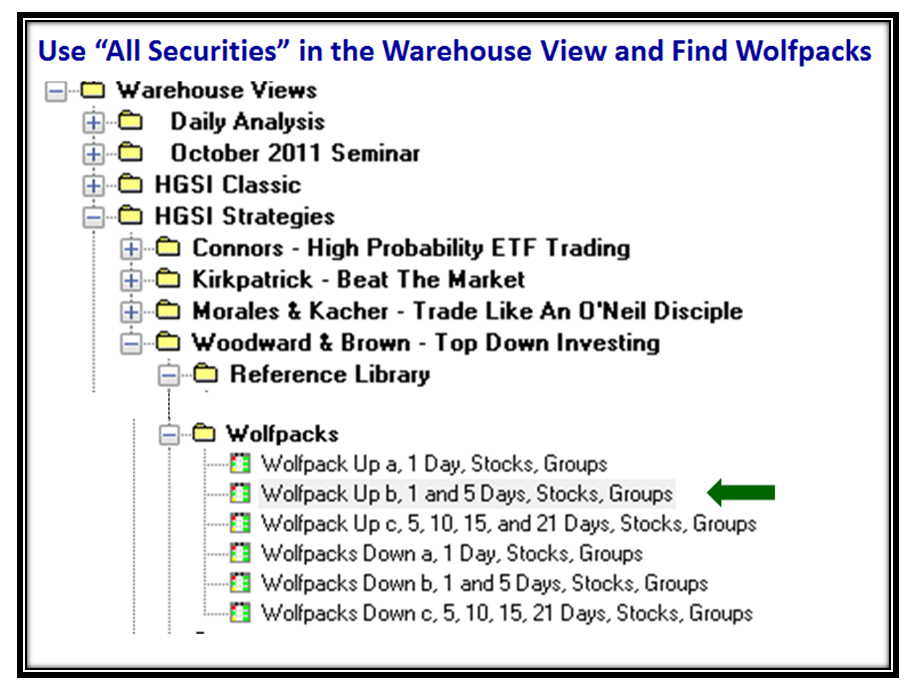
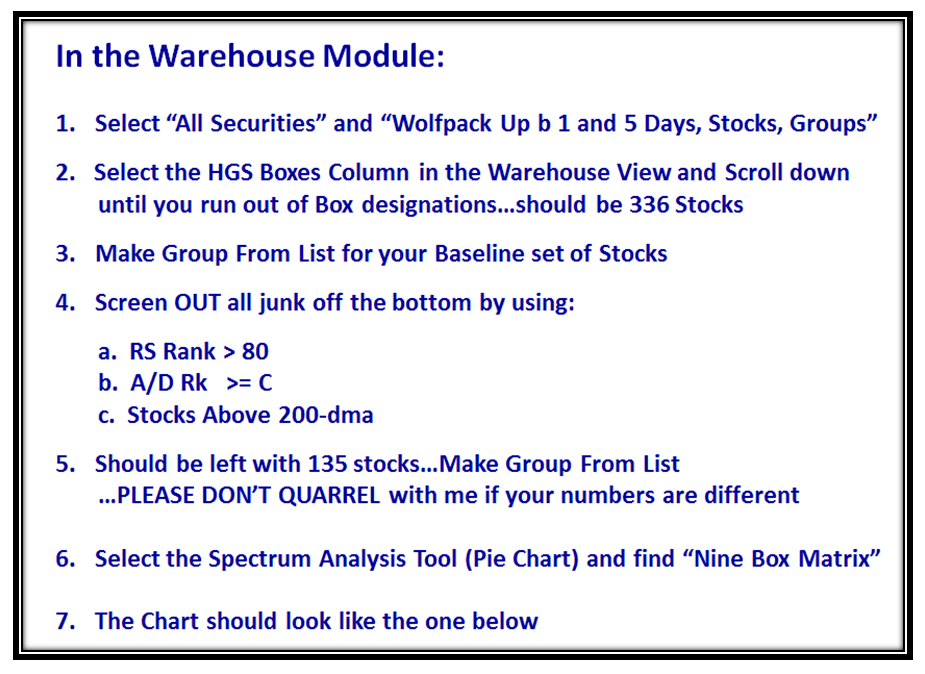
…And here are the Steps in the Process, which to most is a ten minute exercise if you are familiar with the program:

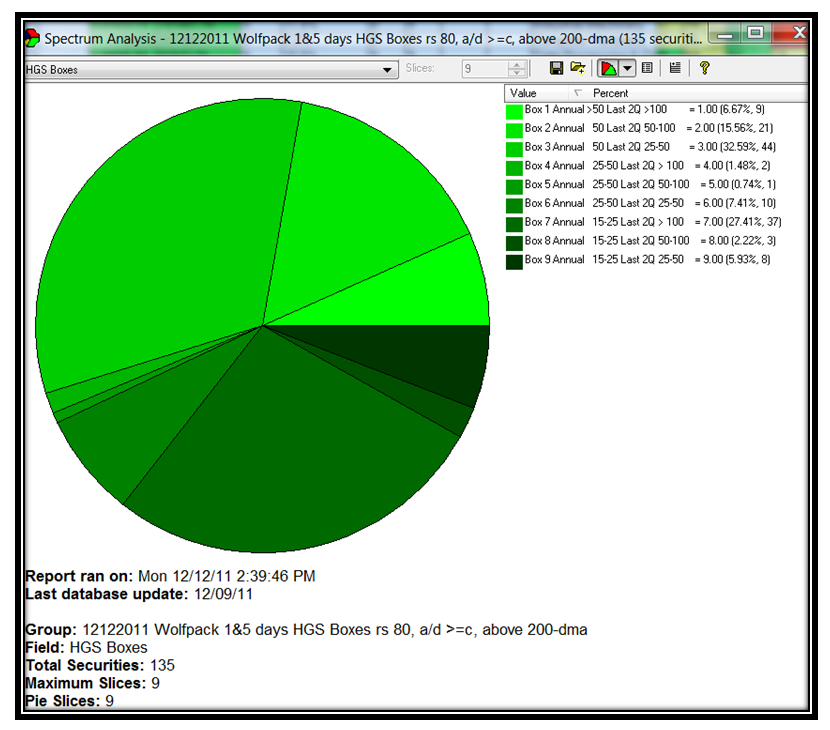
Here is the Pie Chart that provides the ability to ferret further:

If you know how to apply the Group Performance Analysis Tool, then you have manna from heaven as we have demonstrated to you at the seminars we hold.

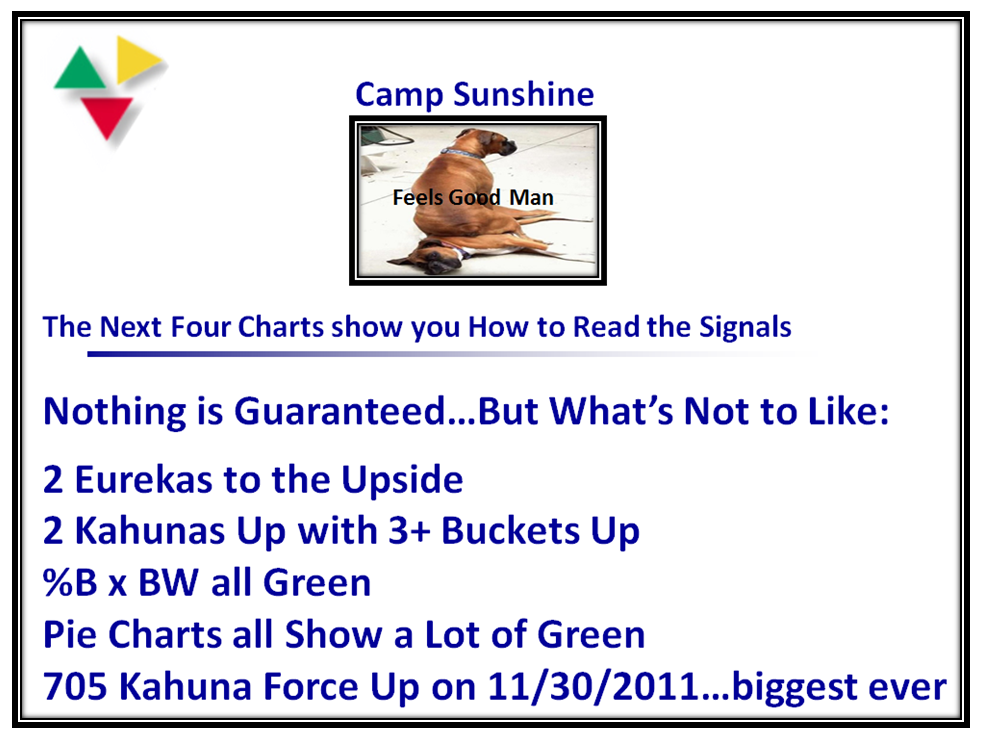
Now for those who are still sceptics, you have heard me many times before tell you the road map to Hog Heaven is two Eurekas and Kahunas in a row, coupled with three buckets up so feast your beady eyes on when we had that signal it was time to get aboard and take the Roadmap to Hog Heaven, or you snooze you lose.  That signal was back on 10/05/2011 which you have faithfully followed if you keep up with my blog notes.  Don’t all shout at once that these stocks did not all have earnings out back two months ago…that’s left as an exercise for you to try your hand at now that you may be convinced there is a pony in here!

From time to time I get a gem of encouragement for the tireless hours I spend at this stuff, hopefully giving back to you what I have learned.  I would like to share with you the comments my good friend Aloha Mike wrote on the bb.

“I have used this method for many years – since we first developed it to use as a measure of risk. We soon discovered that it was a great sorting technique for ferreting out the fast moving/leading stocks.  This was back when we only had the paper and had to do most of the work by hand.  Early 90’s was a great learning and playing experience. Hiding out at Ian’s house and Malaga Cove Library basement we learned much. The new library is nicer, and more technologically driven but never forget the basics.

Much of our old work is still there and valid in the new HGSI and computer driven world. Ian has a large bag of tricks and it just keeps getting bigger and better. Too many people abandon tried and true methods as new ones appear. I try to use the new methods to sharpen the focus of the ancient wisdom.  Old is not dead, discredited, or abandoned – just see the new stuff as a whet stone to sharpen up the old knives.
aloha, mike”
Many warm thanks for your friendship over the years, Ian.

Reading the Tea Leaves with %B x Bandwidth

Saturday, December 3rd, 2011

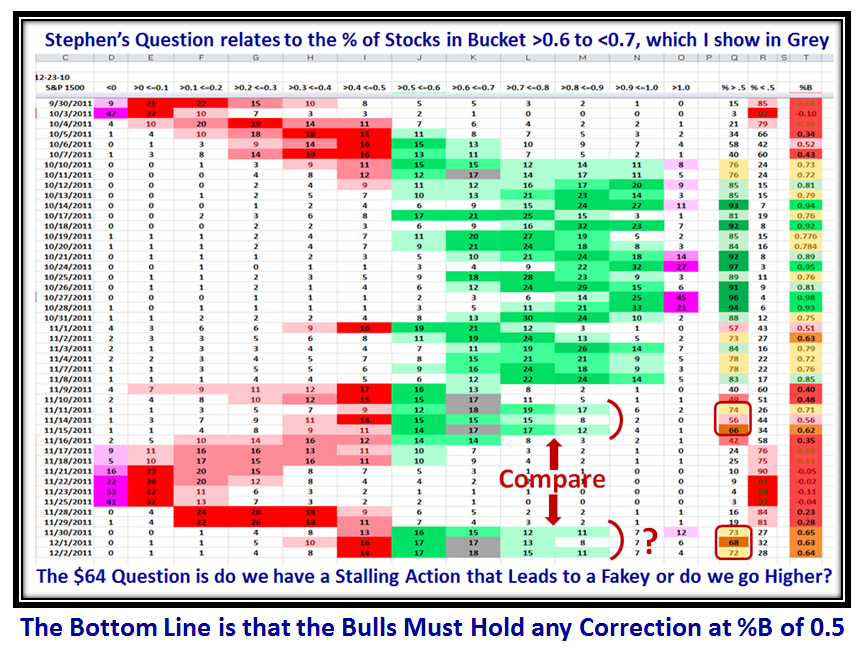
Stephen asks an astute question at a critical point in this Rally:

Ian or anyone,

We have a sea of green on the %B x %B Bandwidth chart. This is good.  Is the fact that the %B chart is showing us a Sweet 16 condition a reason for concern or does the sea of green override this concern?

Stephen

I’m watching the golf while putting this together so I hope that the pictures speak for themselves:

We are at that stage where we are Pausing to Refresh, sitting with an Island Gap below us which is asking to be filled.  The Rally is at a vulnerable point where the promising move so far can turn out to be a Fakey or the Bulls are determined to make this a meaningful Santa Claus Rally:

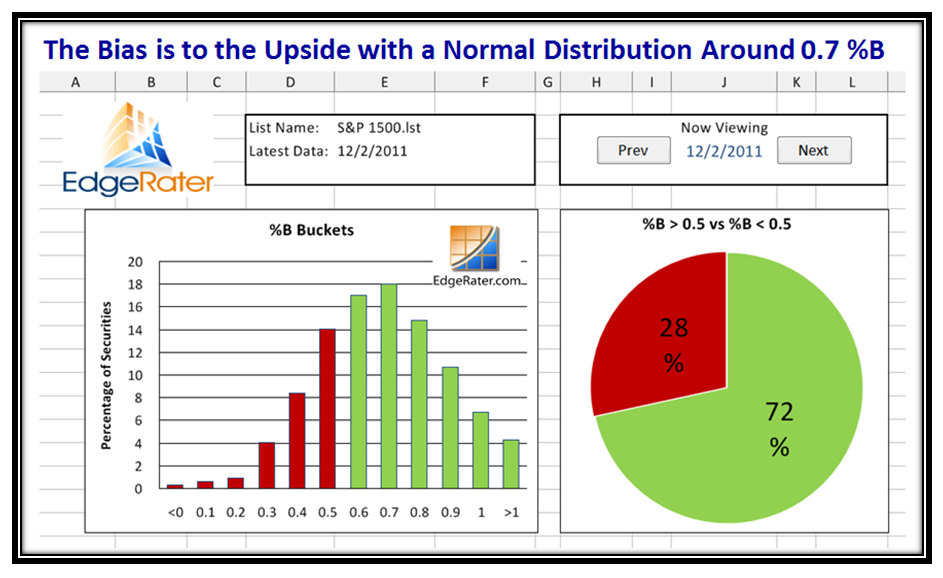
Understand that it is hardly ten days ago that we were in the dumps with 53% of the S&P 1500 Stocks below the Lower BB.  So this rise has been meteoric to say the least, and thereby lies the concern…too far too fast?

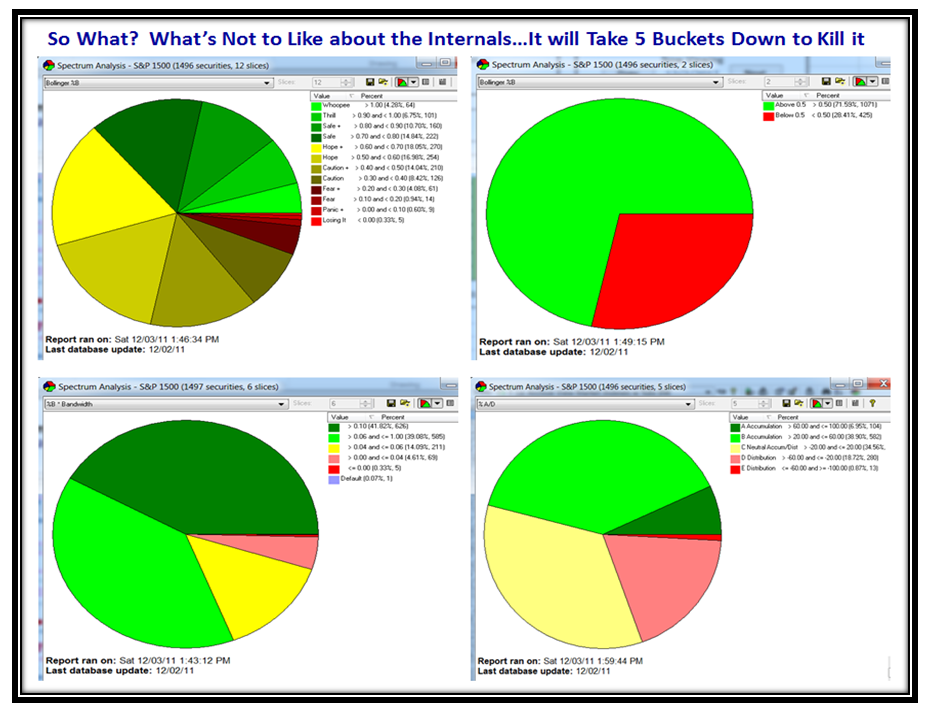
As a result, the internals are all looking rosie:

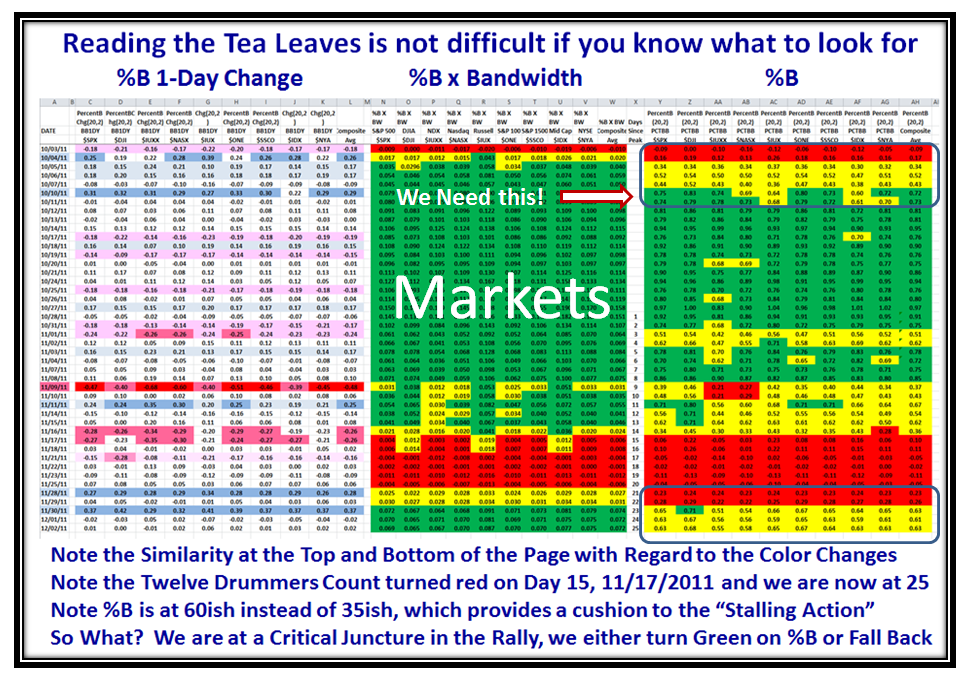
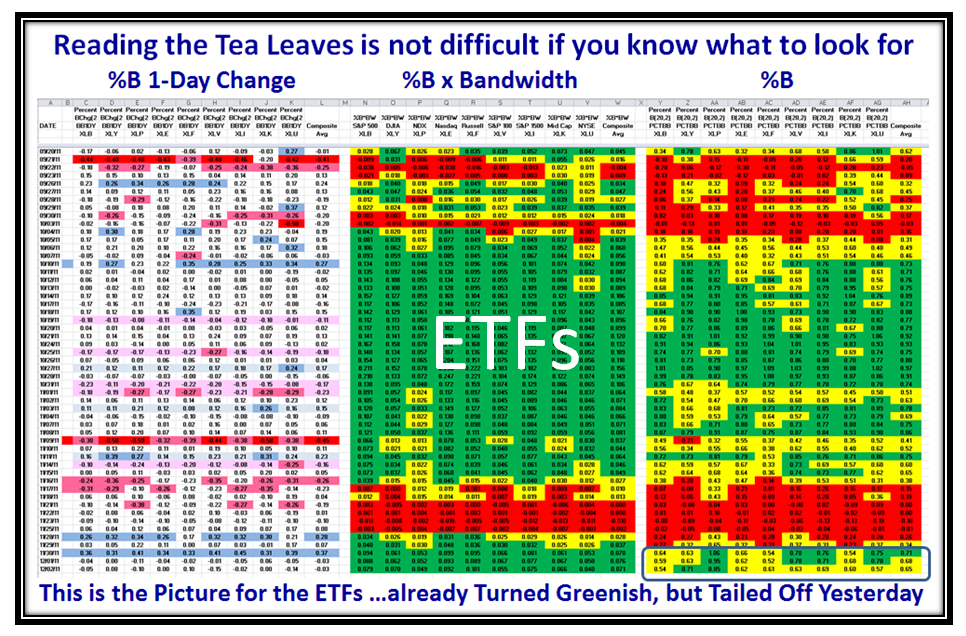
Don’t worry about reading the numbers, just look at the colors and my comments on the next two charts for Markets and ETFs:

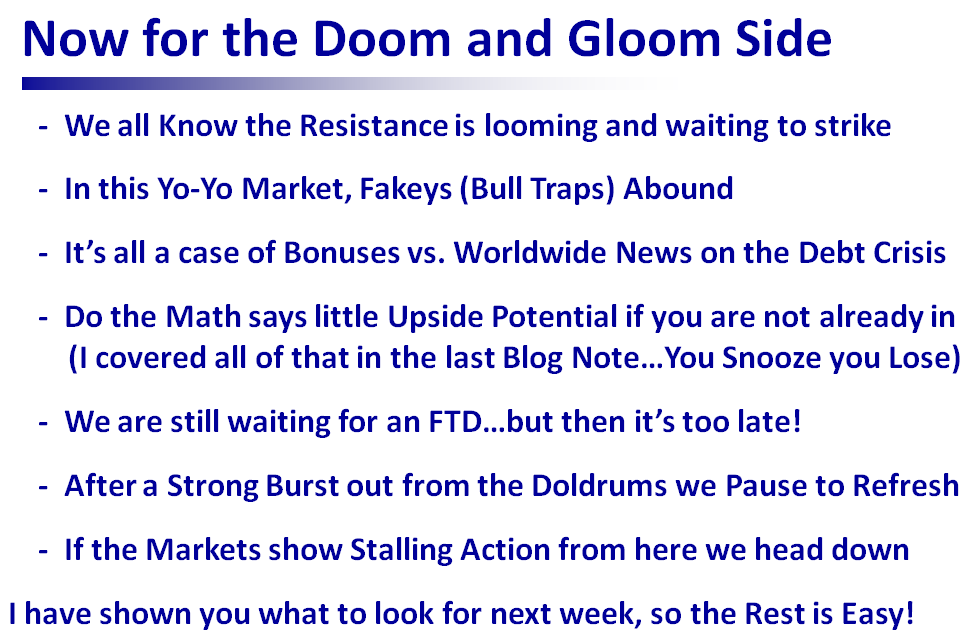
Net-net:  Next week’s action is crucial to deciding whether we continue or have yet another Fakey to contend with.  Now for the Dark Side of the Equation:

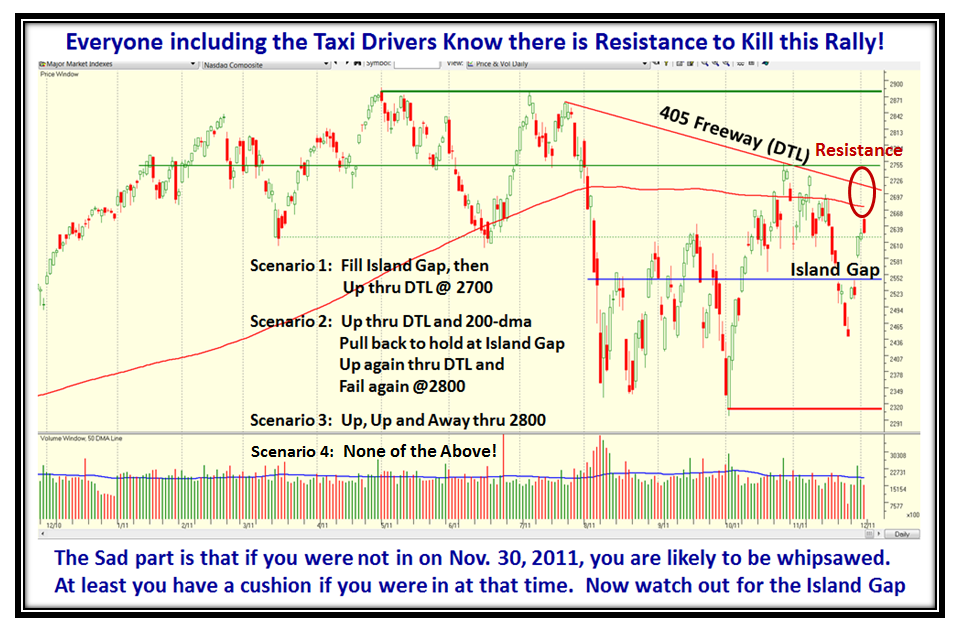
And Finally, Watch for the Island Gap to be filled, or we trot on up to attack the resistance at the 200-dma one more time:

Best Regards, Ian.

The Woody Indicators: Making the Right Moves at the Right Time

Thursday, December 1st, 2011

I am delighted that you folks have seen the value of this latest Woody Indicator, and have already scraped it into Trade Station.  Hopefully in time, you will find more value by having all this handed to you on a Silver Platter in EdgeRater.  You are also aware that the HGSI software will include the %B x BW and %B x BW 1-Dy Chg in its list of factors in the next upgrade which will enable screening, slicing and dicing.  Hopefully we will also see a similar feature to that of %B in the Charting Module so that we can have our cake and eat it without the need for the VFB feature.

Frank asks a couple of questions: 

So Ian, rally should go first and test the 405 on the Nasdaq composite at 2700 and then the peak at 2880?

I’ve programmed %BxBW into Tradestation. Just to make sure >= .03 green <= .01 red, rest yellow?

The answer to your second question is “That’s correct”…until we gain more experience.

 Now for your first question:

1.  The 200-dma is the first and most important hurdle.  The Nasdaq has been turned back three times so far and it should not    be a surprise if it meets the same fate this time.

2.  The News item for tomorrow is the Jobs Report and already the pundits are signaling problems

3.  However if it can hold this weekend then the next hurdle is the 405 Freeway at ~2700 (DTL from Highs)

4.  Let’s assume for a moment that it makes it through that hurdle, then it’s on to 2800, before it gets to 2900

I trust you faithful followers of this Blog realize that I call it like it is so before we get too excited about the Santa Claus Rally, it always pays to assess whether your stomach will allow you to get caught up in the moment.  With that in mind, please understand it is a case of Risk vs. Reward, and only you can decide whether you feel comfortable, especially if you are a Longer Term Investor.  I am sure you also know that as a general rule the biggest gains on a True Rally are made in the first five days or so.

Many of you have understood and watch carefully the 8% down rule, where invariably the markets will hold at that level and go back up ~75% of the time.  Likewise, you also understand by now that once we get below that level, the flood gates open up and there is a mad stampede for the exits.

Likewise, that same strategy can be played to the upside, especially with the Nasdaq which conveniently can be played in steps of 100 points as you have often seen me use at round numbers going up from 2500.  Why, you ask?  100 points up is 4% at a time and Markets tend to find support or resistance at round numbers.  Hence the Fight at the OK Corral and Custer’s Last Stand invariably give you that Heads Up.  Likewise, 12% up is the minimum for what one would call a decent rally, and it all depends on where you choose to get in.  The longer you wait for your pet signals to trigger the more you cut into the cloth of % Gains for that particular Rally.

For the benefit of the Types 3 & 4 Longer Term Players:

5. Now do the Math:

Recent Low = 2441.48

Current Close = 2626.20

% Up = 2626.20/2441.48 = 7.6%

Next level = 2700…%Up = 10.6%

Next level = 2800…% Up = 14.7%

Next level = 2900…% Up = 18.8%

i.e., essentially up ~4% for every 100 Points.

6. The FTD has not yet been triggered… has to be on the 4th through the 9th day.  So, it has already missed 7.6% of the Rally.  Therefore, the very best one can expect = 2700/2650 (say) = 1.9%; 2800/2650 = 5.7%; 2900/2650 = 9.4%.  Even the best number won’t cut it for a Successful Rally, unless we get above 2900!

7.  So What?  Net-net, the best of moves which would be the signal 2-days ago from the Sector ETFs would put us at 2800/2507.72 = 11.66% and 2900/2507.72 = 15.64%, i.e., a “Successful Rally”, but it must get past 2800 first!

8.  If you buy all of that mumbo jumbo (hopefully Good Stuff), this Santa Claus Rally can at best be for Short Term Type 1 and 2 Players only.  But nine-tenths of the world these days are playing double and triple ETFs both ways, and turn on a dime, so that is why the “Woody” Indicator of %B x BW has major appeal along with the well tried and tested Eurekas and Kahunas.  It gets you in sooner, keeps you in longer through Fakeys, and gets you out Faster when the world is rushing for the exits.  However, You Snooze, You Lose!  On the other hand if your stomach can’t take the heat, stay out of the kitchen.

9.  Three Buckets up and five Buckets Down on %B is Manna from Heaven.

10. Don’t expect a Golden Cross (50-dma coming up through the 200-dma) until March 2012 at the earliest, in time for the next HGS Investor Seminar if we are that lucky AND we push up through 2900, which has been the sticking point for 12 years when the Tech Bubble took off into the Ethernet…pun intended!

So What?  This Rally is for Short Term Players, don’texpect miracles, and beware of Fakeys, i.e., Bull Traps!

Best Regards, Ian

Copyright © 2007-2010 Ian Woodward
Disclaimer: Commentaries on this Blog are not to be construed as recommendations to buy or sell the market and/or specific securites. The consumer of the information is responsible for their own investment decisions.