Stock Market: “It’s Jobs, Jobs, Jobs, Stupid”
I am sure you remember the slogan back in the President Clinton era of “It’s the Economy Stupid”. Sad to say we are back in the mire with a twist to “It’s Jobs, Jobs, Jobs, Stupid” and I will show you why the Stock Market is beating to that drum!
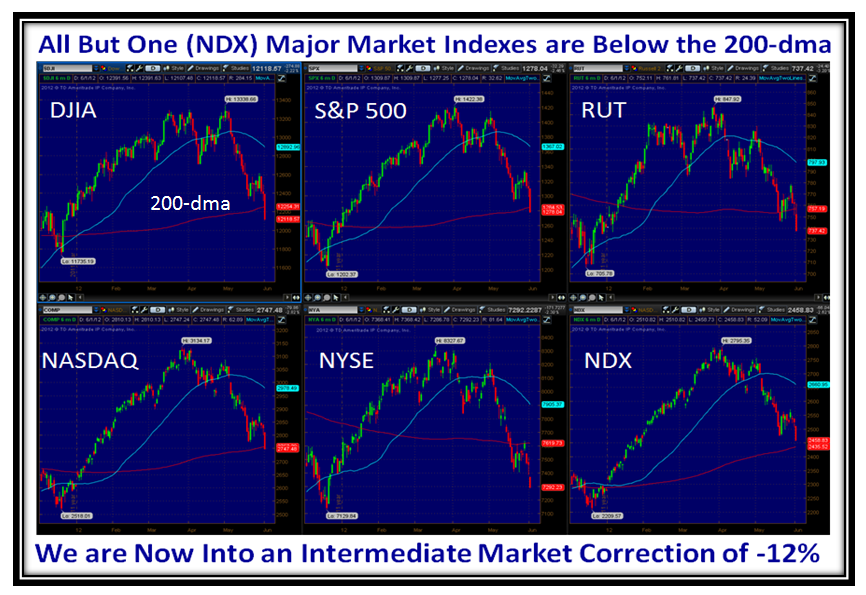
Slowly but surely the Bears have eaten away at the precious cushion we had by bursting through the twelve year barrier of 2900 on the Nasdaq and peaking at 3134 back on the week of March 26, 2012. Seminar attendees will recall that was the last day of a fruitful learning experience where we developed a list of Leaders that would potentially give us an early warning of a peak in the market. They are now believers as it happened that very week! My friends Kevin and Robert from Qatar and Switzerland will know that from when they attended previous seminars that drove that point home…Well this Market has Nasal Catarrh from the drip-drip process:
The chart above speaks for itself as we can now see the drip-drip process we have endured each month at the beginning of the month when the US Jobs Report comes out, and that is the theme for this Blog. With only the NDX hanging on by a thread we are now in an Intermediate Correction of -12% down from the highs of March.
The floodgates, Price-wise but not Volume as yet, opened wide on Friday with the miserable Jobs Report, and all signs point to a follow through on Monday with hopefully a fully oversold situation and then a Bounce Play. At times like these, it pays to look at a Long Term Weekly Chart to see where long-term support might be:
We find that by using a Long Term Trend-line from the Low of March 2009 that support is at 2600, which is comparable to the drops in Flash Crash and Debt Crisis of ~-17%. Heaven help us if we trot down to Black Swan proportions. My motto is to never jump too far ahead…have three scenarios, never fall in love with one, and always let the Market tell you which one it is on. However, one must evaluate the underlying clues for Fear and Greed so that one knows when to run for cover depending on your stomach, not mine. They are different.
Let’s now look at the Underlying Clues to establish the theme we are Marching to…Jobs, Jobs, Jobs!
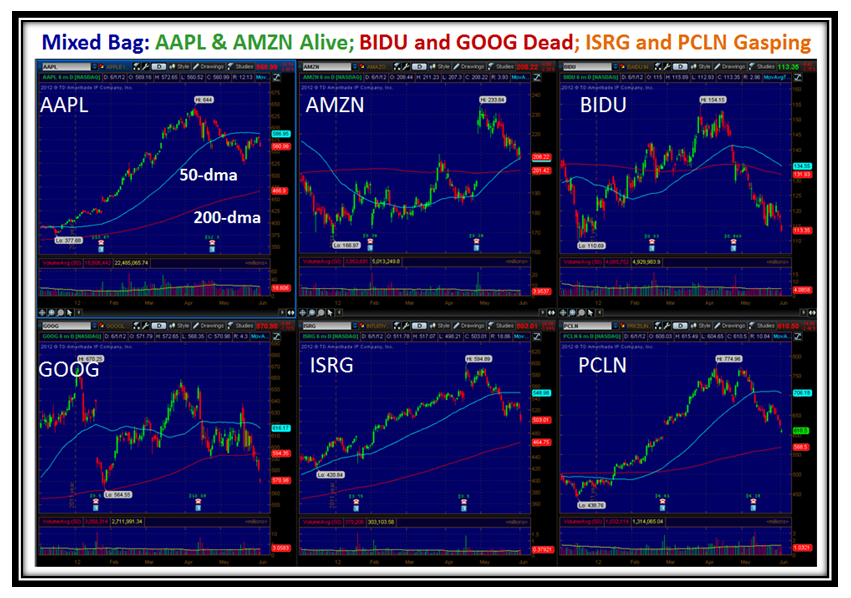
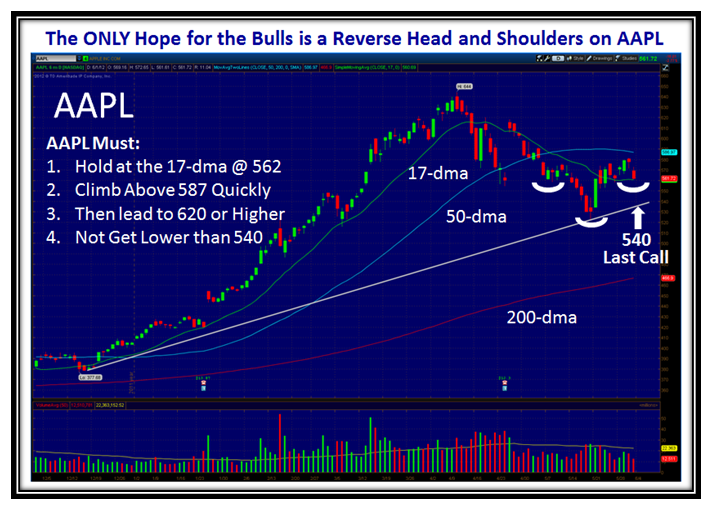
Pretty miserable. There comes a time when the Market falls of its own weight, and although the Surrogate for the Market is AAPL, that slogan has now got a trifle stale, unless there is some miracle of GOOD and FRESH News to prop the entire market up, not just AAPL. But for my friend Becky who is an avid AAPL follower and promised me her first million when she made her third which she is working on, here are the “Must Have’s”:
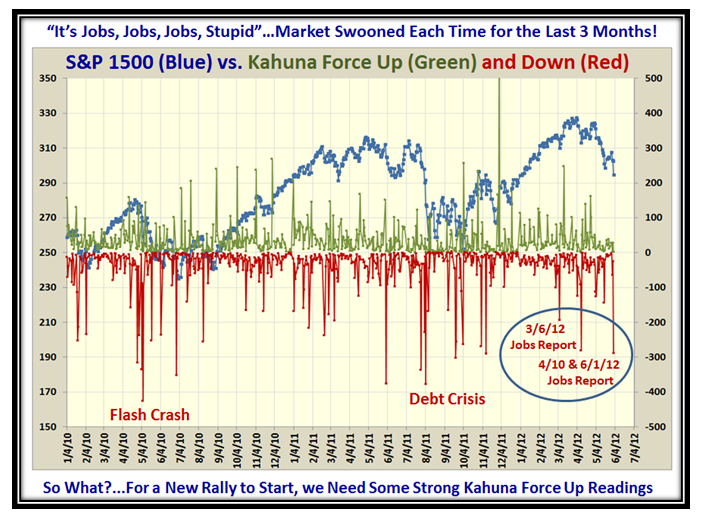
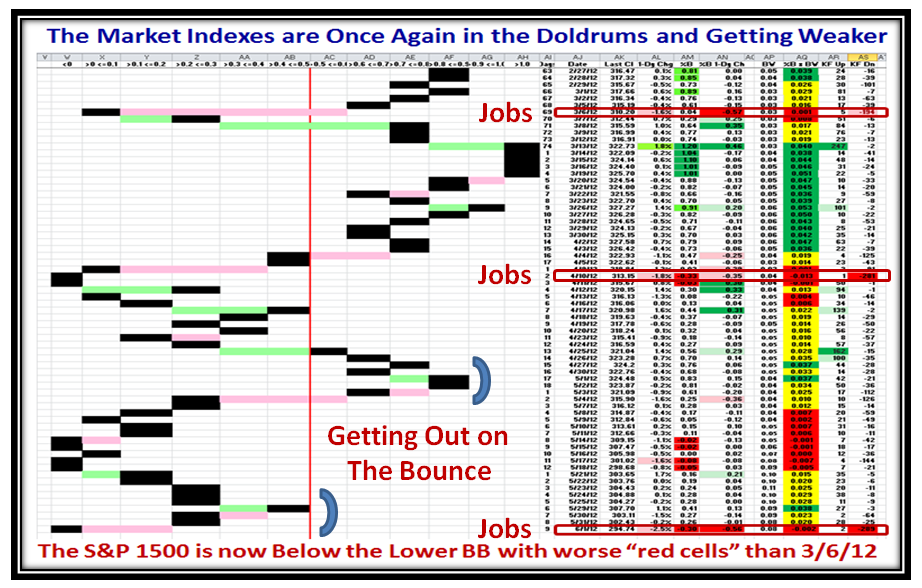
Now for those “Underlying Clues of Fear and Greed”, I will show you that the first week of the month is the most important and it is the day that the US Jobs Report comes out. The next four charts demonstrate the underlying theme of the grip the Market is in with the Monthly Jobs Report. You short term intra-day type 1’s might make a note of this winky-winky:
That’s a new chart where my good friend and Partner Ron Brown and I are joined at the hip with a Dash of Bollinger and Elder to lean on. You oldies know that our whole concept is to measure Fear and Greed through Impulse Indicators. The stronger the signal the more the meaning. Well, with my good friend Chris White of EdgeRater fame, I have the tools to measure the extent of Fear and Greed through using the Kahuna Force Indicator which Ron and I have developed. What we see on the chart above is Kahuna Force Up signals in Green and conversely KF Down signals in Red plotted against the S&P 1500.
The readings are daily KF Up and Down, respectively, and it doesn’t take one two minutes to see the most recent big “down counts” were on Jobs Report Days! A reading of -300 (say) means that 20% of the S&P 1500 had a major down day. This past Friday was ugly. Compare the readings now to Flash Crash and Debt Crisis and you can see that until we see similar signals to the upside indicating strength, we will wallow around in the mire.
Here is an oldie you haven’t seen for sometime. It shows the same situation:
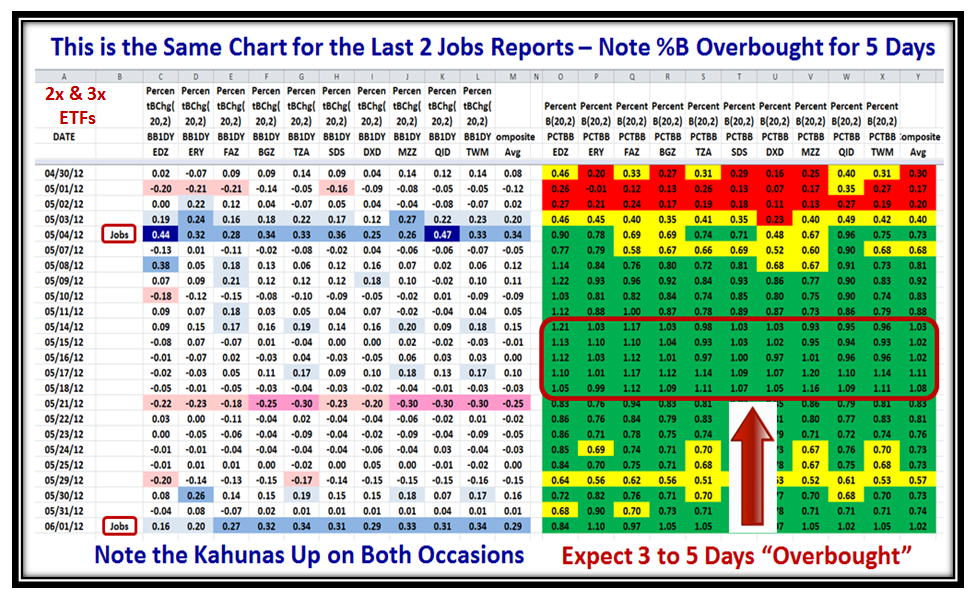
Now here is a new idea and picture. It uses the 2x and 3x BEAR ETFs to show how things have changed between the intervals of the Monthly Jobs Reports. Since this is a chart for the BEAR ETFs the colors are topsy-turvy. When the colors are Red, the BULLS are in control and when they are Green the Bears have it. Don’t worry about the numbers…it is the impression you get with the colors that make the point. We have gone from Bulls in Control to Bears in Full Control:
A picture of the 2x and 3x BULL ETFs produces the reverse picture and both should be watched for the quickest clue that change is in the wind. Now for those who are numbers oriented, here is a closer view of the last two Jobs reports and this picture gives one a further clue. Once the BEAR ETFs are essentially all above the Upper Bollinger Band, it takes 3 to 5 days for the euphoria to wear off to the downside, so watch for this affect this time around. The symbols for the ETFs I used are shown at the top of this next chart:
Please note that we now have 31% of the S&P 1500 Stocks in %B Bucket <0 and we are Oversold to say the least:
The rest is up to you depending on your stomach: Foxhole, Short, Dabble, but wait for the QUALITY of the Bounce if you are already out, using these concepts to stay on the right side of the Market. Don’t forget we need Eurekas and Kahunas to the upside. No excuse now after my last blog note of a Glossary of Terms used.
I haven’t heard from Akiva in Israel of late, but I am sure he is lurking in the wings. Many thanks to all the US Followers who gave me words of encouragement who appreciate this “Good Stuff”, which I write while watching Tiger try to find his old winning form.
Best Regards,
Ian.
 Ian Woodward's Investing Blog
