Ian Woodward's Investing Blog

Archive for January, 2013

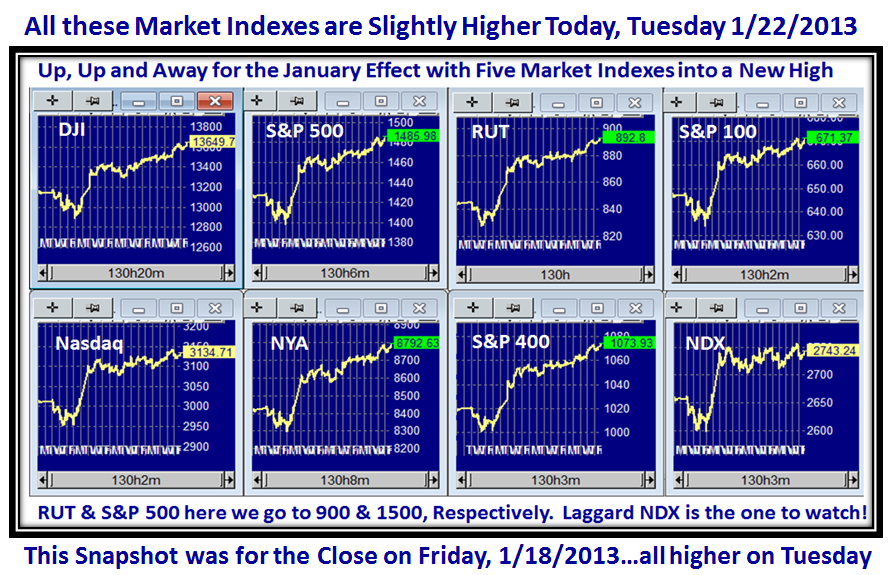
How High the Moon…Follow Up

Sunday, January 27th, 2013

Thanks to those who gave me comments, including Charlie who is looking for a Winky Winky handed to him on a Platter.  Charlie Wrote:

Charlie Willey Says: January 27th, 2013 at 6:43 am   edit

Ian – Thanks for the multiple scenarios you send along with your discussions.  You provide much stimulus for thought on this end.  Still, you stay ahead of me.  But I know to look for the little ‘winky-winkies’ along the way and sooner or later I say, “There’s one, oh, and there’s another.”

– Charlie Willey

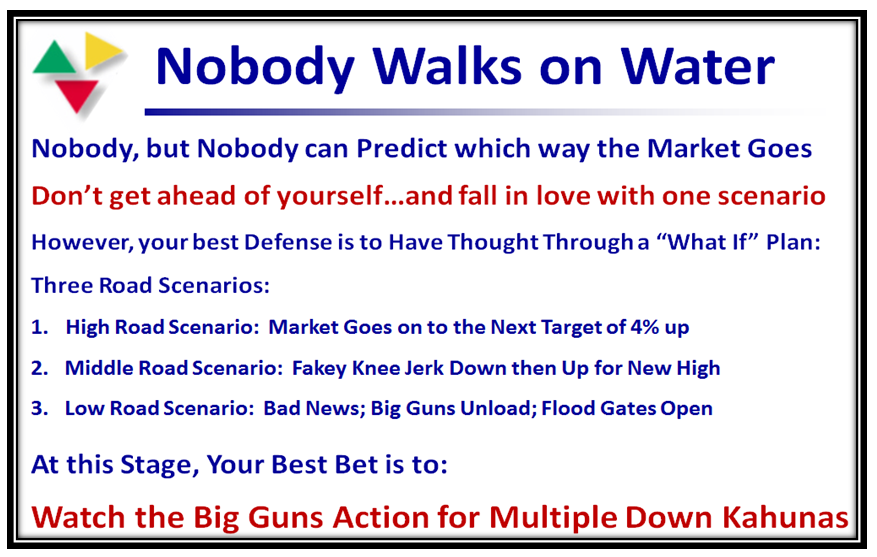
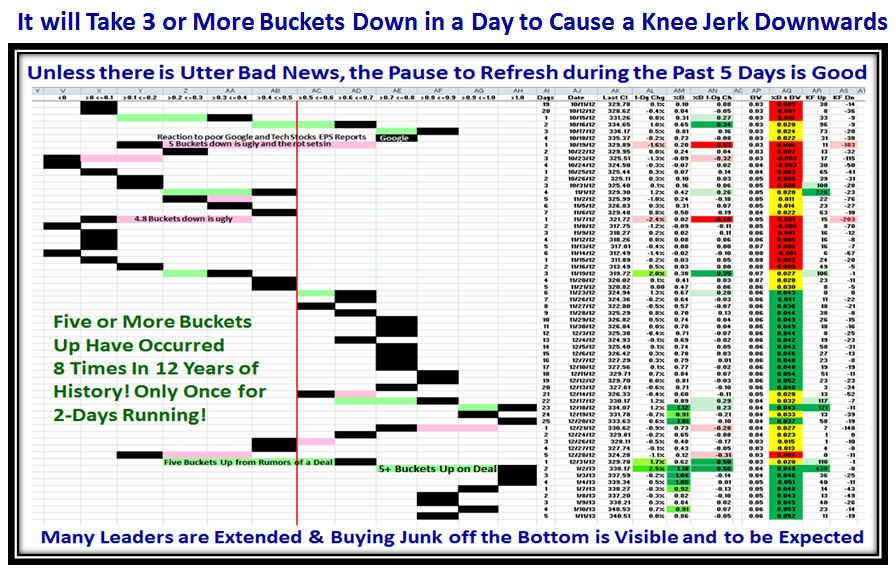
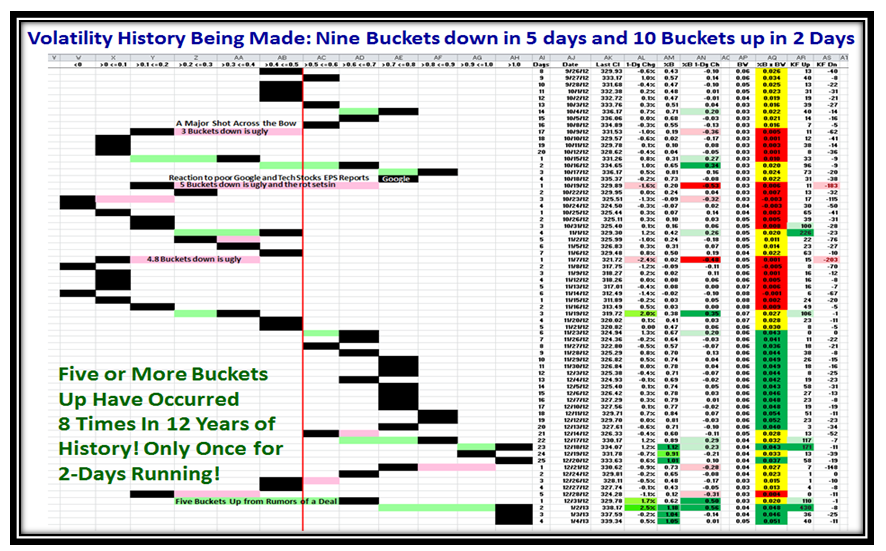
Charlie, I gave it right there for you to decipher, but the question for you is “Do you have the stomach to watch the Markets all trot down five buckets and you are prepared to sit and wait one more day?”  Now it’s a case of your stomach, and only you can know that.  Sad to say that you must wait one more day to know whether History Repeats itself for the 3rd. Year in a row or this time on the day after the Indexes all head down 5 buckets (say), it goes down further.  Don’t curse at me and say “Coulda, shoulda, woulda” old buddy.  So the choices are simple:

1.  If you have a weak stomach and want to preserve capital even if it is a Fakey, you take it OFF during that very bad day or

2. You say, no I will give it only one more morning to see if the markets bounce back that next day:

a. If they bounce up one bucket, you stay to watch the next day and with luck you breathe a sigh of relief and the market hops back up one bucket and then four buckets as it did in both 2011 and 2012 and you have not been faked out, or

b.  It continues to trot on down and you know this is no Fakey, and you better run for the hills or turn to shorting.

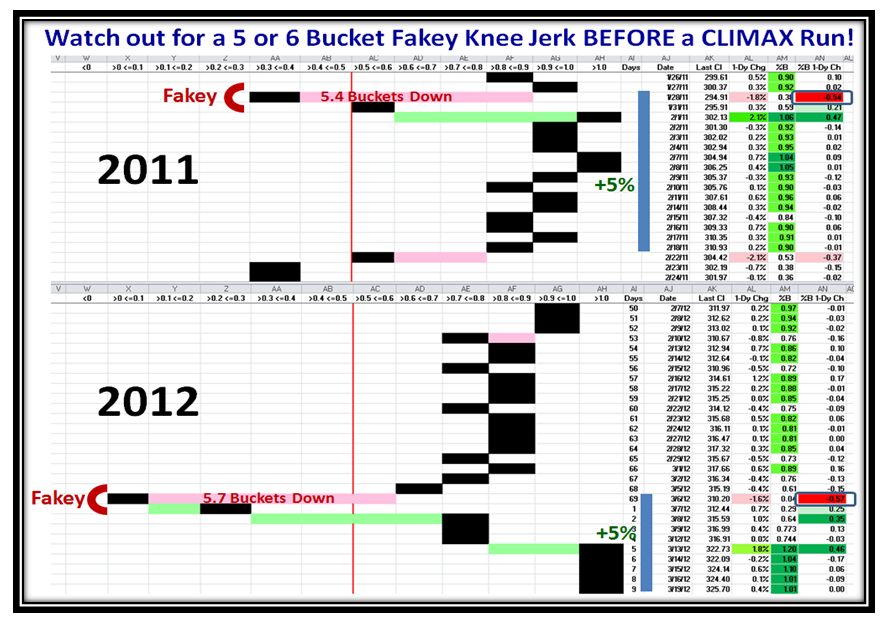
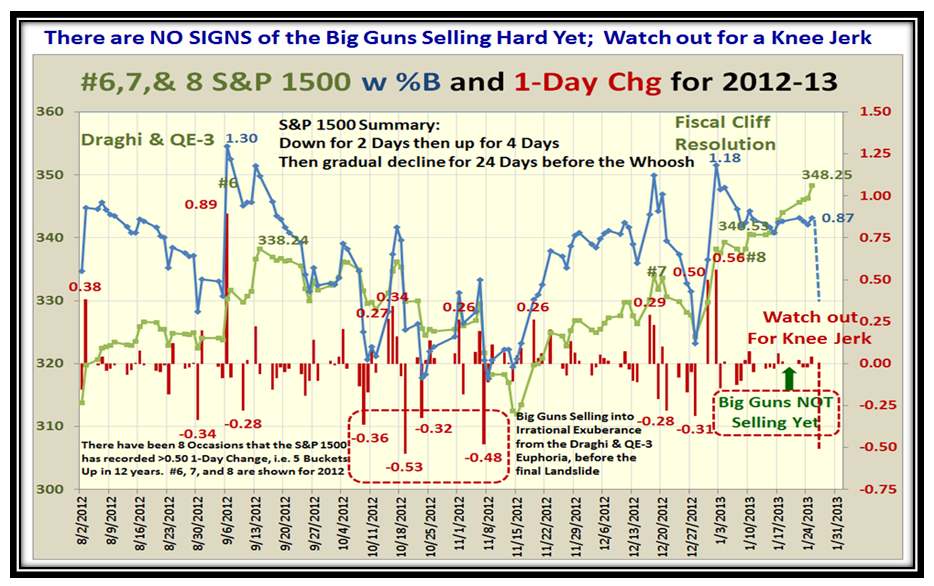
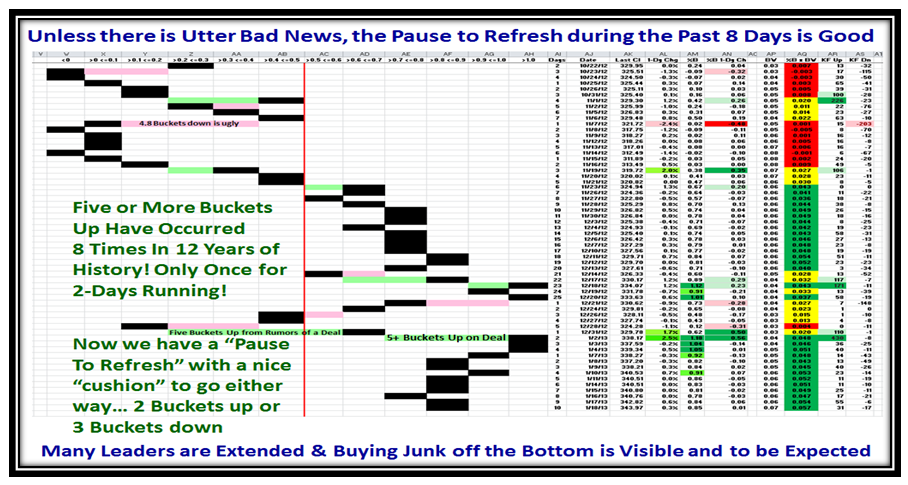
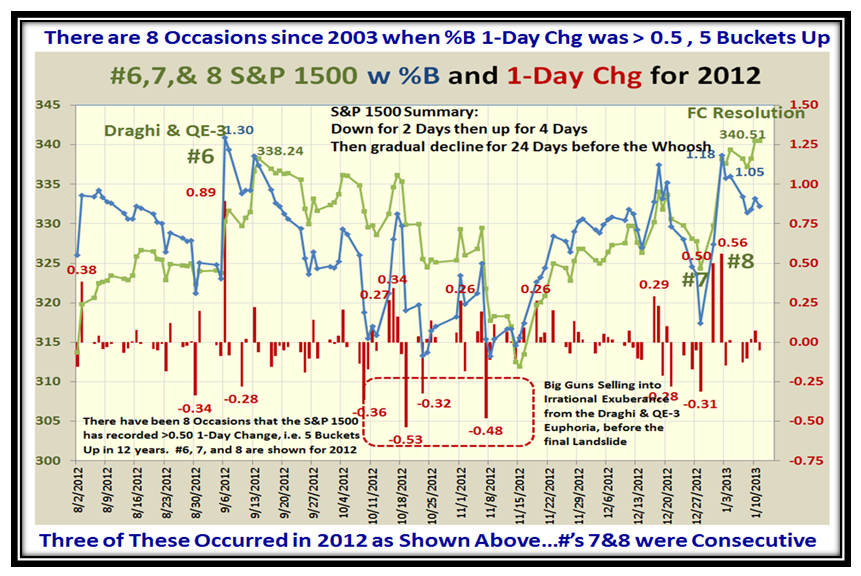
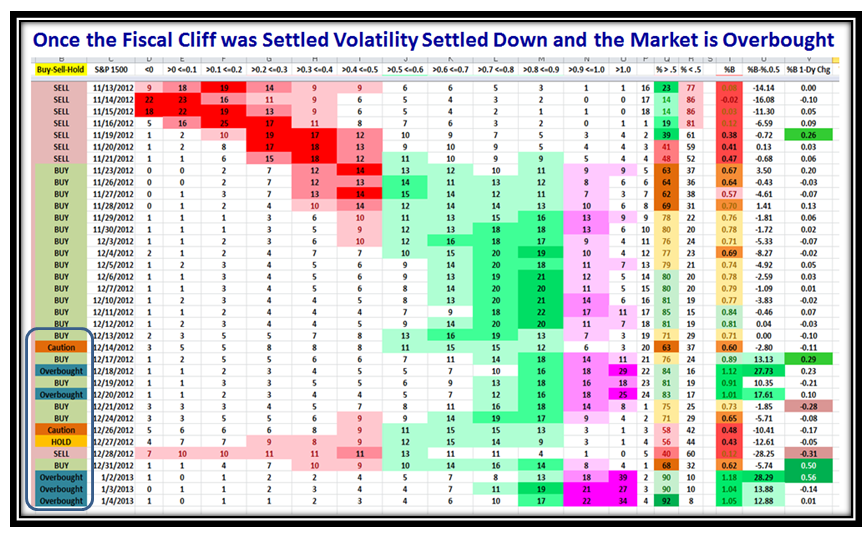
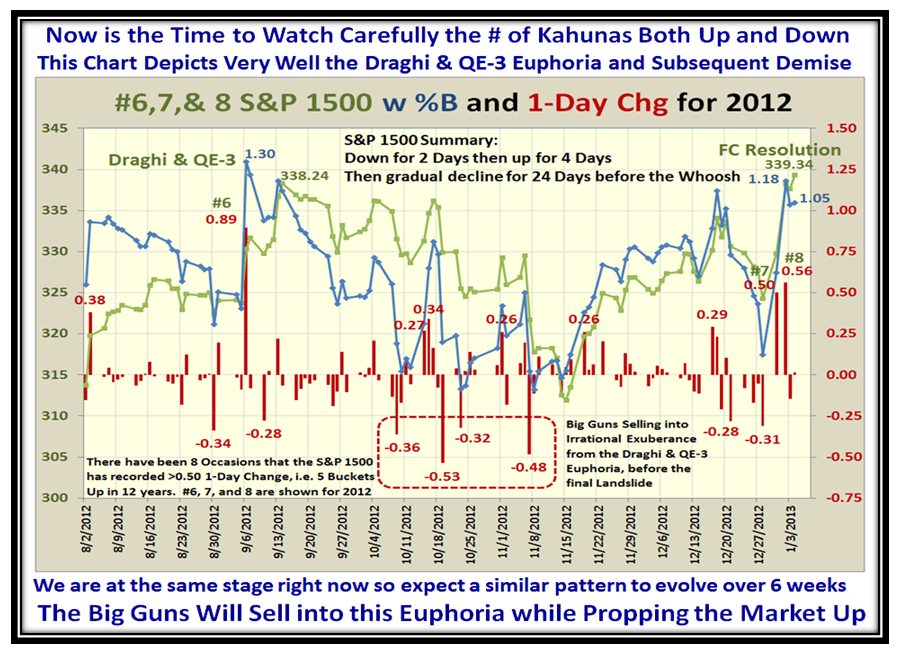
Now you are saying “Come on Ian, where on earth did you conjure up that Winky-Winky?” and I say sometimes I want you do some homework, because in this case we are talking about stomachs and NOT MARKETS and I have drummed it into your heads “Every stomach is different”…and that is what the Big Guns prey on!  Just stare at this chart and you will see the tea leaves tell you what I have just told you:

Moon Pat 2b

I’m sorry I didn’t paint the upper bounce green for the next day after the big 5 bucket drop in 2011, but you can see that in both cases they bounced UP one bucket and then a hefty 4 Buckets the following day.  Coincidence you say,  I say fine, but that is all I need for a clue.   It’s called Reading the Tea Leafs as well as enjoying the tea…the bigger picture related to Fear and Greed.

Now Charlie, I am still waiting for that 3rd. Million, and sad to say no one has sent me that yet!  They all say they are still working on that 2nd Million for their wife!

Best of luck,

Ian.

Stock Market: How High the Moon? Game Plan

Saturday, January 26th, 2013

Having achieved the recent Targets of 1500 on the S&P 500 and 900 on the Russell 2000 (RUT), the question on all our minds is “Now What?”  I hope the picture below hits a chord with you as we try to make sense of where the Stock Market is headed:

Moon Picture

Here is the latest picture of how the Market Indexes keep heading up into new highs, week after week, slowly but surely:

Moon Indexes

It is interesting that while the Indexes have inched up the %B is stuck in 2nd gear but healthy at between 0.8 to 0.9 for all of two weeks.  That gives us some comfort in that we have a cushion for even a five bucket knee jerk but still have room to trot up:

Moon Pat 2

The unusual pattern these last two weeks led me to look back to 2011 and 2012 at around this time of the year, and I may have struck oil.  Not only did I find a similar pattern, but also noticed that on both occasions we had a Five Bucket Knee Jerk down that turned out to be a Fakey of just a day or two before the Market shot back up to go on to new highs!  I know the old swan song that History seldom repeats itself, but at least it has become one of the Three Road Scenarios I will leave you with and in my usual manner I borrow “snippets from the past” to put on the present to show you what might happen should this phenomenon occur  for the 3rd year in a row.  I am not suggesting it is the expected scenario, but my point is to not be too quick to count your chickens that the market is headed down.

Moon Pat 2b

Please also note the similarity of heading back up to the tune of a 5% Gain in the Index Price after the Fakey, which happens to be approximately what one would look for to reach the next level of targets which my work on the High Jump will show you.

When things reach such peakiness, I ALWAYS turn to my trusty High Jump Tool to guide me of what are REASONABLE Targets, particularly for the Market Indexes.  In the following chart I have developed Past Higher and Highest results for the 200-dma to the price of the Indexes, and then applied these to the Current Last close as shown in the Middle Column to get the Higher and Highest Targets going forward.  Whether this unfolds this way is in the lap of the gods, but at least it sets reasonable goals of when enough is enough for you to think about running for the hills or shorting the Market:

Moon Game Plan

I hope by now with all the signals you have come to understand and enjoy about %B and 1-Day Change that you feel we have a warning system when unusual activity leads to big bucket skips.  Likewise, when things are calm that is a MAJOR clue that the Big Guns are not selling into this overbought rally with any fervour as yet.  Now that I have indicated the possibilty of a Knee Jerk look over to the right hand side of the next chart for what one should expect to see.  More importantly as I have hammered home previously, we need to see several Kahunas in quick succession before we know that the Wall Street Gurus have done their propping up while quietly selling into it and are now ready to bring down the hammer and open up the floodgates as the herd gets panicked into selling en masse.

Moon Big Guns

I wind up this blog with the three Road Scenarios, but before I do,  I have chosen to kill several birds with one stone by choosing what I have called the Middle Road Scenario to show what the results might look like with a Knee Jerk Fakey before either the S&P 1500 or Russell 2000 (RUT) recover to seek the higher range of targets I set forth earlier.  Enjoy:

Moon S&P 1500

Moon RUT

In my scheme of things, I always develop three scenarios so that I am not caught off guard.  I know many of you who have attended our HGSI seminars have incorporated that concept into their daily business in addition to their investing habits.  They have also learned to never fall in love with one scenario too far in advance, but to let the Market tell you which one it is on, so as a wind up to this review, here is that chart:

Moon roads

Thank you to those who took the time to give me some feedback and comments; it makes it all worthwhile to hear from you.  By the way, if you haven’t learnt the trick of clicking on any of these charts to make them bigger, shame on you.  Then you can use snagit to capture a copy for your files to review at your leisure.  I strongly suggest you do so with the High Jump Chart showing the targets and keep it by your elbow at your desk!

Best Regards,

Ian.

Stock Market: Up a Lazy River, but be Alert

Tuesday, January 22nd, 2013

Now that the Inauguration is over, the Markets are back in business and still climbing a wall of fear, but except for the obvious Overbought situation, there are still no signs of a Break to the downside.  Blue Skies up above, but watch out for the Dark Clouds to roll in:

Blue PIcture

I am writing this Blog Note on Tuesday Morning at over half way through the session, and the Markets are all positive as I write:

Blue Indexes

We are still on Target to hit 900 on the RUT as I suggested a few days ago and we are within 3 points of that target as I write:

Blue RUT

The VIX is alarmingly “Quiet”!  This could be the start of something big with a long run to come or just waiting for some bad news to shoot it back up above 20ish…we will just have to wait and see, but for now this too provides us a nice cushion in which to act should we have to run for the hills, or turn to shorting the market:

Blue VIX

…And here is the snapshot of the Bucket Brigade which also shows we can go either way, and have a cushion for the downside:

Blue Pat 2

As we would expect, the A+B vs D+E snapshot shows we are getting to the point of exhaustion to the upside, and we have been on Alert for some time now, but now things are curling over:

Blue acc

Watch for the big guns to sell into this rally at some point in time, and the best alarm is at least a 2% down day in the Market Indexes coupled with 5 Buckets down, and then succeeding Kahuna alerts to the downside as I previously showed you in the picture for #7 & #8 successive 5 Bucket up days at the start of the New Year.

Good Hunting,

Ian.

Stock Market: January Effect Came in with a Bang, but Now What?

Sunday, January 13th, 2013

My New Year’s Blog set the stage for the Euphoria of the January Effect spurred on by a settlement of the Fiscal Cliff just in time to avoid pain.  Let me remind you that January Effects can indeed last well into March, but of course there are invariably pull backs along the way.  The question at this stage is how much and when, so let me portray the upside and the downside for the next couple of weeks.

January Picture

My signature chart of the eight Market Indexes show that we are into New High Territory for the likes of the S&P 500 and Russell 2000 (RUT), but there has inevitably been a stalling action or more appropriately a “Pause to Refresh” and here is that picture:

January Indexes

So let’s dig deeper and take a look at the RUT, and we see that it shot up and as I suggested was headed for 900, but it paused to refresh this past week and that is only to be expected after such an Irrational Exuberance move the previous week.

January RUT

Let me remind you that ten buckets up in two days in a row is not to be taken lightly, and its effect was to drive the underlying parameters of the Market such as the Accumulation/Distribution Ratio to new highs not seen since this time last year, as we will see in this next chart:

January abcde

But now we must look deeper and focus on the relationships of A, B and A+B as shown in this next chart.  As I show, this past week we have seen a falling off of stocks with A Accumulation of 628 stocks though an increase of 777 stocks into B which gave a small net increase to A+B.  The Total of 4536 stocks in A+B is the second highest in the three years shown, so it is still inching up:

January ab and

But that is not enough…let’s look at the History with regard to the Ratio of A+B:D+E to see if we can glean where we stand and what to be careful about before we draw general conclusions.  As I point out on the chart, be careful you don’t get Faked out and miss additional upside moves as has happened twice in the last three years:

January ratios

It is noteworthy that the two Fakey’s both occurred at the January through March timeframe, so watch carefully and don’t jump to conclusions too fast.  So how do we find clues as to which way the wind is blowing?  I gave you that last week and that is to watch how the Big Guns may be selling into this situation as we follow their actions with Down Kahunas.  It is a trifle early to say, but note how the drop in %B has not as yet been matched with Big Down Kahunas, although the S&P 1500 has bounced back to 340.51.  It is far too early to tell but I have yet a further trick up my sleeve for you  to keep you on the right side of Greed in the Market:

January 678

…And now for Late Breaking News.  With the help of my good friend Bob Meagher, here is a summary of the History over the past ten years for when the Market had Five Bucket rises or more in one day, thereby showing excessive exuberance:

January 5 Bucket Stats

To wind this up here is the usual picture you look forward to, and you can readily see we have room to go either way, but be thankful for small mercies that we still have a cushion before a landslide sets in unless we hit something ominous like 3 or more Buckets down in a day!

January Pat

…And that’s my Story for Today!  I always have a few faithful followers who regularly drop me a line of encouragement and I am grateful for that.  However, I am amazed at how we have a laize faire approach to writing a line of thanks with this Internet media.  That’s life!  When I am gone I hope you will miss me, but then it will be too late.

Best Regards,

Ian.

Stock Market: Remember Draghi & QE-3 Euphoria?

Saturday, January 5th, 2013

I am sure you recall the Irrational Exuberance of a couple of months ago when the Draghi Plan and QE-3 came out a week apart and the Market shot up only to then start the steady decline while the Big Guns propped the Market up long enough to pull you in while selling into it.  We are at that same stage now that the Fiscal Cliff fiasco has been temporarily fixed as they kicked the can down the road a couple of months before we have the next fru-frau.

So in the short term enjoy the remainder of the January Effect, but then look for similarities to the last chart in this blog note which I have developed to keep you on your toes.  I see Italy and India have recently gone “gaga” on this good stuff so my thanks to them for their support along with all the other faithfuls:

Sinatra Picture

As you can see from the Market Indexes Charts they are all up, up and away above the resistance lines with some of them into new High Territory…notably the Small Cap Russell 2000 as I predicted previously:

Sinatra Indexes

As you would now come to expect, we got the usual Eureka and Kahuna signals to suggest the Rally was on, but we have an Island Gap in the Nasdaq Composite.  The bias is up, but watch for a slight pull back to close that gap before we see a continuation of this powerful rally.  Alternatively, should the rally continue straight up from here then watch for that spot to be filled on the first retrenchment when there is a correction:

Sinatra Nasdaq

We had the expected knee jerk in the VIX while there was the possibilty that there would not be a settlement in the Fiscal Cliff mumbo jumbo, but now the VIX has dropped to below the 14 mark  and quietness abounds implying no fear for the moment…only greed!

Sinatra VIX

Just to give you perspective on the VIX, here is the picture going back several years and we now watch for whether this is the start of something big in that the VIX should stay below 14 for some time to come (wishful thinking) or once this recent euphoria is over we trot back up to stay on our toes to be on the right side of the Market between Fear and Greed:

Sinatra VIX2

Needless to say that Grandma’s Pies shot up to overbought and invariably within 6 to 8 days of euphoria we should see the decline start to set in.

Sinatra Pies

Shorts were covering feverishly these last few days which took us from nine buckets down in 5 days to 10+ Buckets up in 2 Days, where we have remained in Overbought territory for the last three days:

Sinatra Pat

…And here is it’s twin picture, thanks to Pat Turner who developed these basic concepts many moons ago:

Sinatra Pat2

Accumulation A+B took off like a rocket and all it needs is one more push to reach the peak of a year ago:

Sinatra Acc

Always remember to watch the Small Cap Russell 2000 (RUT) Index for the January Effect and it is in New High Territory.  The Target is for it to reach the round number of 900, and that is possible given that %B x BW though up is not yet to the moon:

Sinatra RUT

…And to cap all of this euphoria off, here is the proof this was no ordinary rally:

Sinatra Bucket 1

Now you know precisely where you stand on the ladder between Fear and Greed, but let me give you the New Year’s Present I have for you to show you precisely what to watch for in the coming weeks based on what transpired at a similar stage of Greed with the Draghi + QE-3 announcements a couple of months ago.  They say History never repeats itself, but it usually does “Close Enough for Government Work”.

Sinatra 1 Day Chg

I know there is a lot to digest in this chart, but click on it which will enlarge it.  Then make a copy of it and watch it like a hawk.  The SINGLE Key Item to watch for is the Number of Kahunas to the downside interspersed with those to the upside (shown in the dotted red area) which will give you a clue as to when the Big Guns are pulling you in while they sell into the rally and then when they have got you committed, they will drop the market like a lead balloon!

Best Wishes for a Happy New Year comes with this present to you and may all your bets be winners.

Give us some feedback in the Comments at the bottom of the note!  It only takes a minute.

Ian

Copyright © 2007-2010 Ian Woodward
Disclaimer: Commentaries on this Blog are not to be construed as recommendations to buy or sell the market and/or specific securites. The consumer of the information is responsible for their own investment decisions.