 Ian Woodward's Investing Blog
Stock Market: January Effect Came in with a Bang, but Now What?
My New Year’s Blog set the stage for the Euphoria of the January Effect spurred on by a settlement of the Fiscal Cliff just in time to avoid pain. Let me remind you that January Effects can indeed last well into March, but of course there are invariably pull backs along the way. The question at this stage is how much and when, so let me portray the upside and the downside for the next couple of weeks.

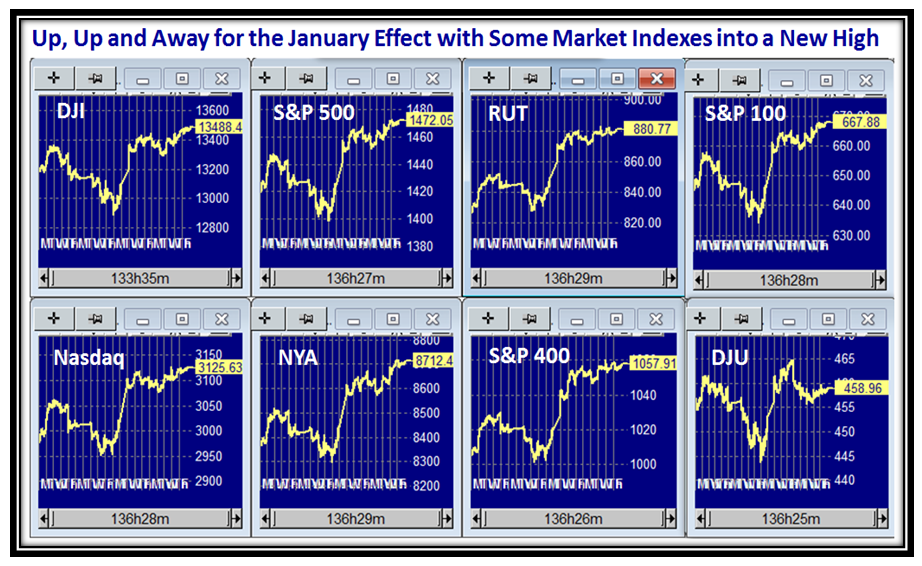
My signature chart of the eight Market Indexes show that we are into New High Territory for the likes of the S&P 500 and Russell 2000 (RUT), but there has inevitably been a stalling action or more appropriately a “Pause to Refresh” and here is that picture:
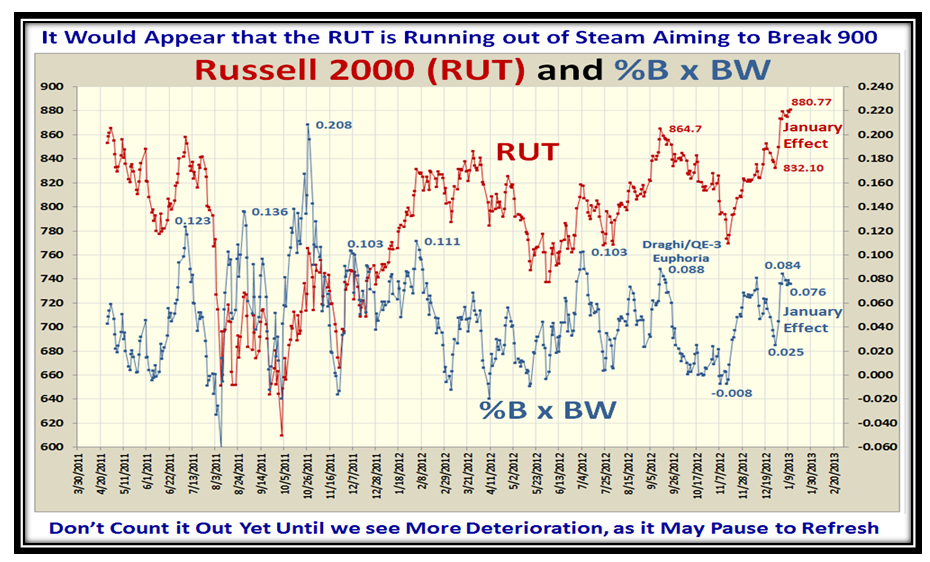
So let’s dig deeper and take a look at the RUT, and we see that it shot up and as I suggested was headed for 900, but it paused to refresh this past week and that is only to be expected after such an Irrational Exuberance move the previous week.
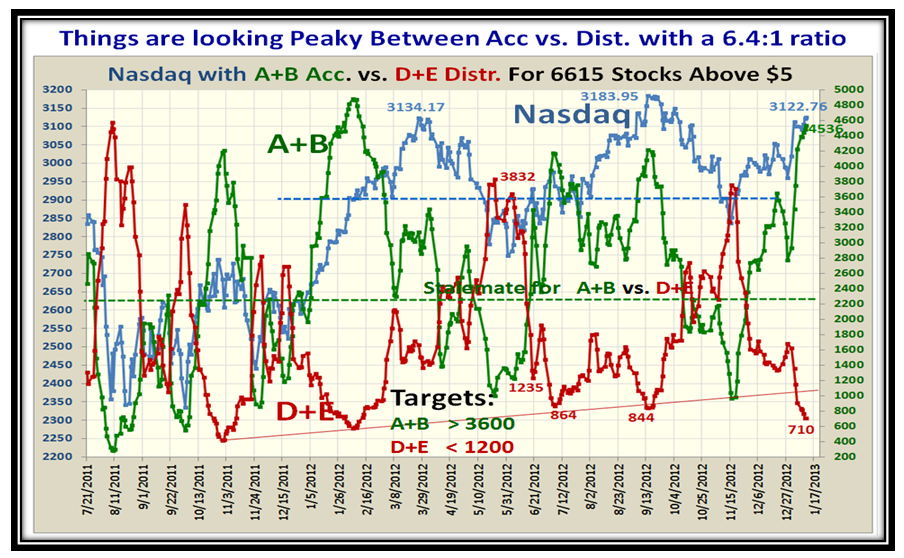
Let me remind you that ten buckets up in two days in a row is not to be taken lightly, and its effect was to drive the underlying parameters of the Market such as the Accumulation/Distribution Ratio to new highs not seen since this time last year, as we will see in this next chart:
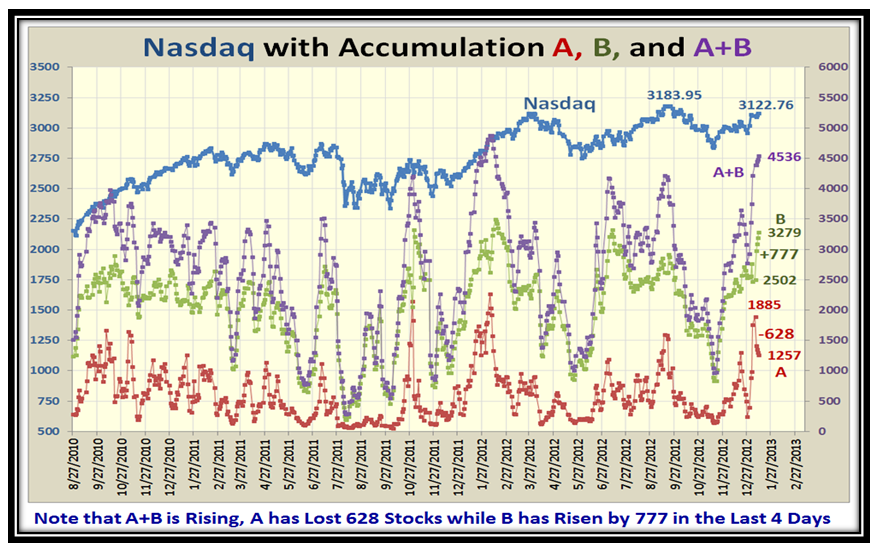
But now we must look deeper and focus on the relationships of A, B and A+B as shown in this next chart. As I show, this past week we have seen a falling off of stocks with A Accumulation of 628 stocks though an increase of 777 stocks into B which gave a small net increase to A+B. The Total of 4536 stocks in A+B is the second highest in the three years shown, so it is still inching up:
But that is not enough…let’s look at the History with regard to the Ratio of A+B:D+E to see if we can glean where we stand and what to be careful about before we draw general conclusions. As I point out on the chart, be careful you don’t get Faked out and miss additional upside moves as has happened twice in the last three years:
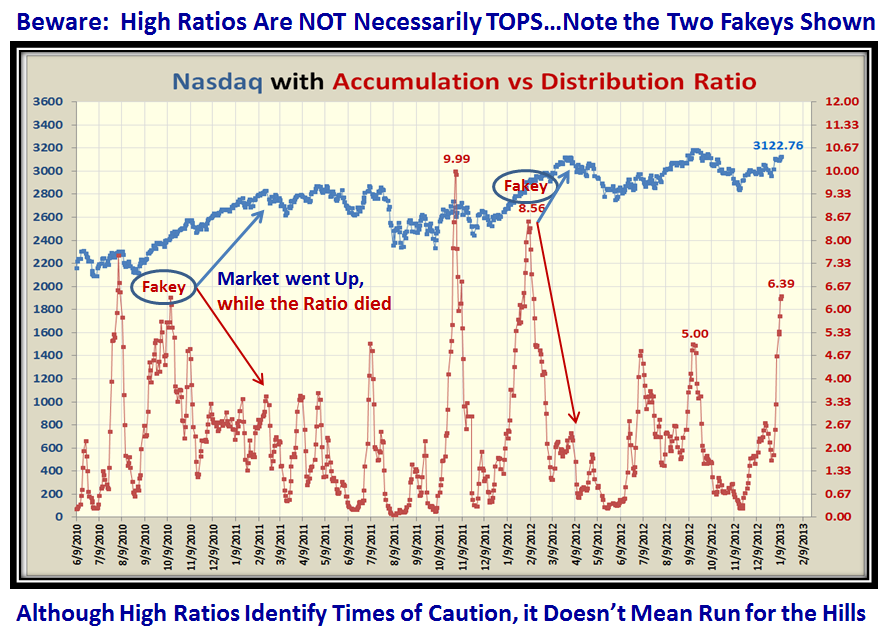
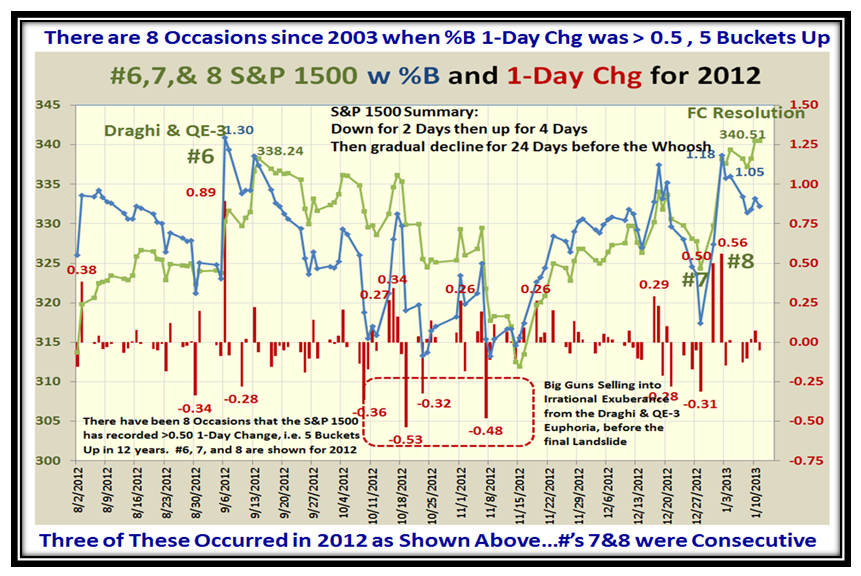
It is noteworthy that the two Fakey’s both occurred at the January through March timeframe, so watch carefully and don’t jump to conclusions too fast. So how do we find clues as to which way the wind is blowing? I gave you that last week and that is to watch how the Big Guns may be selling into this situation as we follow their actions with Down Kahunas. It is a trifle early to say, but note how the drop in %B has not as yet been matched with Big Down Kahunas, although the S&P 1500 has bounced back to 340.51. It is far too early to tell but I have yet a further trick up my sleeve for you to keep you on the right side of Greed in the Market:
…And now for Late Breaking News. With the help of my good friend Bob Meagher, here is a summary of the History over the past ten years for when the Market had Five Bucket rises or more in one day, thereby showing excessive exuberance:
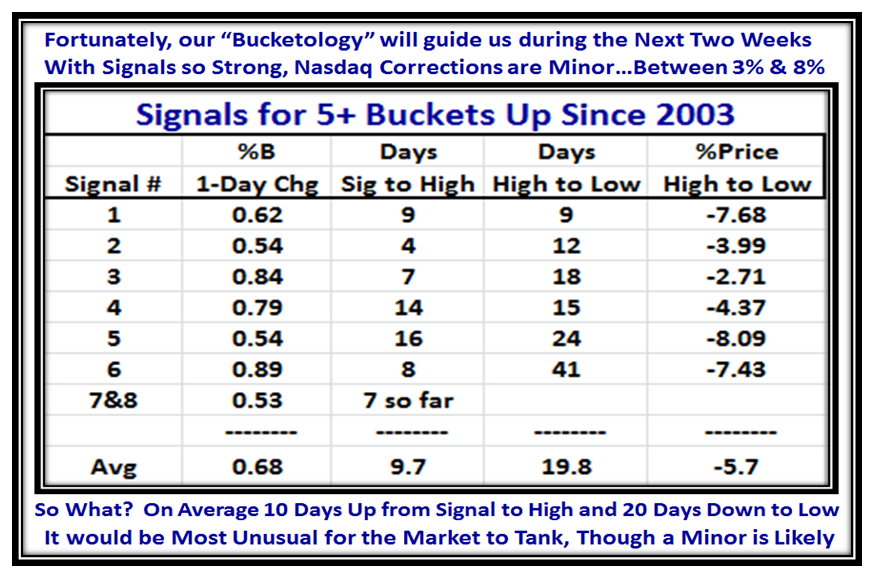
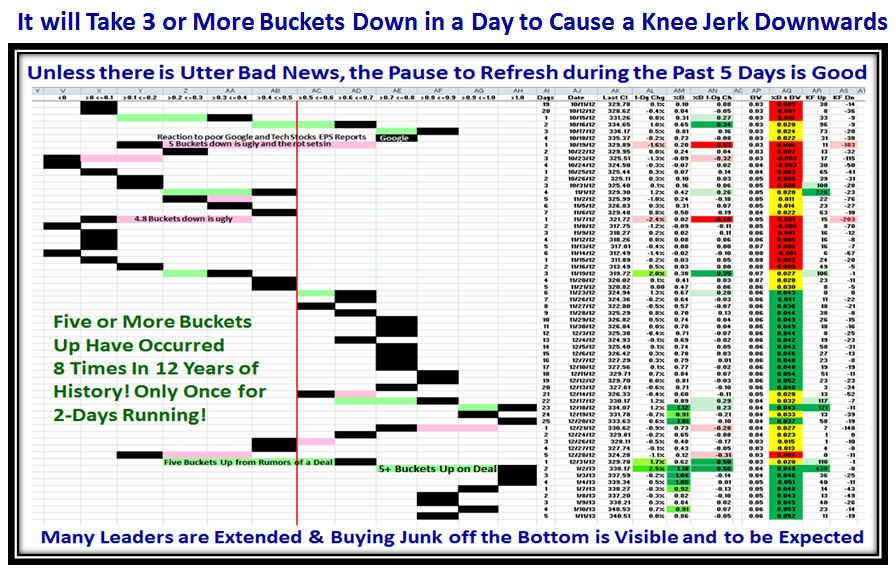
To wind this up here is the usual picture you look forward to, and you can readily see we have room to go either way, but be thankful for small mercies that we still have a cushion before a landslide sets in unless we hit something ominous like 3 or more Buckets down in a day!
…And that’s my Story for Today! I always have a few faithful followers who regularly drop me a line of encouragement and I am grateful for that. However, I am amazed at how we have a laize faire approach to writing a line of thanks with this Internet media. That’s life! When I am gone I hope you will miss me, but then it will be too late.
Best Regards,
Ian.
