Ian Woodward's Investing Blog

Archive for March, 2013

Inch by Inch Market Indexes Climb to New Highs
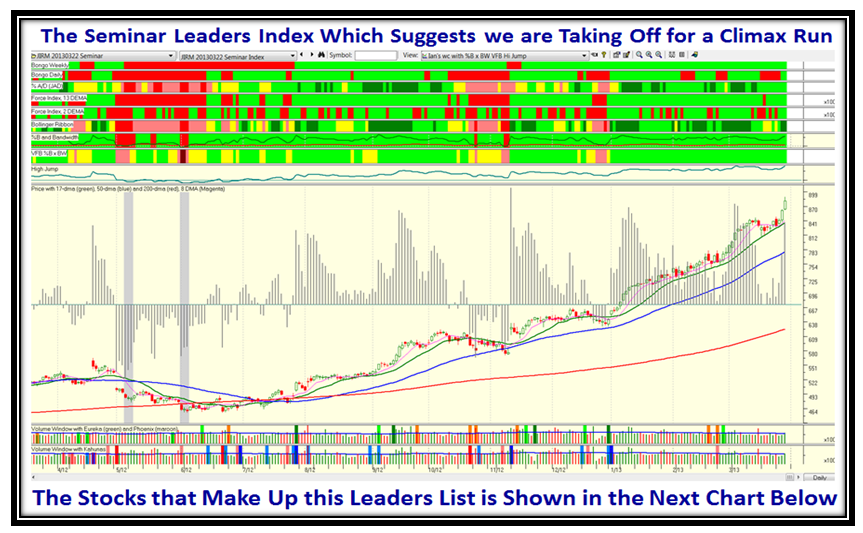
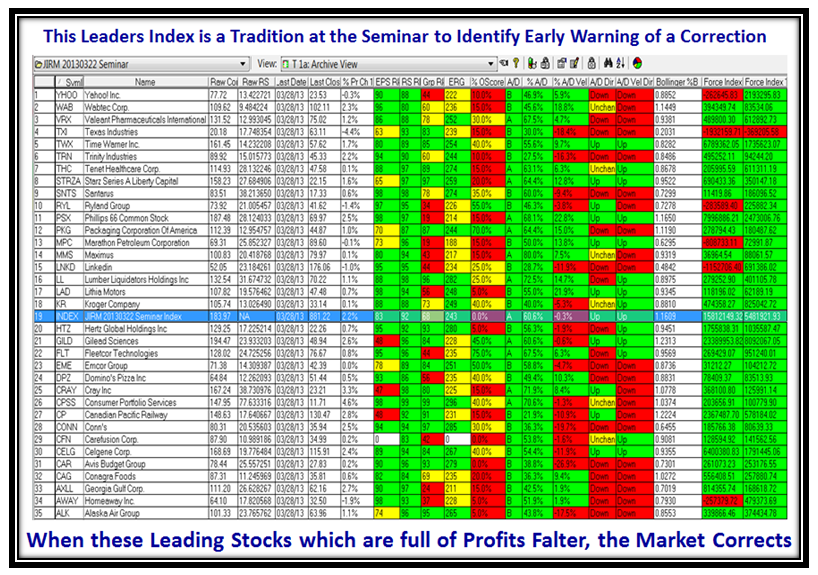
Sunday, March 31st, 2013

Thank you for your patience as I took a well deserved “Pause to Refresh” after an invigorating 3-Day Seminar last weekend.  I will give you a couple of bonus snapshots to enjoy of the Leaders Index we always develop at such events.

Inch Picture

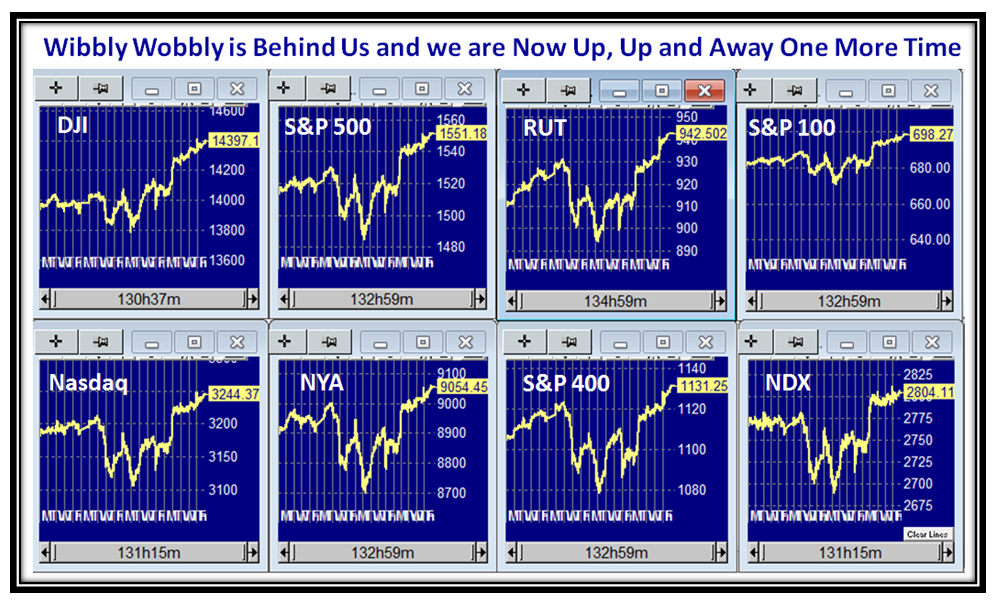
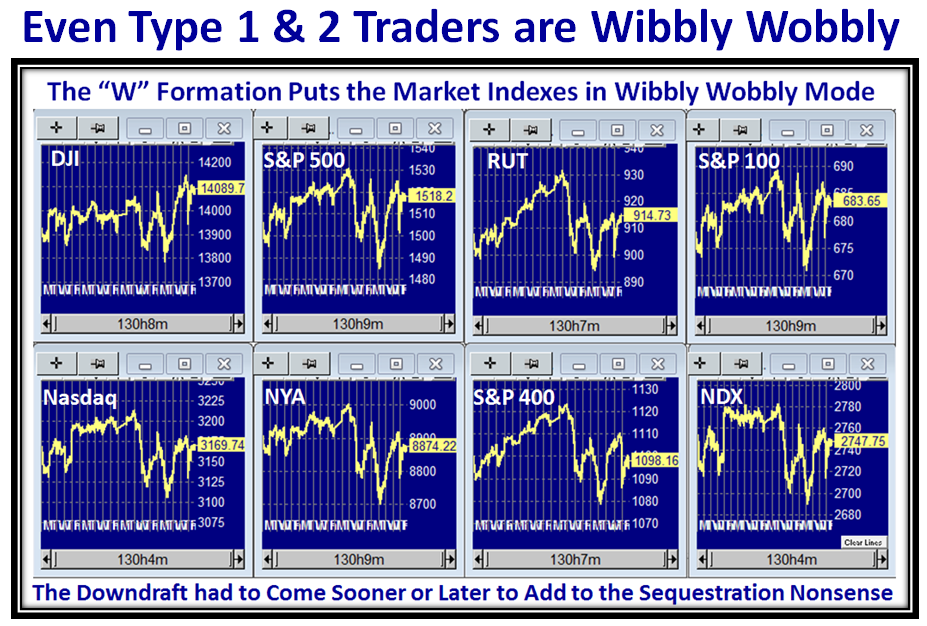
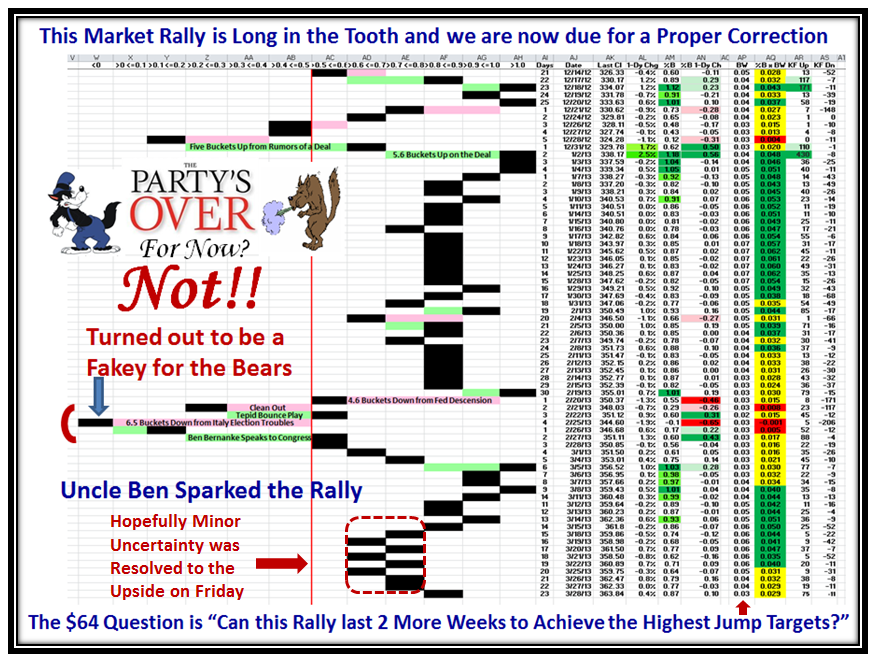
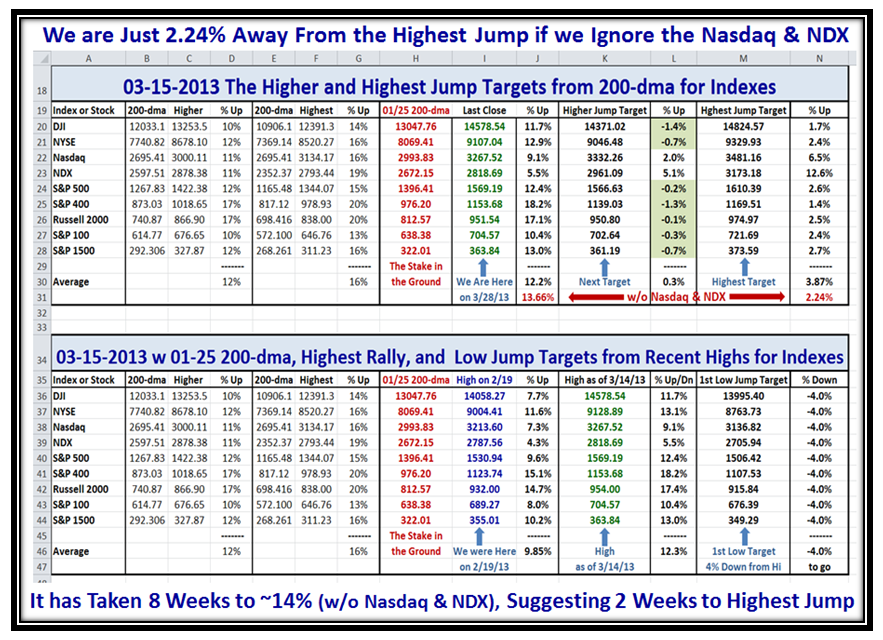
It’s unfortunate that the Market Indexes are still showing the “Wibbly Wobbly” phenomenon of a few weeks ago, but not to the same degree.  Of late it has been a one day up and the next day down affair with no serious spikes down.  To say that this Rally is long in the tooth is hardly an exageration, but hopefully we will eke out a couple of weeks more to the upside to achieve the Highest Jump Targets for the Market Indexes, except for the laggards…the Nasdaq & NDX:

Inch Indexes

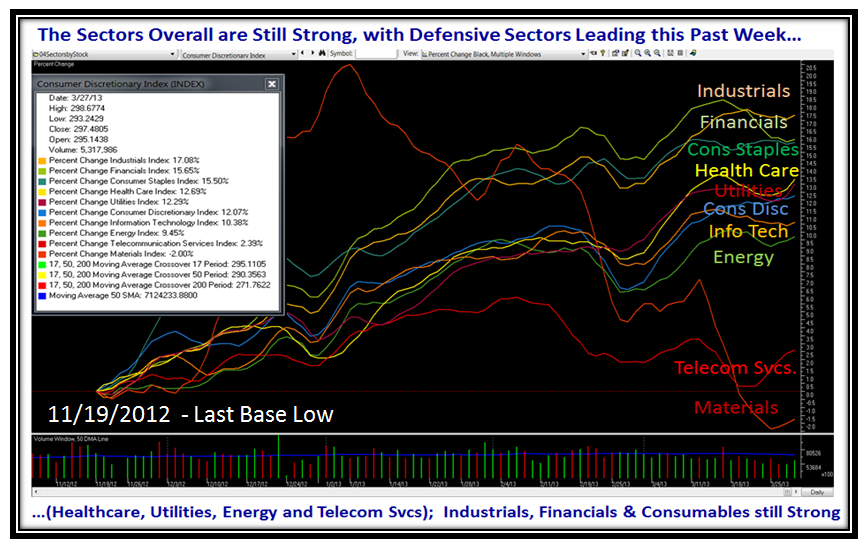
The Market Sectors are still holding up, with a very recent perceptible shift to Defensive Sectors as shown on the next chart.  Materials have been totally trashed, but Telecom Services which was the laggard has shown signs of life especially with VZ and T showing progress:

Inch Sectors

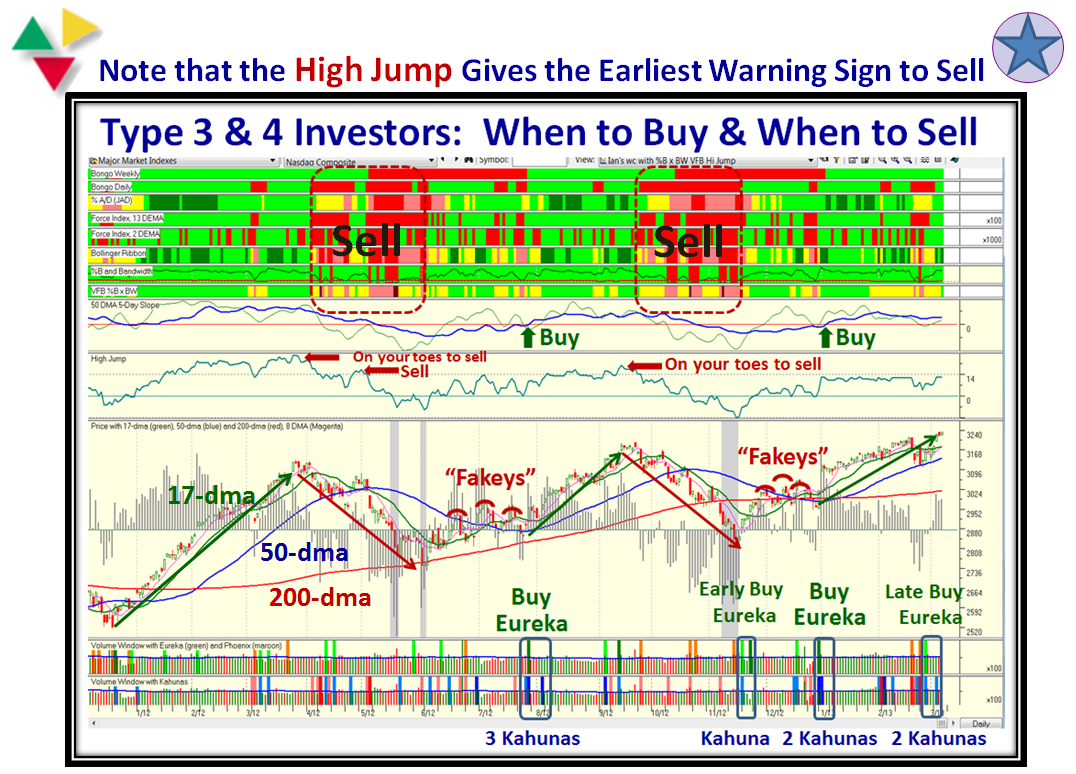
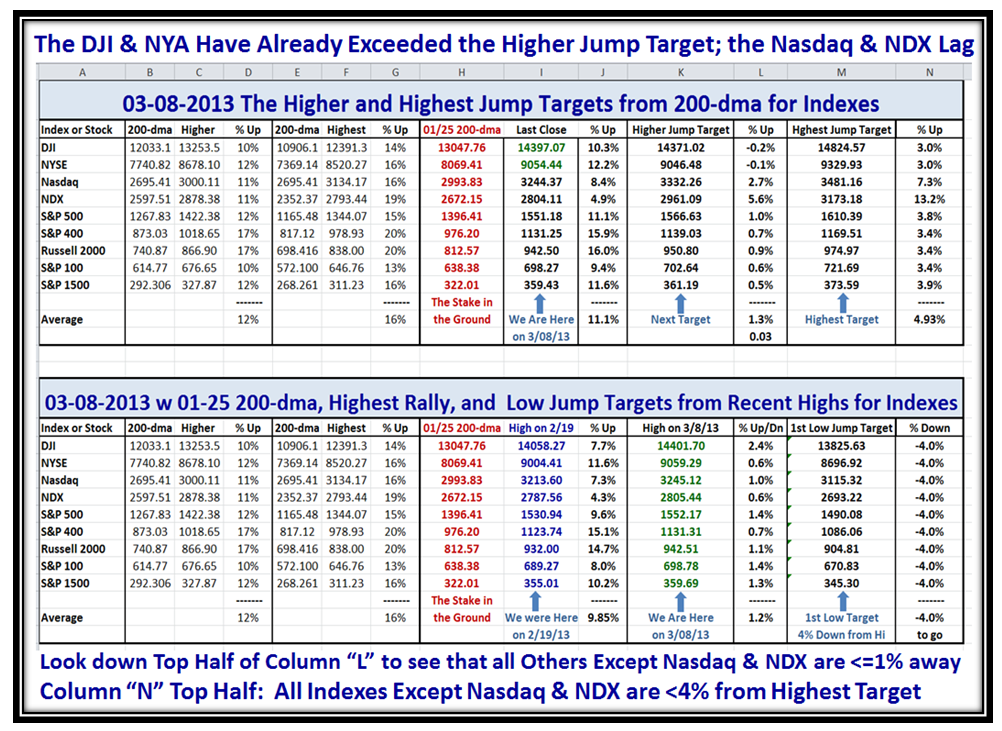
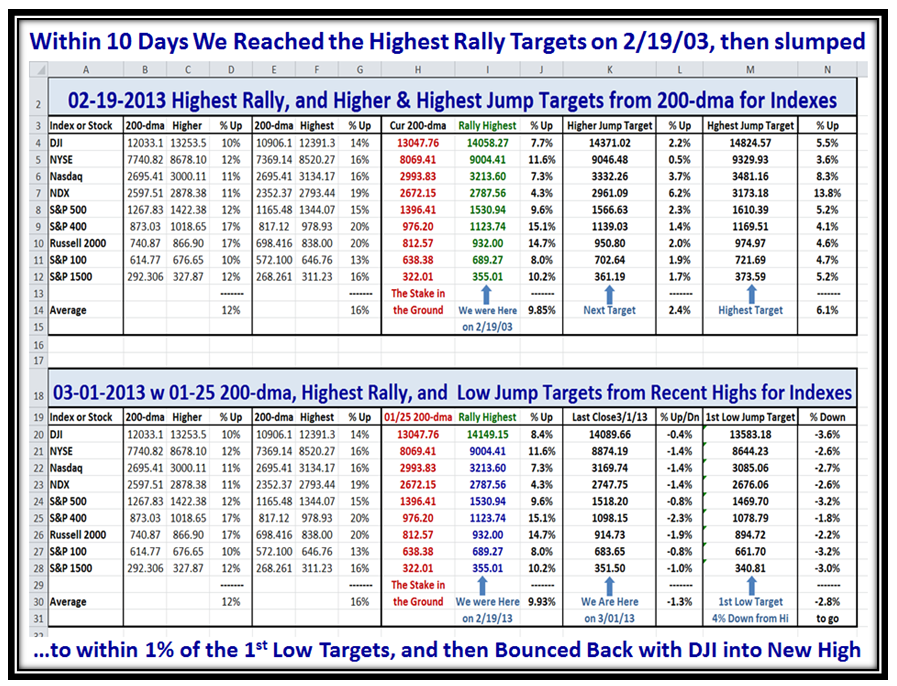
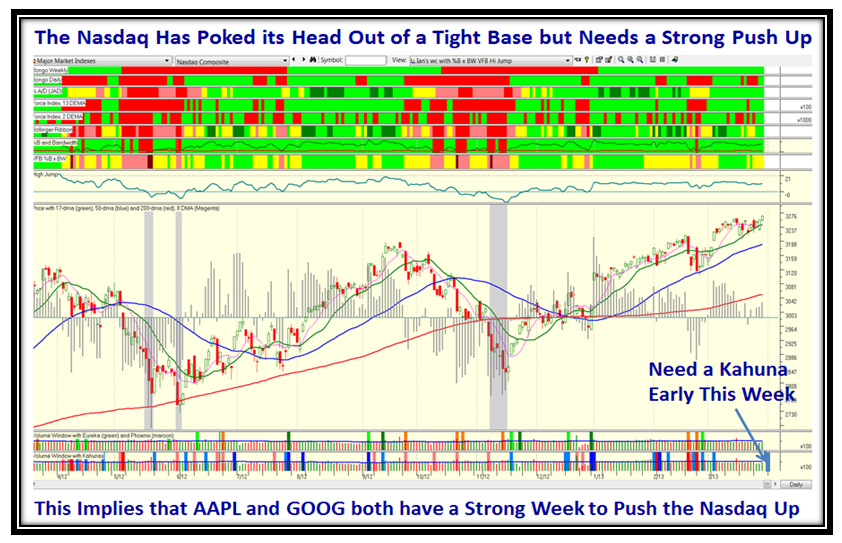
The Nasdaq has shown signs of new life as it has poked its head out of a tight 14 Day Base, but there is no conviction with volume remaining very placid.  If this is to be the last hoorah for the Market we need a burst of enthusiasm by the Bulls in the form of a Kahuna as hopefully in the next two weeks the Leading Market Indexes reach their Highest Jump Targets which on Average is only 2.24% away discounting the NASDAQ and the NDX.  However, for there to be irrational exuberance we now need to see the likes of AAPL and GOOG burst upwards with some sparkle.  More on this when we review the Spreadsheet of the Higher and Highest Jump Targets, a few charts down:

Inch Nasdaq

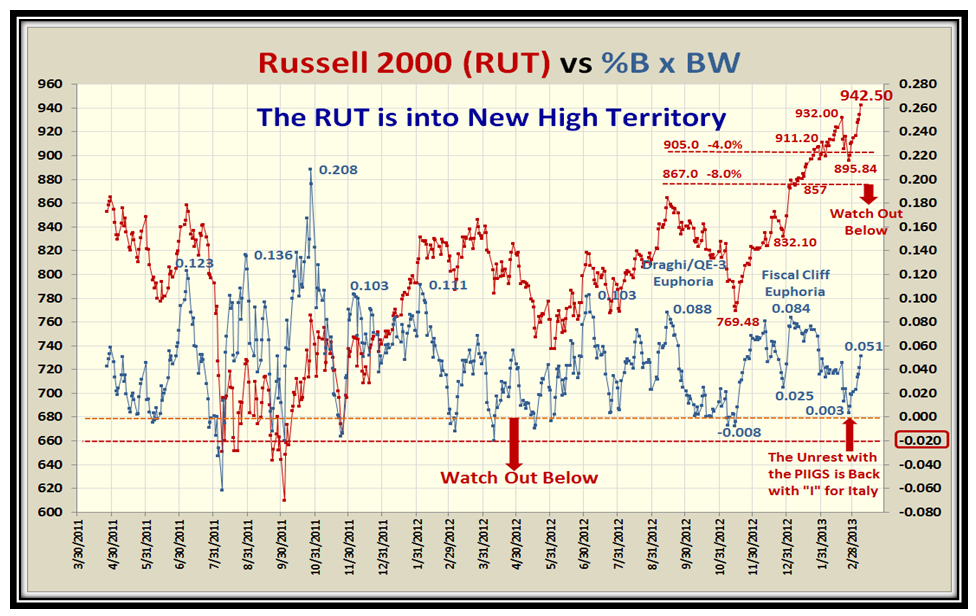
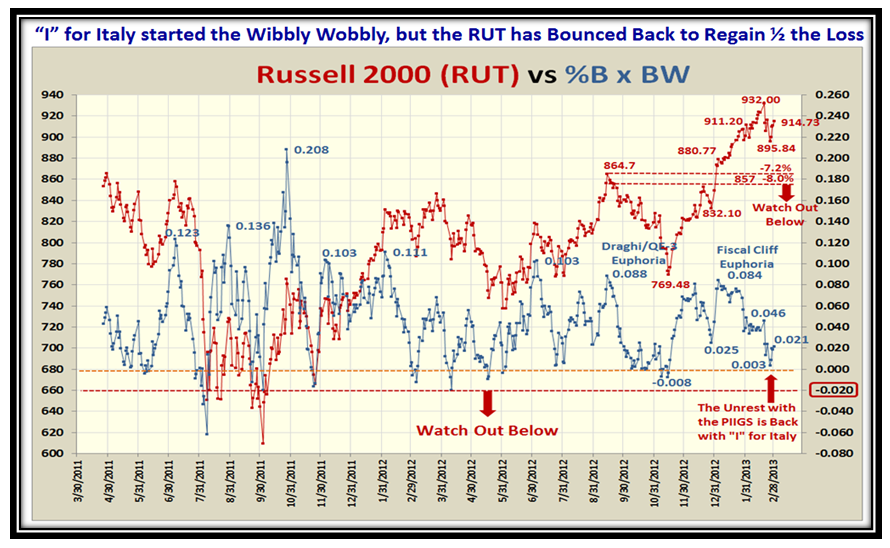
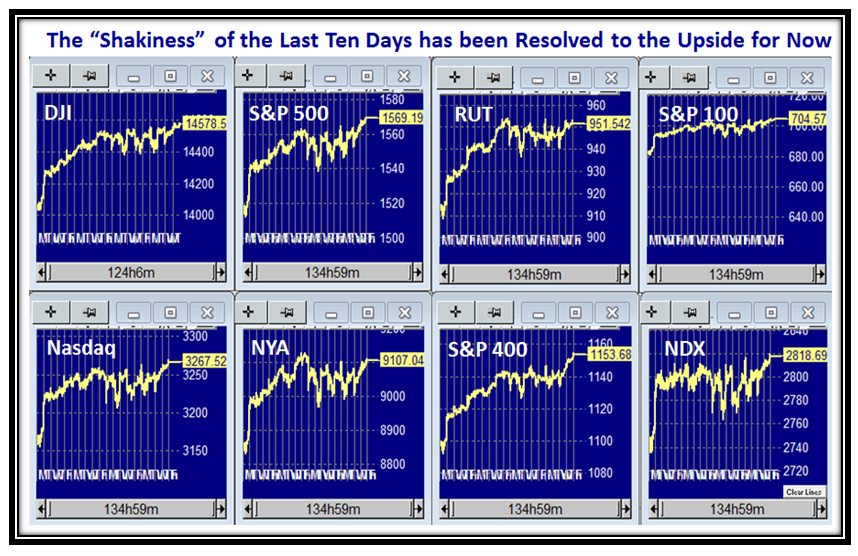
The Russell 2000 essentially took a breather this past week which was a result of the Cyprus Banking kerfuffle, but hopefully will plough through to New Highs this week, to catch up to the lead by the Mid Cap S&P 400:

Inch RUT

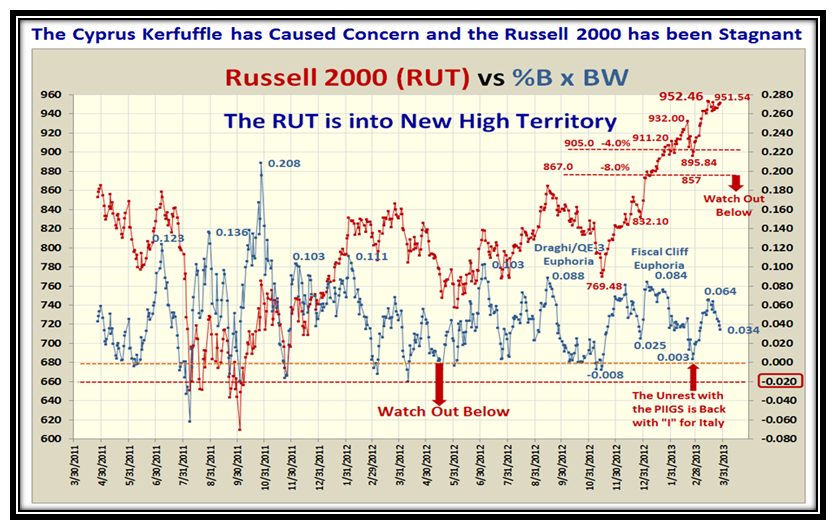
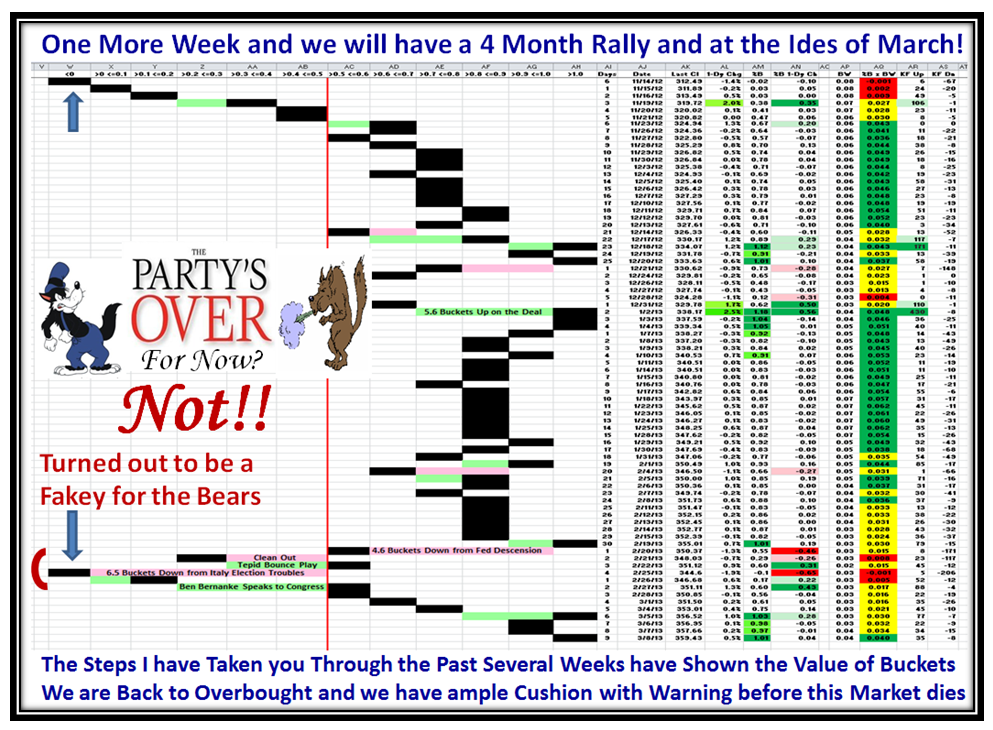
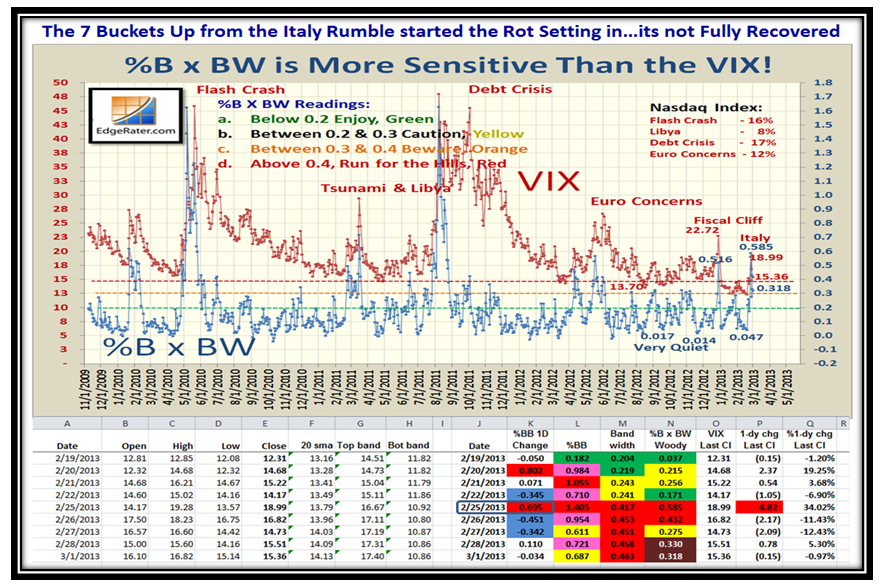
Hopefully the minor back and forth last week has been resolved with Friday’s action, but unfortunately any little bit of disturbing news, especially out of Europe can set this Market into a tailspin.  Barring that, I sense the Market still wants to go up, in which case a strong move can lead to a climax run and hopefully achieve the Highest Jump Targets.  Please note the tiny red arrow I show at the bottom right of the next chart, which cautions us that the Bandwidth of the S&P 1500 is once again in a tight squeeze at a reading of 0.03, which invariably implies that a Correction is not far behind:

Inch Pat

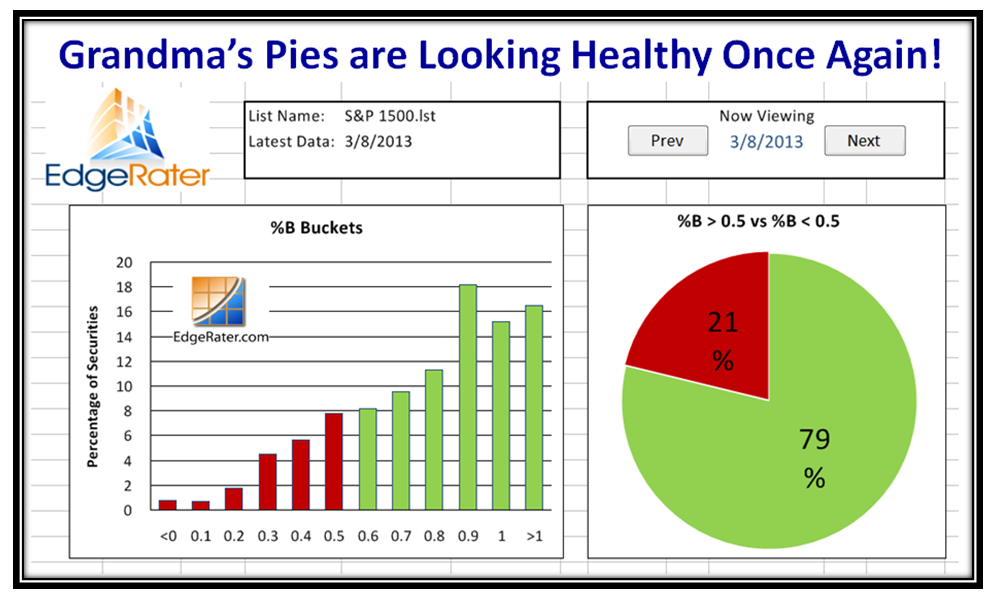
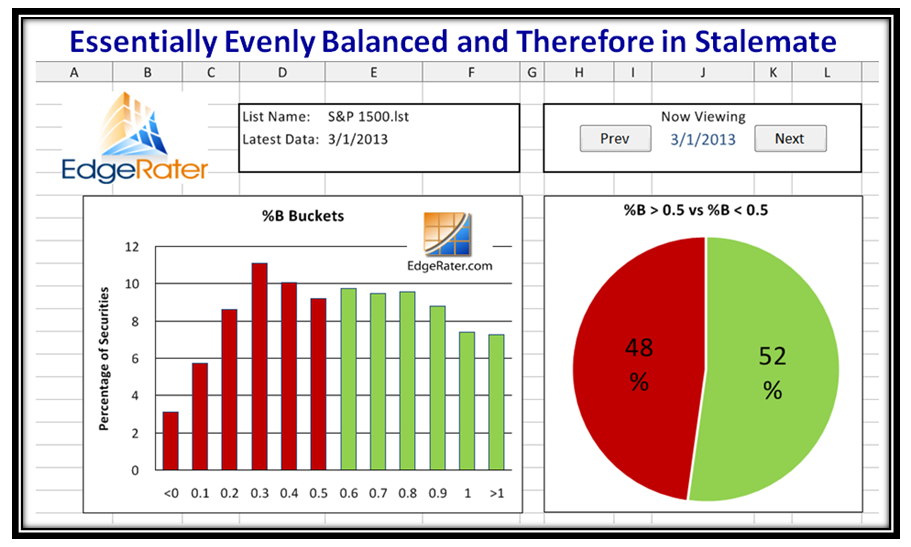
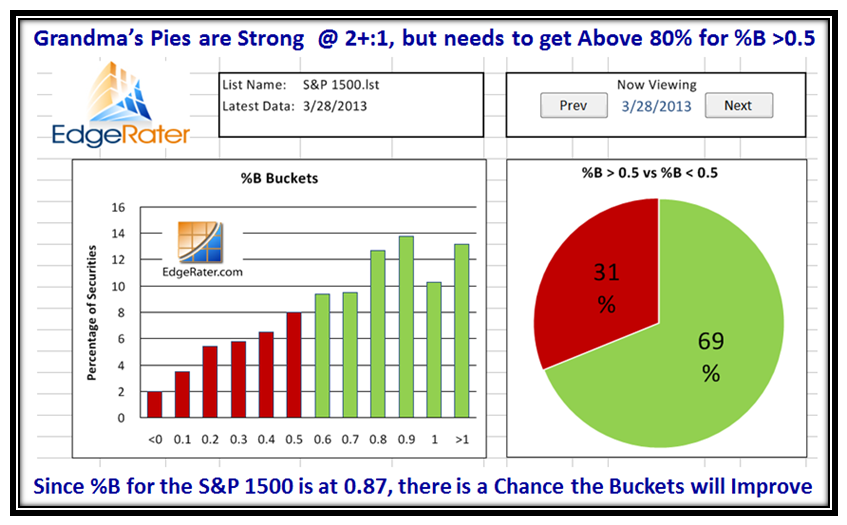
Please note that the %B of the S&P 1500 is at 0.87 (87%), while the %B of Stocks >0.05 is 69%…this invariably implies that the Buckets can still improve to the Upside being pulled up by the sudden burst of enthusiasm in the Index itself.  If that does not occur, we can again expect that %B will fall back.  Please also understand that with a reading of 0.87, %B would jump into overbought territory if we were to get a Kahuna to the upside which is unusual at this level.  In which case “Overbought” on either the %B and/or %B >0.5 would signal the rally days are numbered, especially at this late stage:

Inch Pies

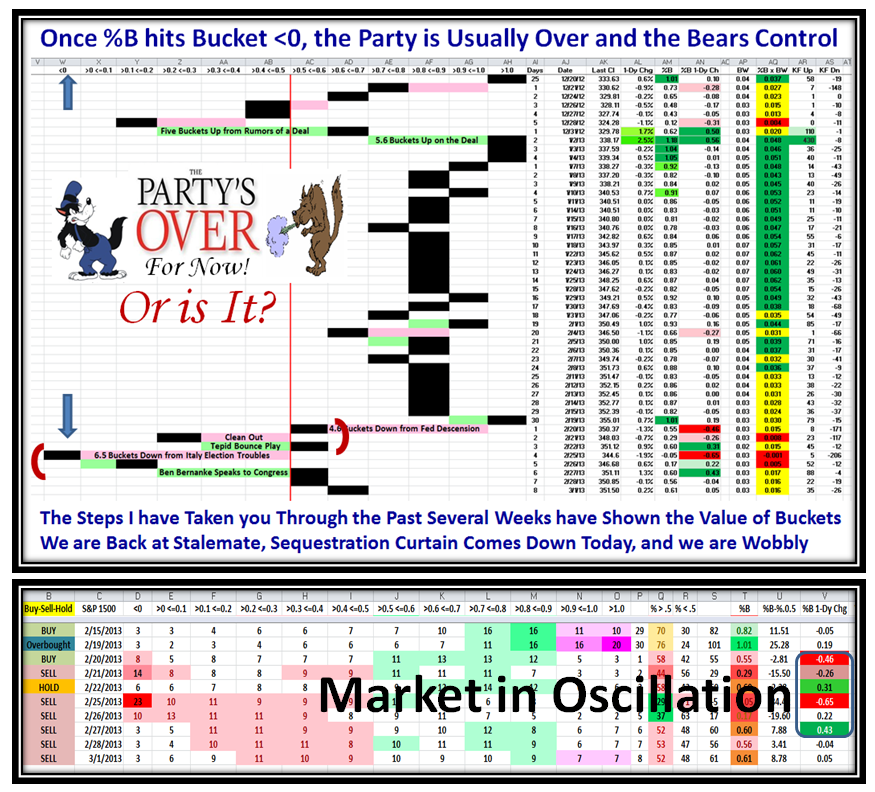
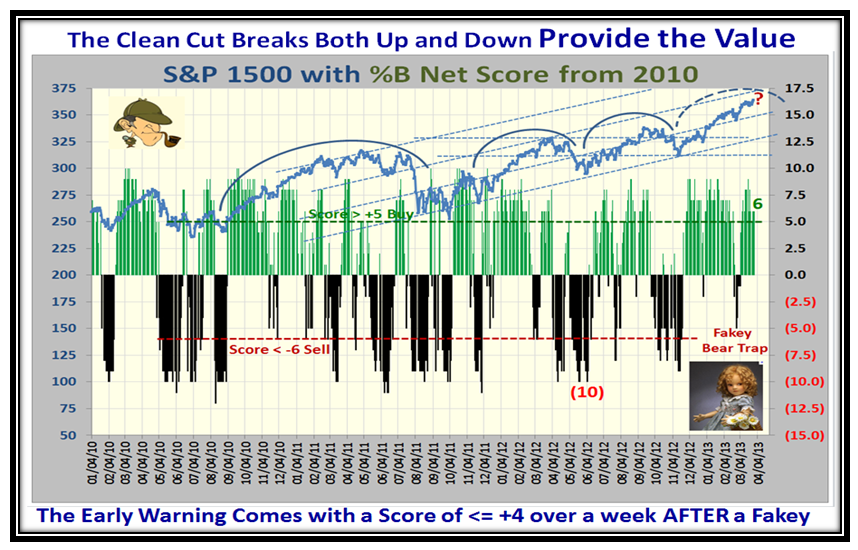
The %B Net Score stays healthy at 6, and as I caution you the time to worry is when this trots down to 4 as the early warning sign that the internals are giving up the ghost and we can expect a Correction or another Fakey!

Inch Net Score

Folks, we spent a good deal of time understanding Fear and especially Greed at the Seminar, and I hope you now realize that this High Jump mumbo jumbo (good stuff), will keep you on the sunny side of the street.  The Spreadsheet you have come to know and love shows that 7 out of the 9 Market Indexes are now past the Higher Jump Target, and if we IGNORE the Nasdaq and NDX, the rest of the Indexes are but 2.24% away from their Highest Targets.  As I mention on the bottom of the chart it has taken us 8 weeks to achieve ~14% up since 01/25/2013, so with any luck the Targets can be reached within the next two weeks.  Notice that the S&P 400 and the DJI are leading the charge by looking down column N20 to N28.  The only thing preventing this is a SURPRISE negative piece of News…we shall see.  I have to make that Caveat since that is the world of investing these days which is all News Driven.  But let me tell you that in all the years we have given seminars, we have never witnessed so many tight Lower Left to Upper Right Charts (LLUR) in our life!  Ultimately they die through profit taking, but for now this is a very healthy market:

Inch Hi Jump

Here are the couple of bonus snapshots to enjoy of the Leaders Index we always develop at the Seminar, which will give you insight of what we learned at the Seminar as mentioned above:

Inch Leaders Chart

Inch Leaders List

Well, that’s it for today…I hope all of this is of value to you and helps to see through the fog!

Best Regards,

Ian.

Stock Market: New Highs out of Wibbly Wobbly!

Saturday, March 9th, 2013

Wonders Never Cease…We are now into New High Territory after the spate of Wibbly Wobbly which is forgotten and behind us.  We are at an interesting stage where we are but 1% away for all but the Nasdaq and NDX Market Indexes from the “Higher Jump Targets” I set seven weeks ago, so it is Up, Up and Away again:

Up Picture

The DJI and NYA are flying high and have set New High Records above the Higher Jump Targets set over seven weeks ago:

Up Indexes

The Russell 2000 (RUT) has bounced back nicely and is into New High Territory with a 4% cushion to support so all is hunky dorry for now.  Another 10 points higher and we would have met the Higher Jump Target of 951.

Up RUT

Now here is a bonus for Longer Term Investors that shows what to look for with regard to buying and selling:

Up Buy and Sell

The Lesson learned is to always watch the High Jump for signs of when the Markets and Stocks are overbought.  We are now nearly into a four month rally and in another week we will be celebrating the Ides of March!  The beauty of the current situation is that we have ample cushion and early warning before catastrophe sets in:

Up Pat

Grandma’s Pies are not soggy any longer and looking very healthy once again:

Up Pies

…And now, I finish with the real Gem on your gateway to the stars as you review the progress against the targets I set for the Market Indexes to reach the Higher Jump Targets way back on 01/25/2013.  The top half is where to look and concentrate on Columns “L” and “N”.  Always take things a step at a time.  Let the Indexes get past the Higher Jump Targets (if they do) before worrying about the Highest Jump.  Note however that only the Nasdaq and NDX are lagging while all the others are either above the target (DJI and NYA) or no more than 1% below, which is reachable if the rally continues.

Up High Jump

My thanks to all my supporters around the world, who pop in to see what the latest news is and for some of you who have even taken the HGSI Product to follow along and more than that have come across the pond to attend a seminar.  The next one is in two weeks time so hurry and sign up.  Ron and I  have raised the bar one more time.

Up Countries

Best Regards,

Ian

Stock Market: In Wibbly Wobbly Mode

Saturday, March 2nd, 2013

The last ten days have been a nightmare even for the short term Type 1 & 2 Traders (Day Traders to a Week Traders) as they struggle through the whims and fancies of the Big Guns with the least bit of good or bad news to shake things up:

Wobbly Picture

…And to prove it we only have to look at the “W” formations we have endured on the Market Indexes in the last ten days:

Wobbly Indexes

Those who have been with me forever know I trot out my favorite picture of the Ides of March and this is a wind up in two week’s time to Et Tu Brute!  This next chart gives you the timeline of what to expect in this Sequestration kerfuffle for the next 6 months:

Wobbly Timeline

Using the Russell 2000 (RUT) as an example of what has transpired these last eight days, it along with the Mid Cap S&P 400 were on fire and reached a peak of 932 on 2/19/2013, only to trot down to 895.84, about 3% down from its high in a matter of five days.  It has since bounced back in the last three days from the assurances of our good friend Uncle Ben who spoke to Congress with his usual confidence that the Fed is standing tall with its QE-3 assurances!!  The RUT has recovered half the loss from its recent high.

Wobbly RUT

As we note, the Big Guns used “I” for Italy in the PIIGS as the excuse for a hard knee jerk, but Uncle Ben came to the rescue.  Needless-to-say, the VIX did its dance upwards and has not as yet fully recovered to its “quiet” state of below 14.00.  None-the-less the warning blast of nearly seven Buckets up in one day says it doesn’t take much to throw the markets into a tizzy:

Wobbly VIX

Meanwhile, the leaders have been truly trounced, but there are signs that there is rotation into “old names”, some rising from the ashes such as JNJ, PFE, AVP, CAG, K, PG, BMY, IFF, CLX, and producing LLURs though with rotten ERG!  Defensive stuff.

Wobbly ACC

This next chart tells the whole story as we see the extent of the oscillation as the S&P 1500 %B trotted up & down:

Wobbly Pat

The Big Guns are reluctant to let the floodgates open full bore yet and through all of this turbulence we are back to Stalemate:

Wobbly pie

One of my newer faithful followers Fred Magner mentioned his strong belief in the High Jump function as have many people over the years.  The chart below is a sea of numbers and most just roll their eyes and move on.  However, if you take the time to study what I lay on a silver platter for you, you will begin to see the value of setting targets from Stakes in the Ground based on both High and Low Jump targets.  As long as the Rally was on, I focused your attention to the Higher and Highest Jump targets in the top half of the chart below.  Once the Market peaked on 2/19/2013, we see we were close to the Higher Jump targets and just 2.4% away on average.  We also note that the NDX and Nasdaq were the laggards, with the NYSE and S&P 400 leading the charge.

Since then, the only Market Index that has beaten that Rally High is the DJI as shown in cell I20 shown in green while the others are all lower than their recent high shown in Blue.  The recent dip of three days ago when we had that knee jerk on the Italy scare took all the Indexes down about -3% from the  recent highs, but they have all bouced back with the Bernanke reassurances to Congress to recover to within 1.3% of those Rally highs.  Note that the S&P 400 which was the best was hit the hardest and is lagging the rest:

Wobbly High Jump

It’s all about Fear and Greed and how your stomach can adjust to such oscillations, and these views make that come alive for you.

Best Regards,

Ian.

Copyright © 2007-2010 Ian Woodward
Disclaimer: Commentaries on this Blog are not to be construed as recommendations to buy or sell the market and/or specific securites. The consumer of the information is responsible for their own investment decisions.