 Ian Woodward's Investing Blog
Stock Market: In Wibbly Wobbly Mode
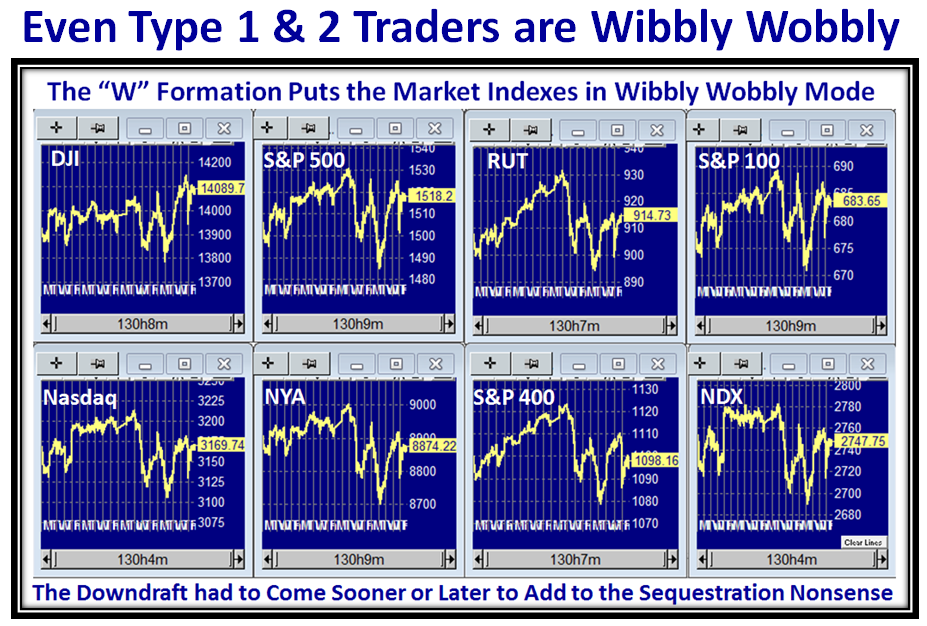
The last ten days have been a nightmare even for the short term Type 1 & 2 Traders (Day Traders to a Week Traders) as they struggle through the whims and fancies of the Big Guns with the least bit of good or bad news to shake things up:

…And to prove it we only have to look at the “W” formations we have endured on the Market Indexes in the last ten days:
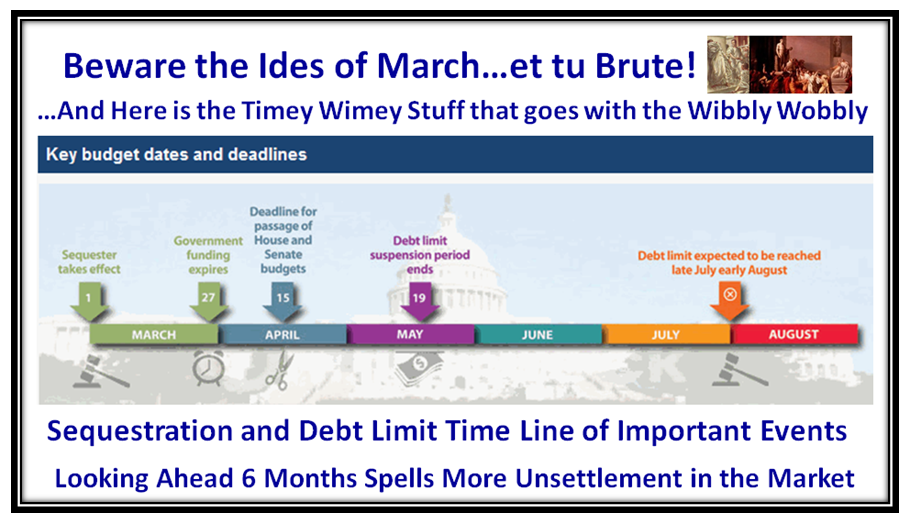
Those who have been with me forever know I trot out my favorite picture of the Ides of March and this is a wind up in two week’s time to Et Tu Brute! This next chart gives you the timeline of what to expect in this Sequestration kerfuffle for the next 6 months:
Using the Russell 2000 (RUT) as an example of what has transpired these last eight days, it along with the Mid Cap S&P 400 were on fire and reached a peak of 932 on 2/19/2013, only to trot down to 895.84, about 3% down from its high in a matter of five days. It has since bounced back in the last three days from the assurances of our good friend Uncle Ben who spoke to Congress with his usual confidence that the Fed is standing tall with its QE-3 assurances!! The RUT has recovered half the loss from its recent high.
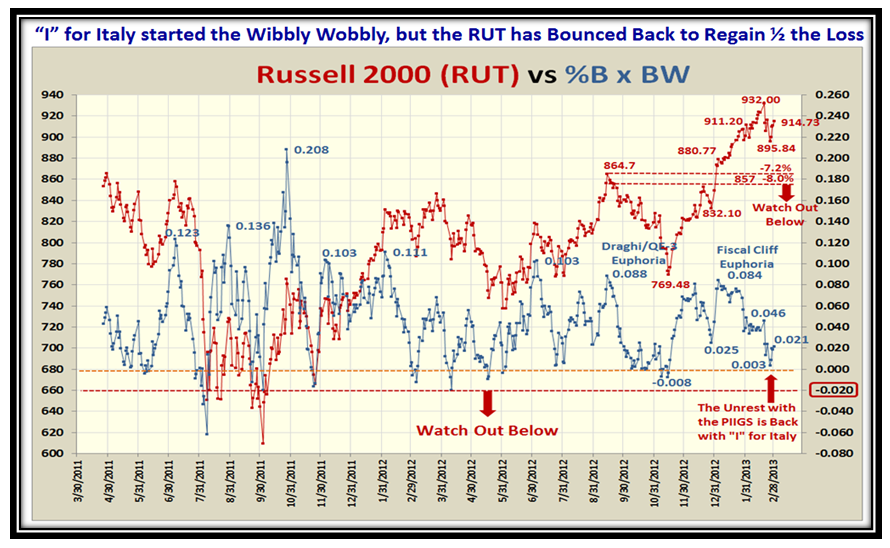
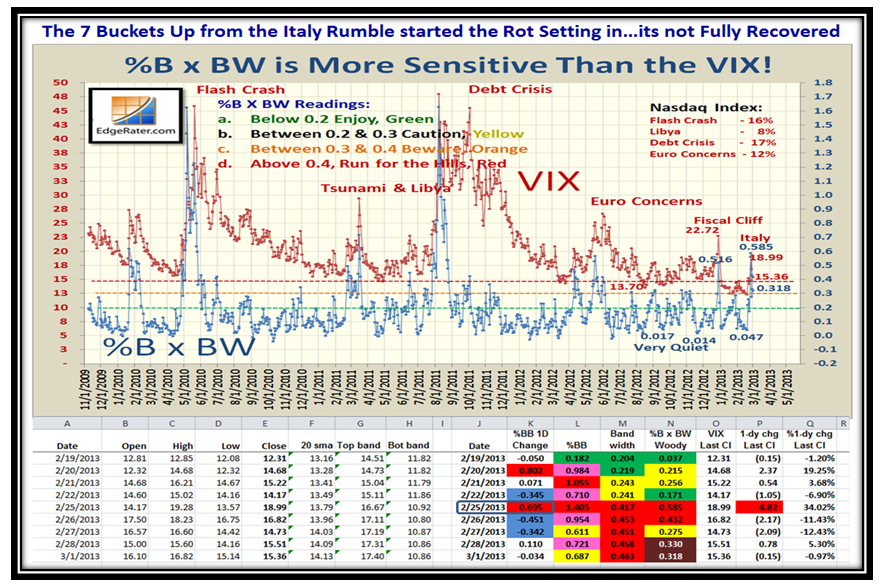
As we note, the Big Guns used “I” for Italy in the PIIGS as the excuse for a hard knee jerk, but Uncle Ben came to the rescue. Needless-to-say, the VIX did its dance upwards and has not as yet fully recovered to its “quiet” state of below 14.00. None-the-less the warning blast of nearly seven Buckets up in one day says it doesn’t take much to throw the markets into a tizzy:
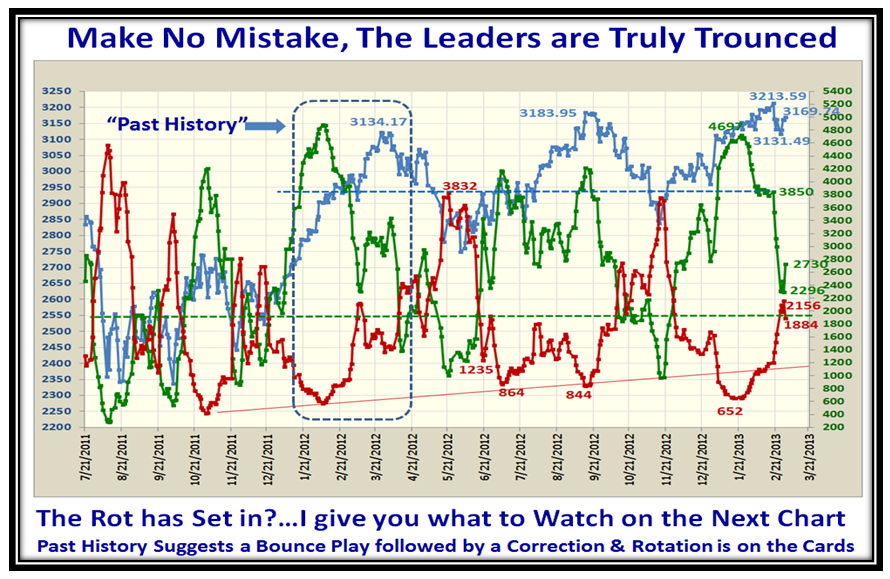
Meanwhile, the leaders have been truly trounced, but there are signs that there is rotation into “old names”, some rising from the ashes such as JNJ, PFE, AVP, CAG, K, PG, BMY, IFF, CLX, and producing LLURs though with rotten ERG! Defensive stuff.
This next chart tells the whole story as we see the extent of the oscillation as the S&P 1500 %B trotted up & down:
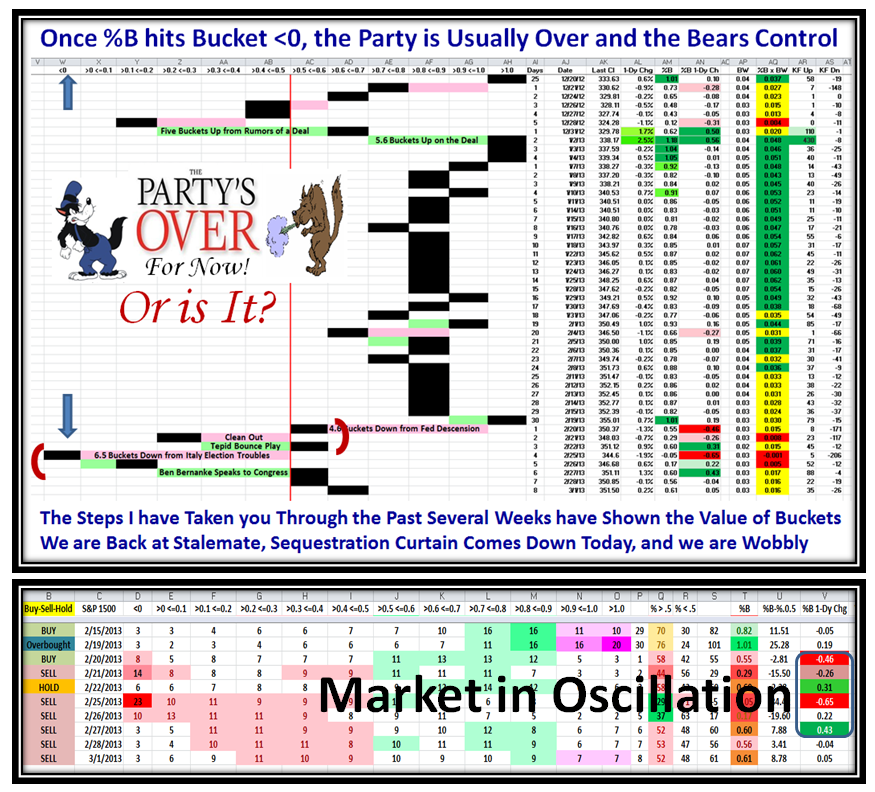
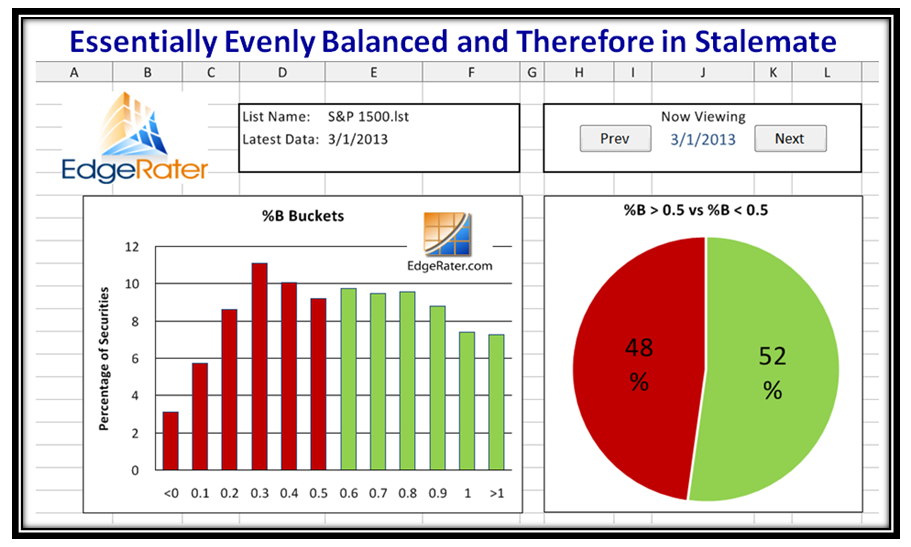
The Big Guns are reluctant to let the floodgates open full bore yet and through all of this turbulence we are back to Stalemate:
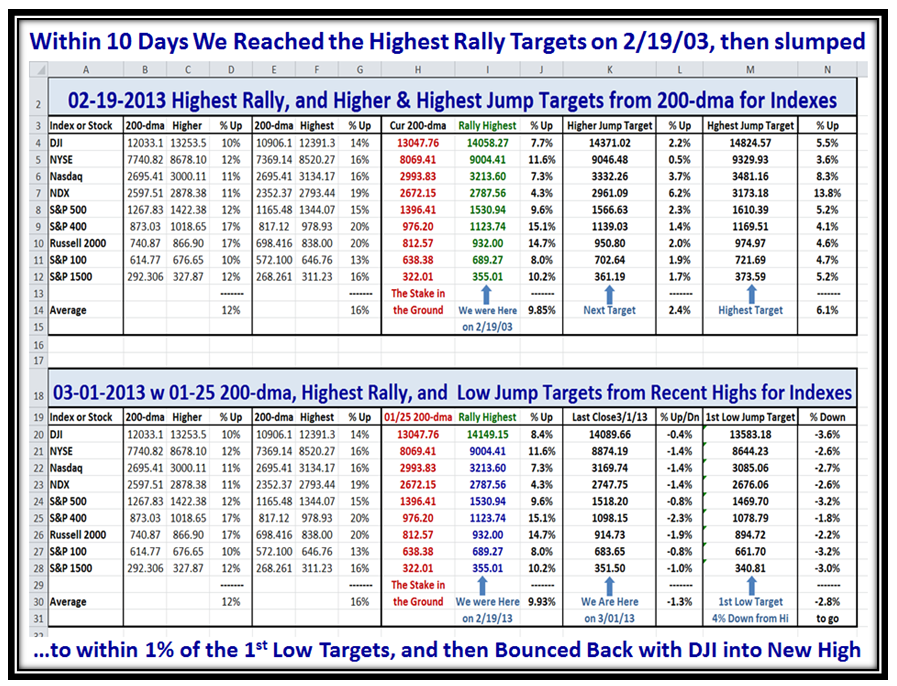
One of my newer faithful followers Fred Magner mentioned his strong belief in the High Jump function as have many people over the years. The chart below is a sea of numbers and most just roll their eyes and move on. However, if you take the time to study what I lay on a silver platter for you, you will begin to see the value of setting targets from Stakes in the Ground based on both High and Low Jump targets. As long as the Rally was on, I focused your attention to the Higher and Highest Jump targets in the top half of the chart below. Once the Market peaked on 2/19/2013, we see we were close to the Higher Jump targets and just 2.4% away on average. We also note that the NDX and Nasdaq were the laggards, with the NYSE and S&P 400 leading the charge.
Since then, the only Market Index that has beaten that Rally High is the DJI as shown in cell I20 shown in green while the others are all lower than their recent high shown in Blue. The recent dip of three days ago when we had that knee jerk on the Italy scare took all the Indexes down about -3% from the recent highs, but they have all bouced back with the Bernanke reassurances to Congress to recover to within 1.3% of those Rally highs. Note that the S&P 400 which was the best was hit the hardest and is lagging the rest:
It’s all about Fear and Greed and how your stomach can adjust to such oscillations, and these views make that come alive for you.
Best Regards,
Ian.
