Ian Woodward's Investing Blog

Archive for April, 2013

Stock Market: Fat Tails Starting to Get Longer
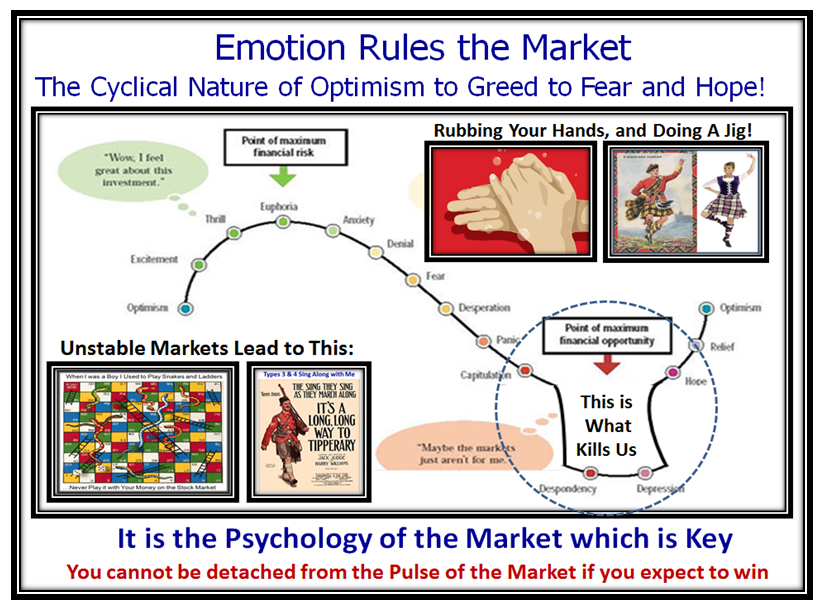
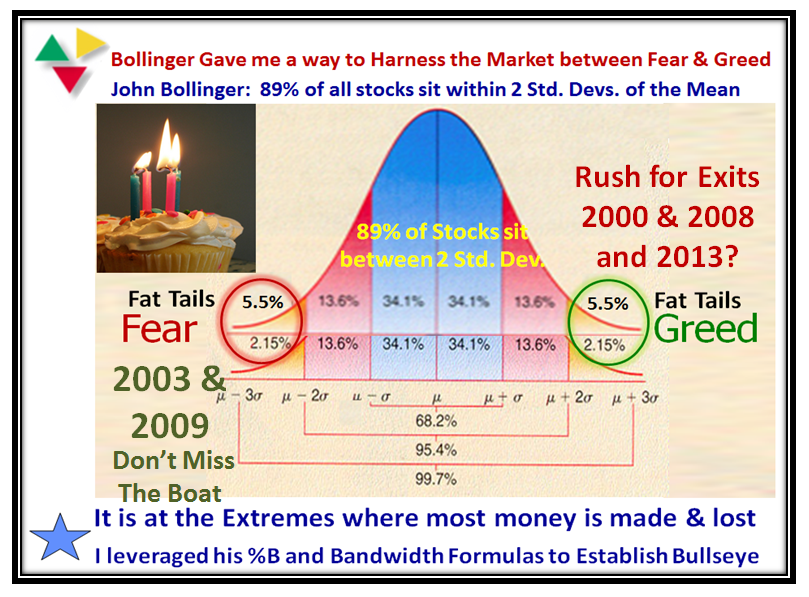
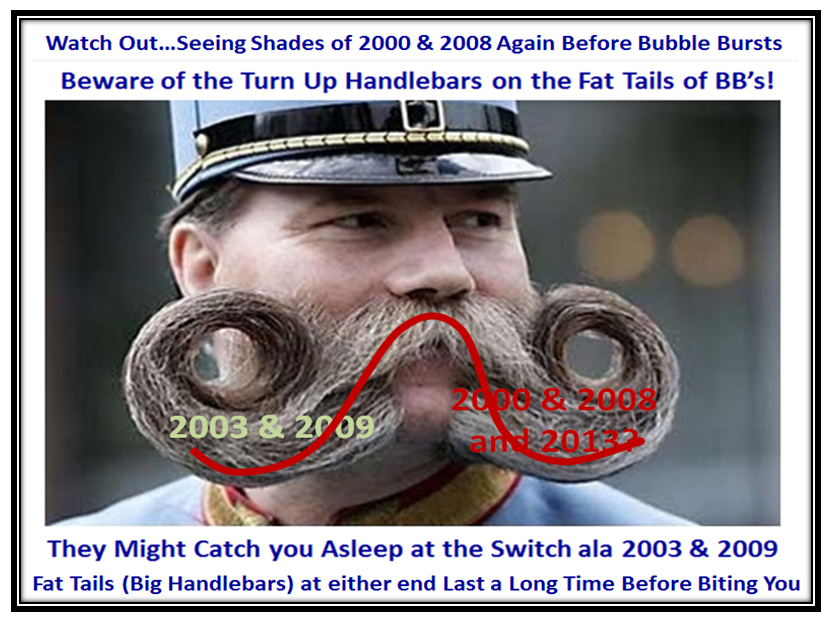
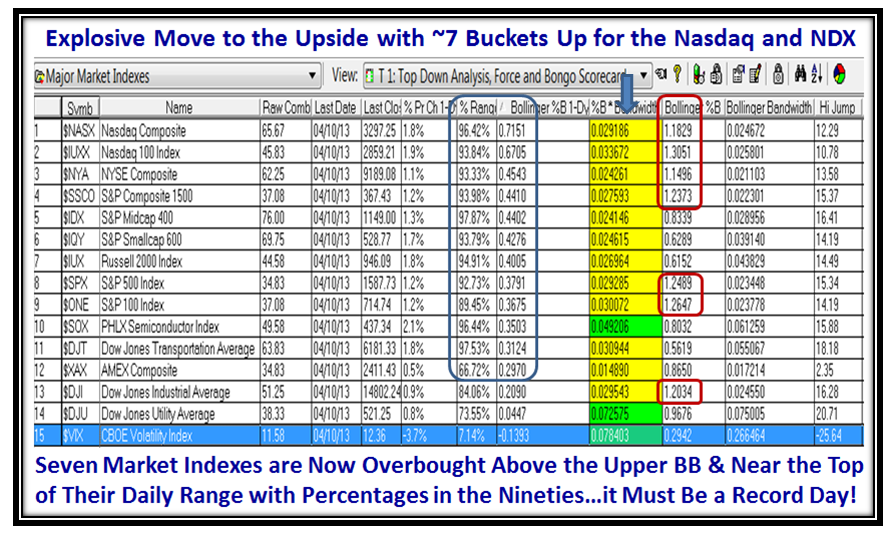
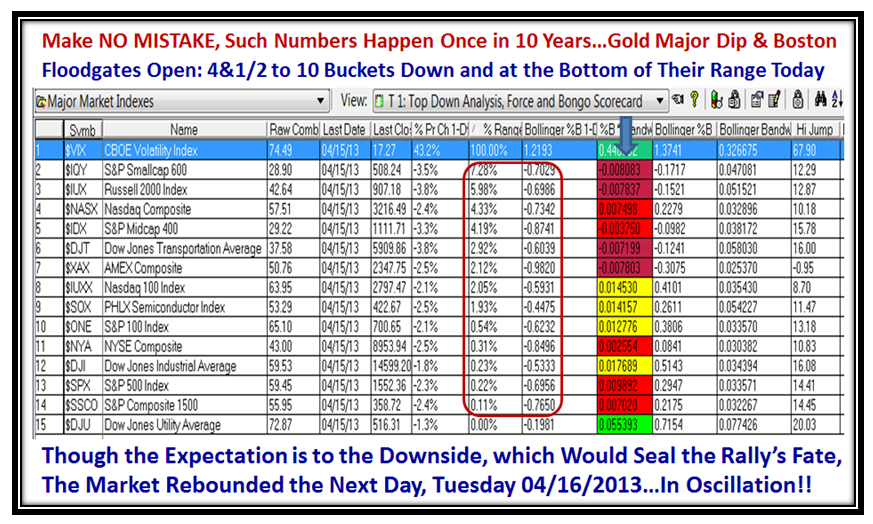
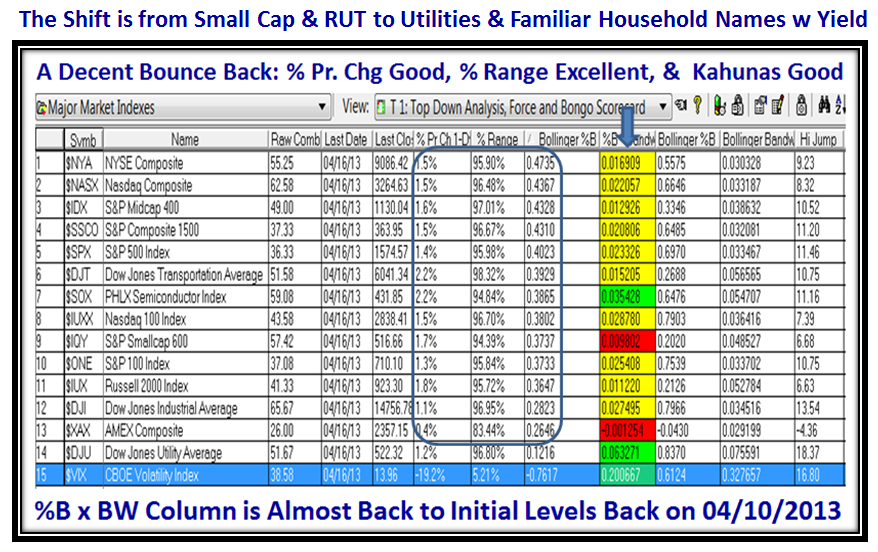
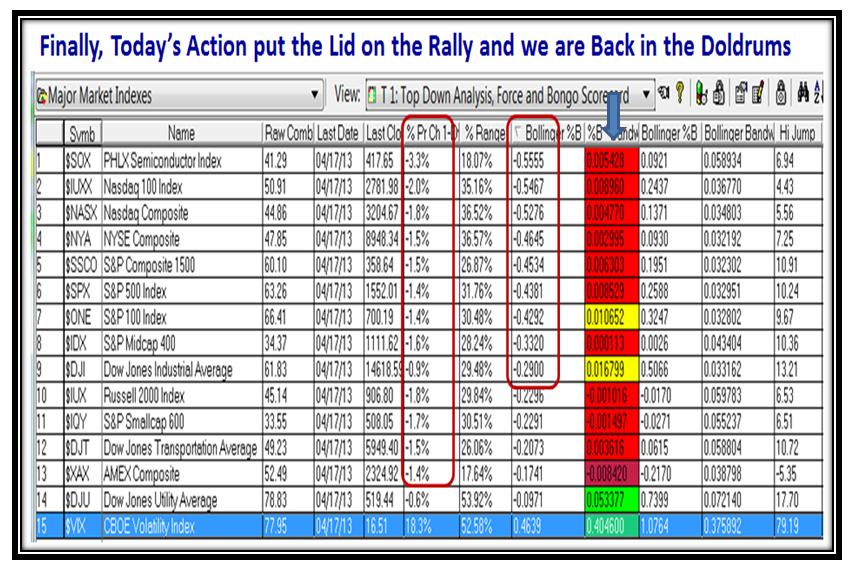
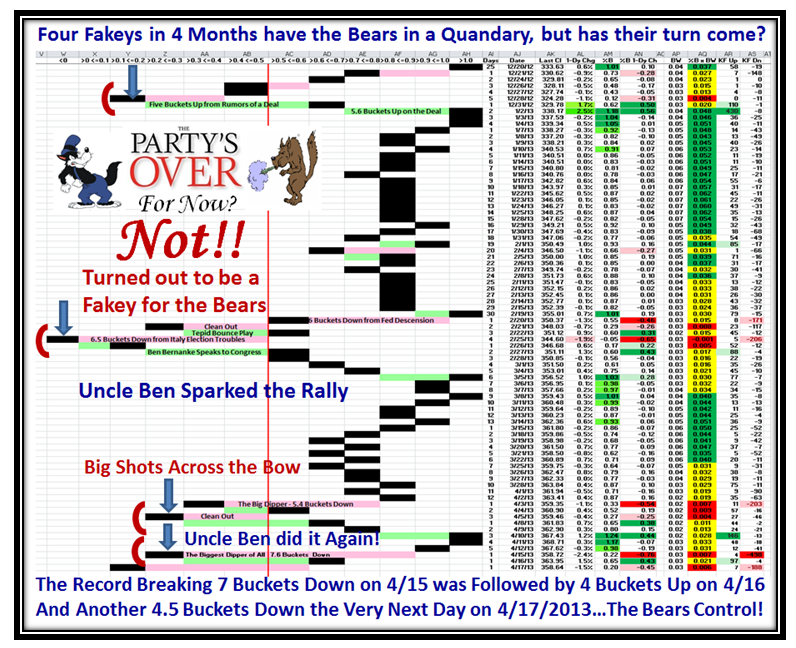
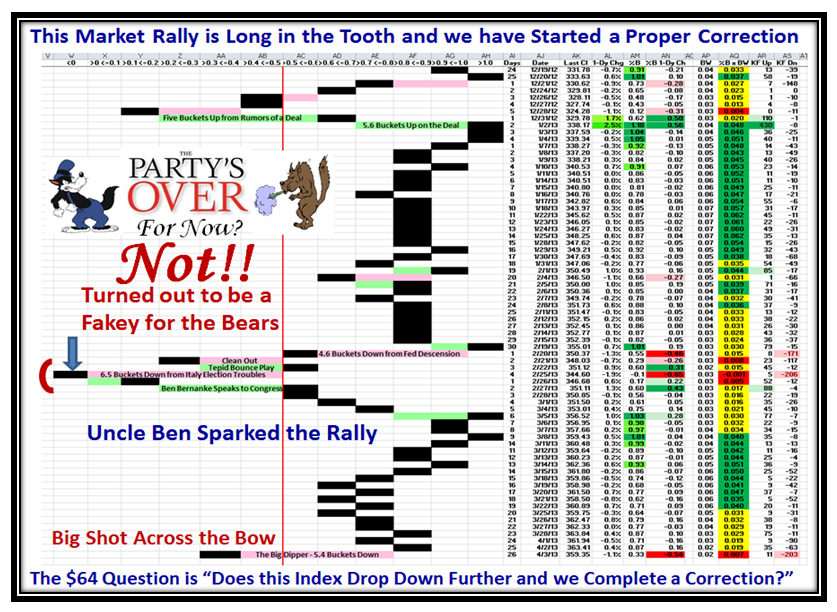
Saturday, April 27th, 2013

Every time the Bears feel they have collared this Market by the neck, it bounces back to the point where Fat Tails in the Bollinger Bands vernacular are now gradually turning to Long Tails.  Here we are but a week away from May when the traditional saying of “Go Away in May and come back in October” is much on the lay peoples’ mind like you and I to make sure we protect our well earned nest egg.  We are looking for every clue that finally the Big Guns have lowered the Boom and to avoid being trampled on when there is a mass exit.

Tails Picture

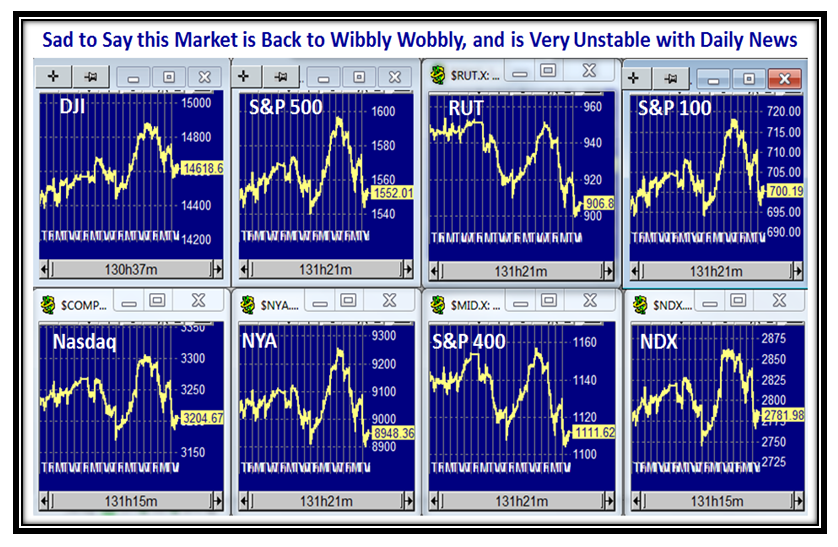
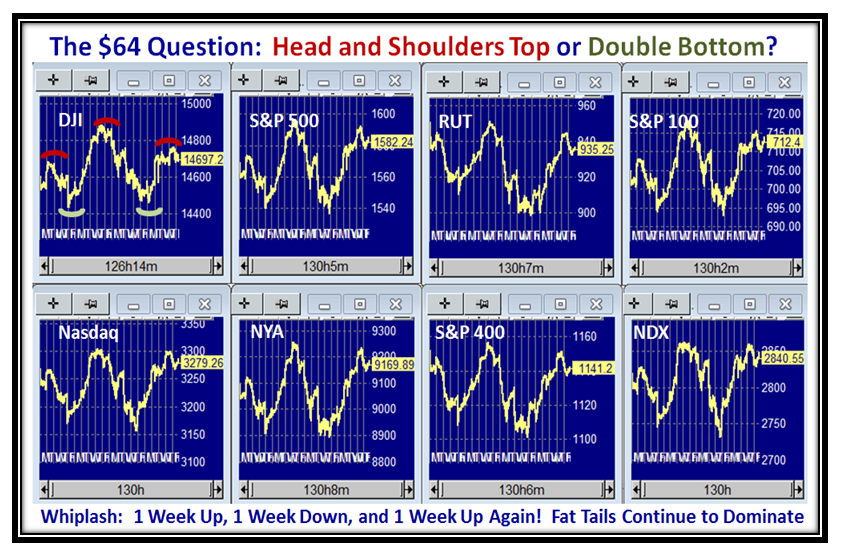
Not only do we see whipsaws with 1 Week Up, 1 Week Down and then 1 Week Up again, but one can’t help being whiplashed and only very short term players are making good returns if they can consistently stay on the right side of the Market.  The chart patterns for the Market Indexes show the quandary of either hitting a Double Bottom or a Head & Shoulders Top.   Each Blog Note I suggest that surely the next week will resolve the direction only for us to find it is drawn out for yet another week, while the Market Indexes continue to inch up and regain the losses of the previous week!   Rounded Tops is the name of the game, but this time these Fat Tails are gradually giving way to Long Tails.

Tails Indexes

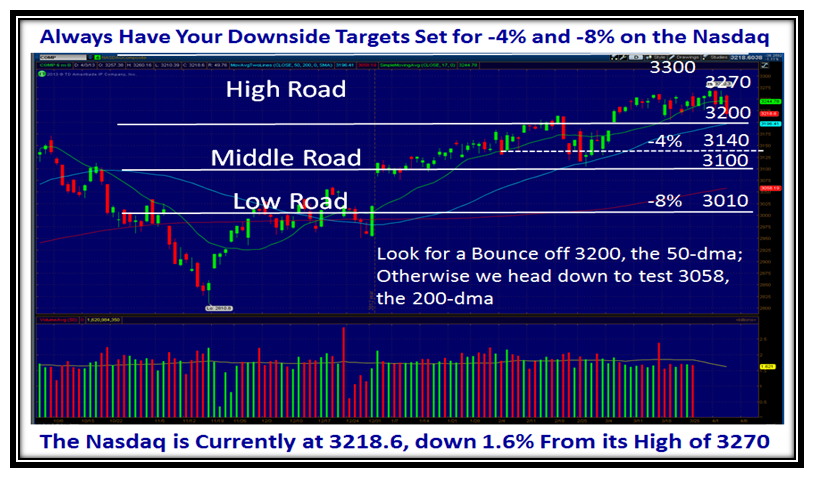
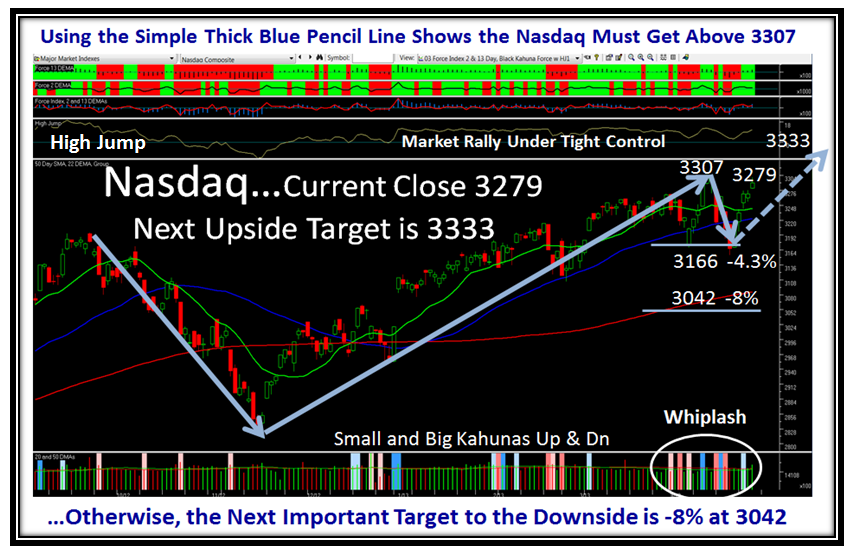
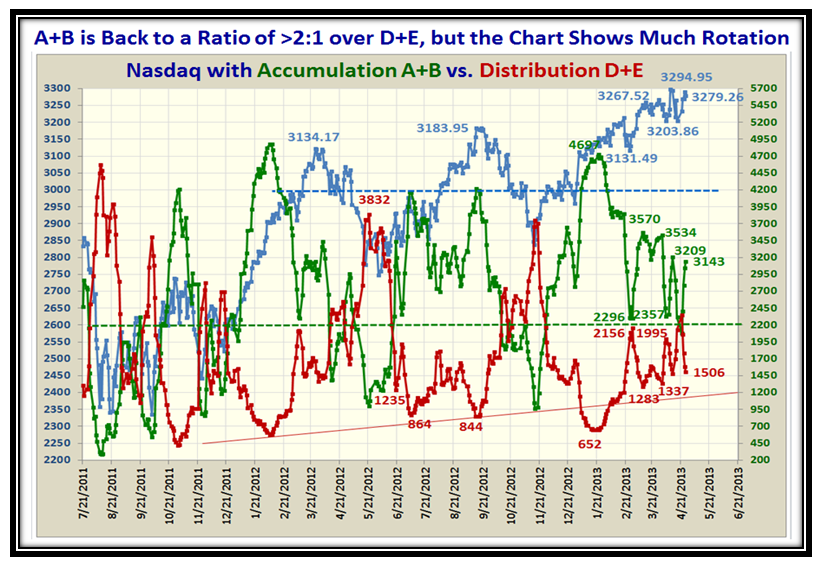
I have laid out the High, Middle and Low Road Scenarios using the Nasdaq in the following chart.  I have shown you that -4% is the first port of call to the Downside and that is exactly what happened in the drop from the high of 3307 down to 3166, which was just below the previous low.  This leads to the simple technique of using the Thick Blue Line to draw it from the Low back last mid-November to the recent high and then one down as shown , since it broke the previous low of a couple of weeks ago.  If the Market trots down again, that yardstick of 3166 becomes the Middle Road Scenario.  Anything below that level we look to the Low Road Scenario at around the -8% mark which also happens to be around the 200-dma.  The High Road requires us to get above the previous old high and aim for the Higher Jump Target for the Nasdaq at 3333…a convenient number to remember.  Anything less is essentially tantamount to Head and Shoulders Top…between friends!

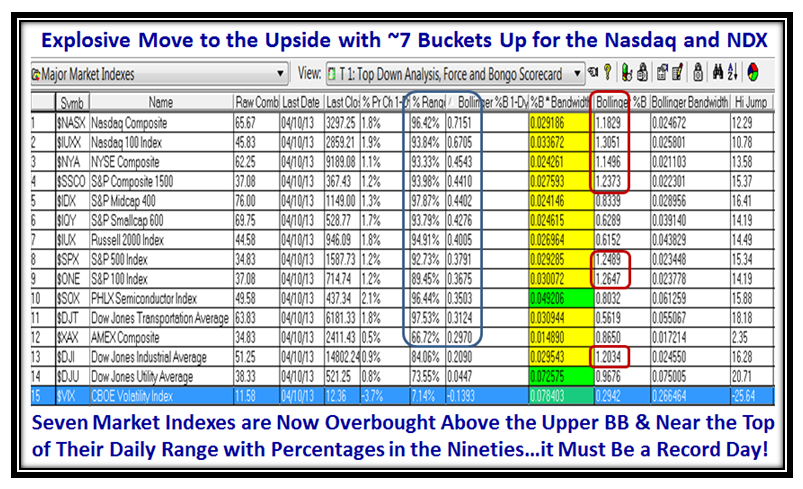
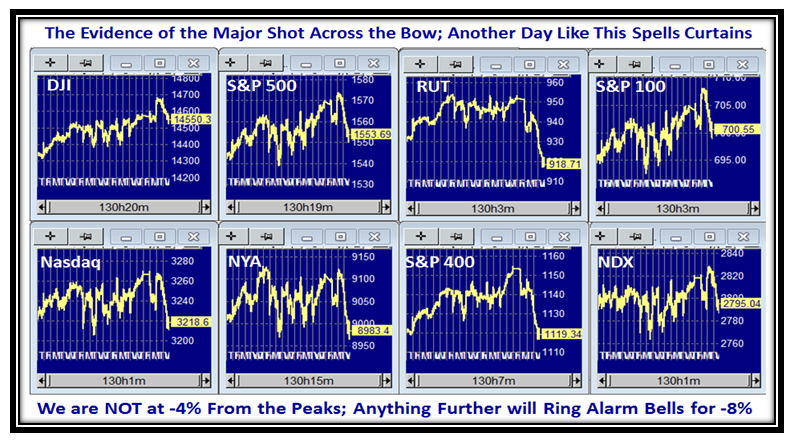
I spoke of Whiplash earlier…well there it is staring us in the face with both Up and Down Small and Big Kahunas.  Now cast your beady eyes on the window with the High Jump and note how the line is essentially flat while the Index itself has trotted upwards.  I infer that this Market is under tight control and that by and large the giddy ups and downs are completely News Driven almost from day to day.  With the little guys essentially out of the market, given the Low Volume the Indexes record each day, the High Frequency Traders are having fun especially when we see what happened in the Market Indexes over 4 minutes due to a false rumor of an attack on the White House!

Tails Nasdaq

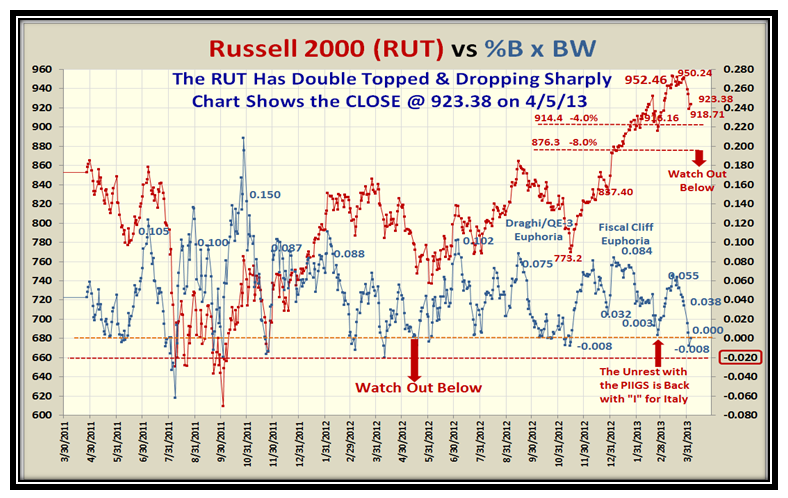
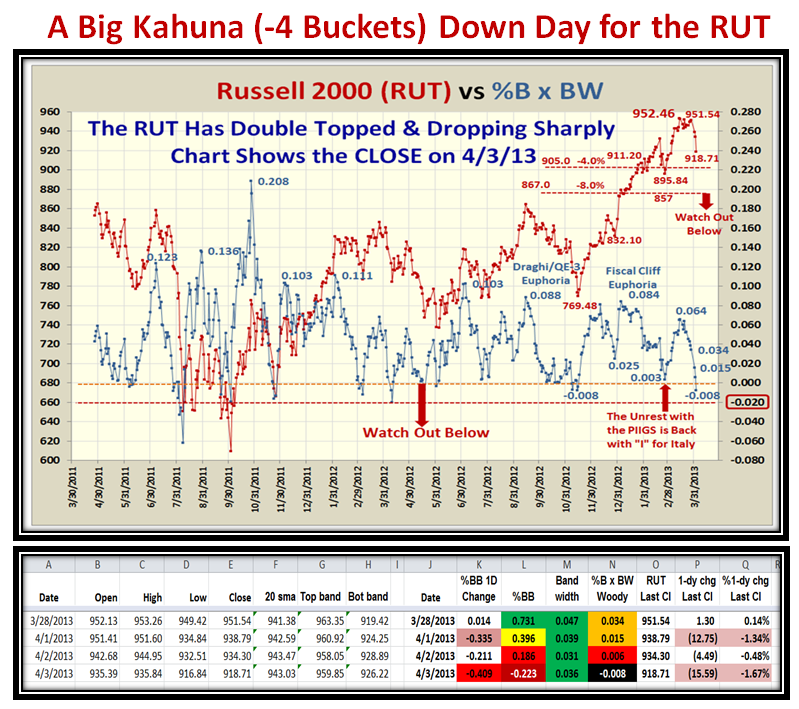
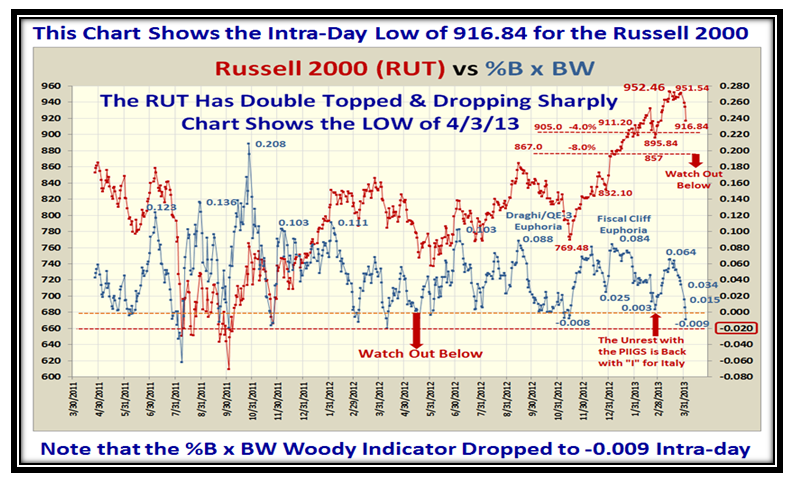
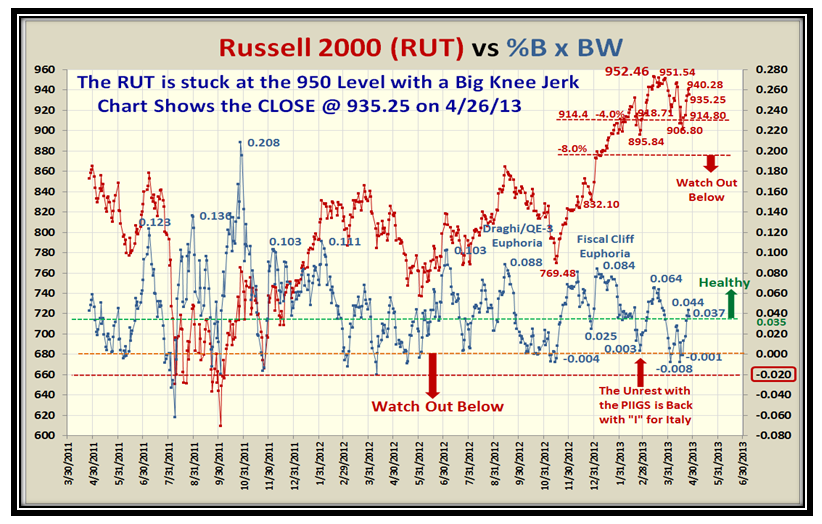
Again, the Russell 2000 (RUT) shows the struggle it has had over the last couple of months, and unless there is a decisive breakout above 953, we will head down into the doldrums again:

Tails RUT

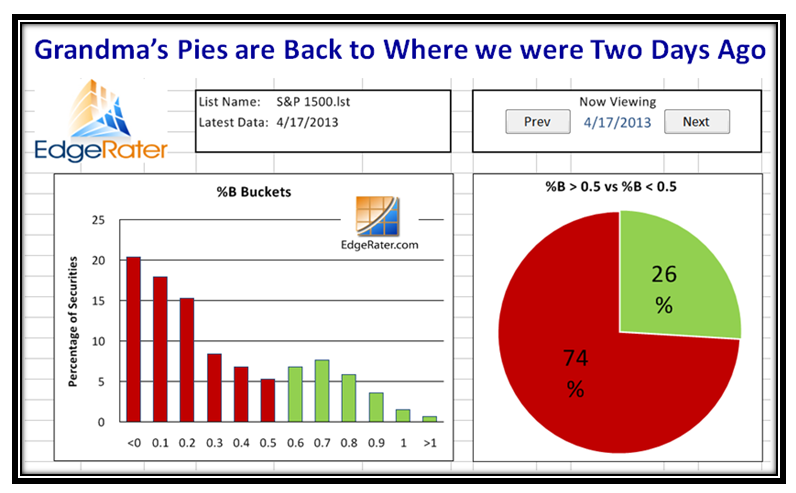
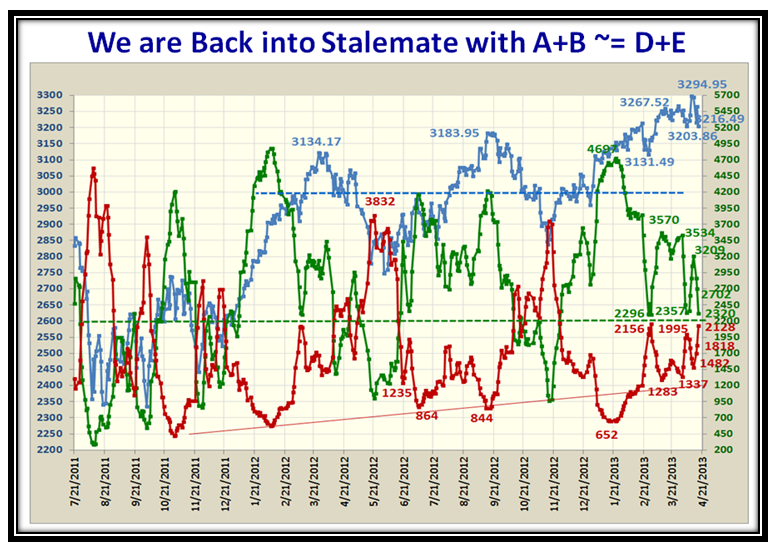
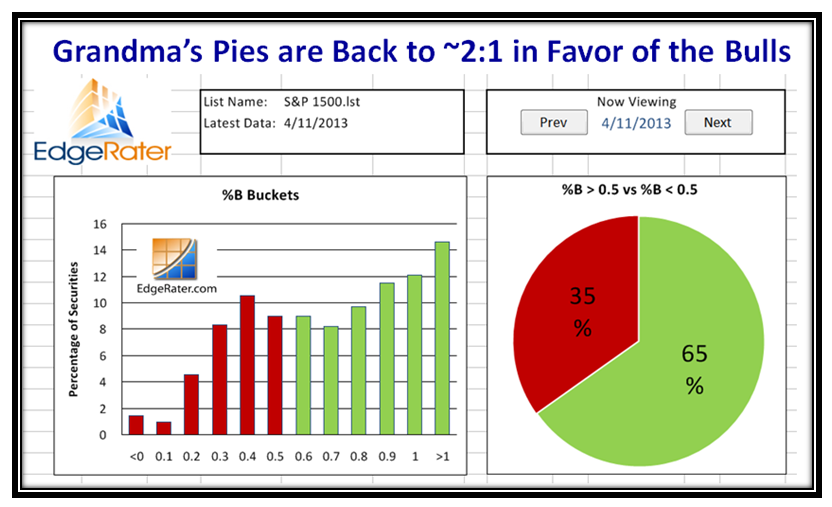
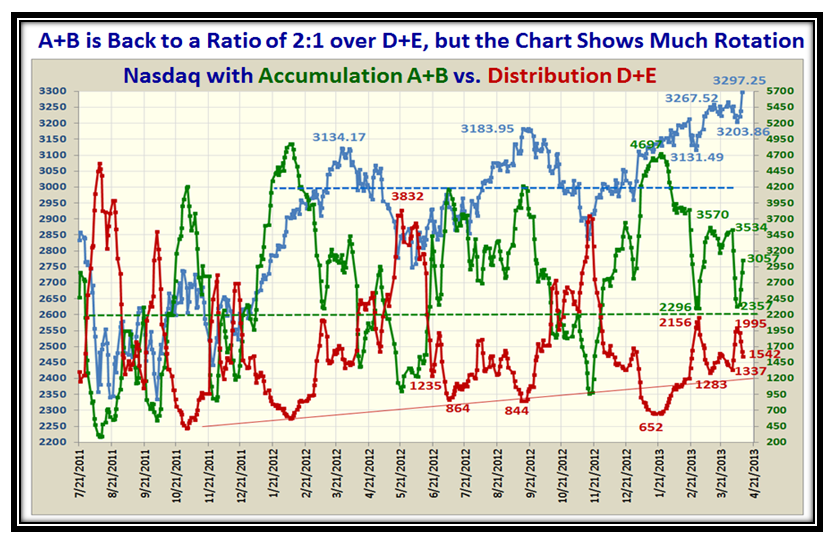
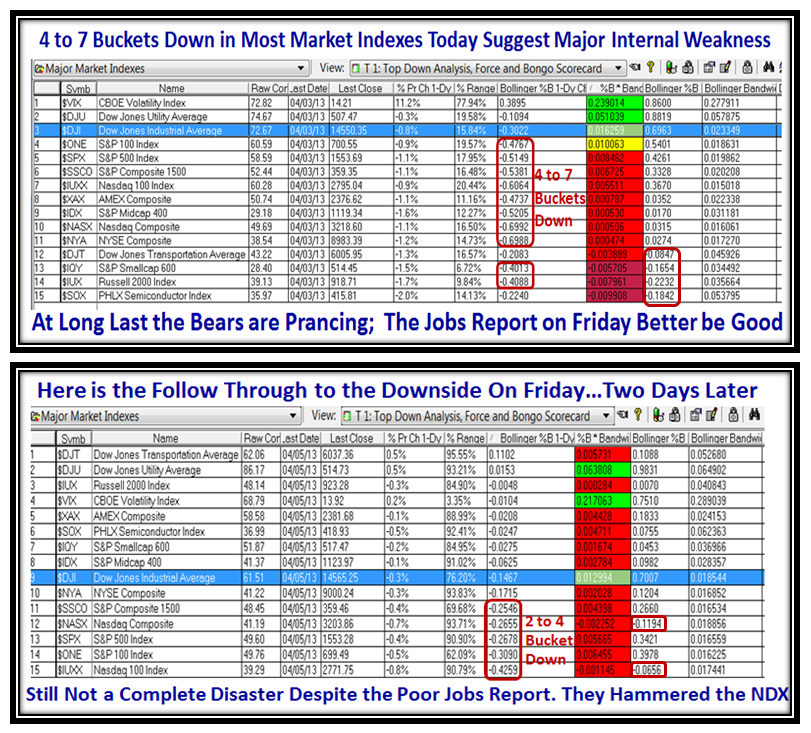
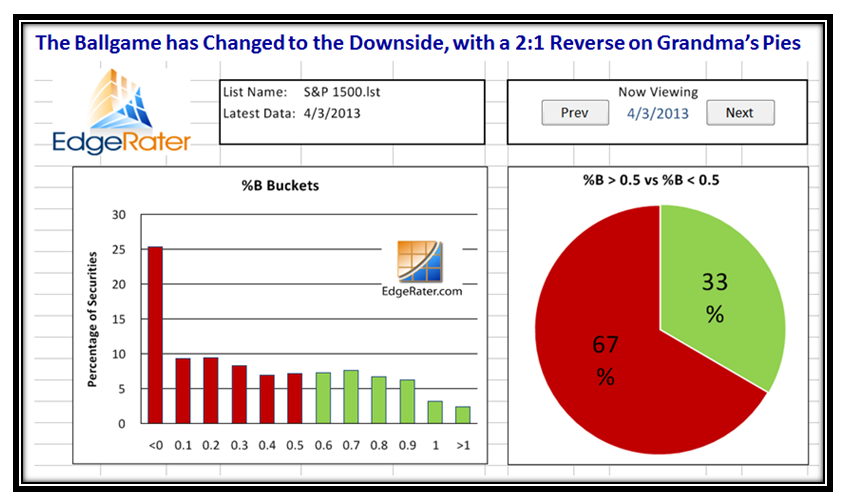
It is no surprise that the Accumulation versus Distribution is back once again to a 2:1 ratio, but the yin-yang is very evident now:

Tails acc

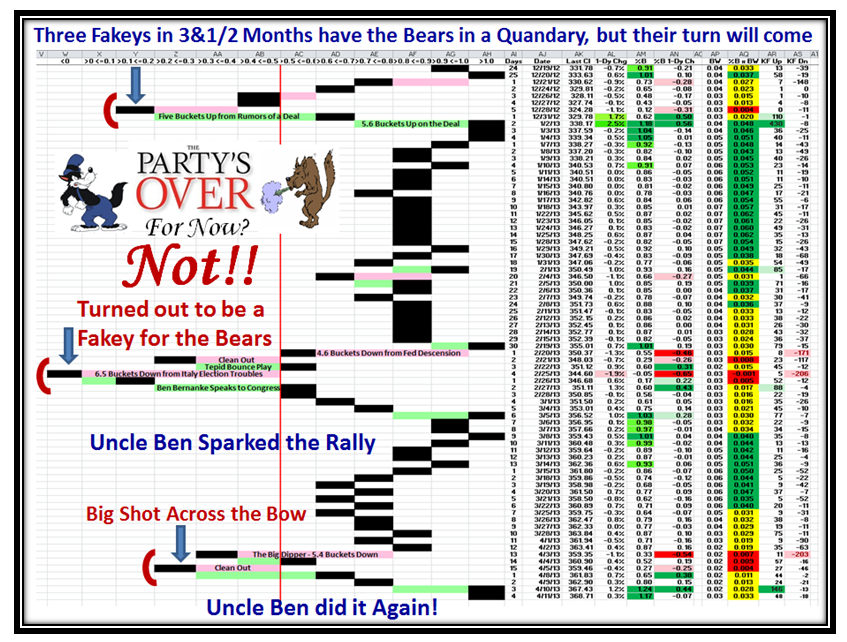
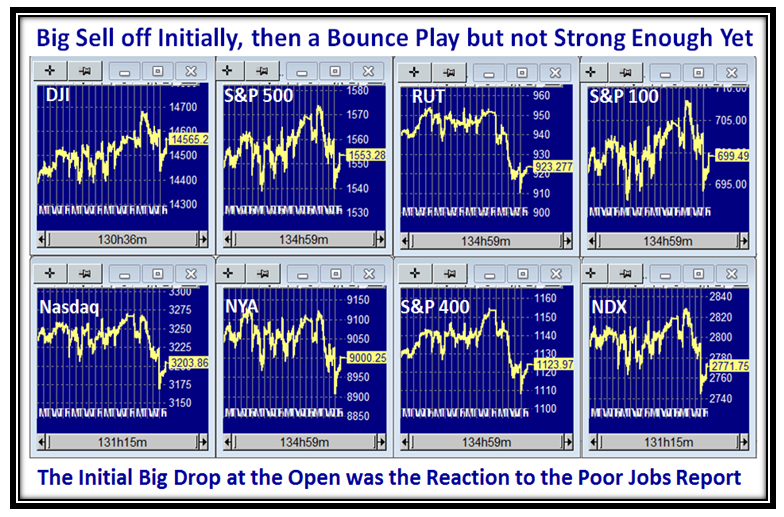
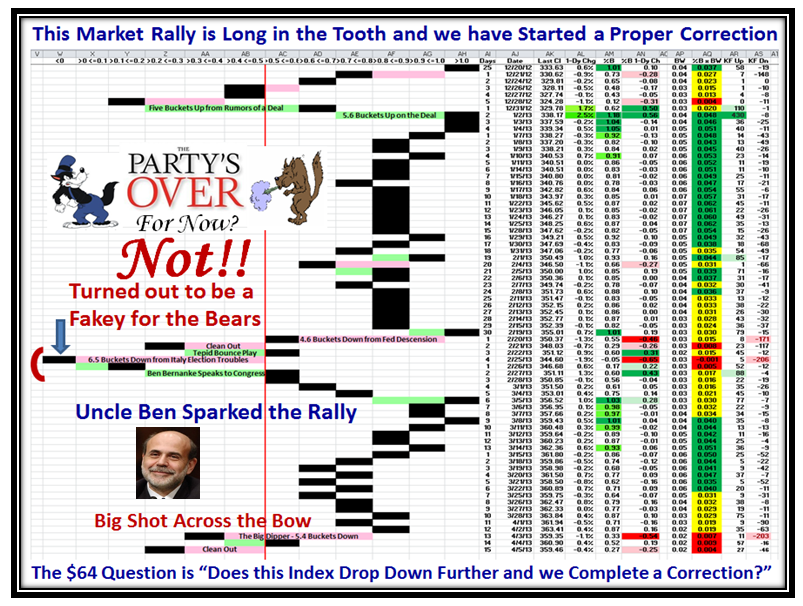
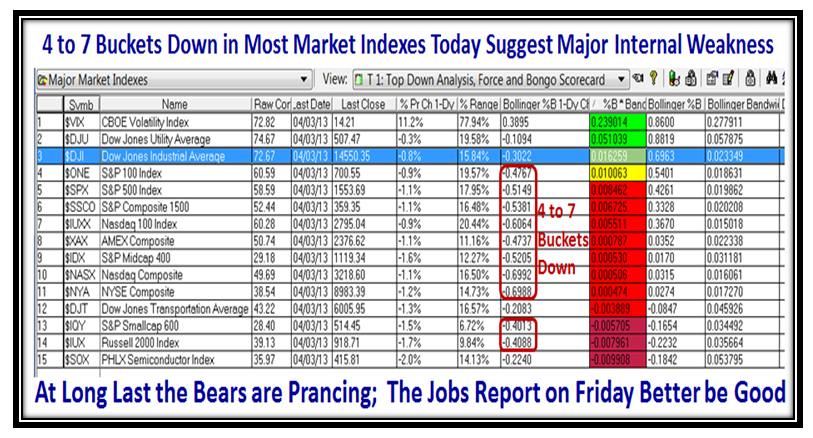
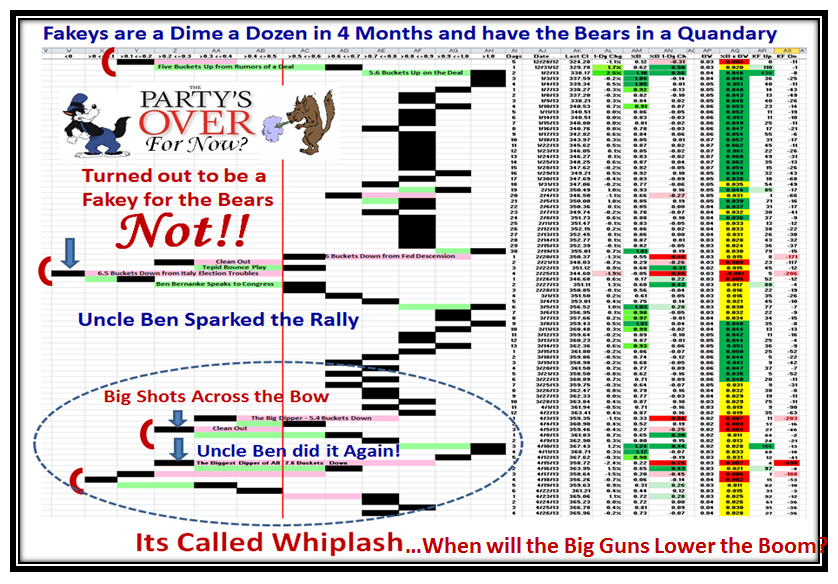
This next chart needs no explanation, as it shows the whiplash we have suffered this past month:

Tails Pat

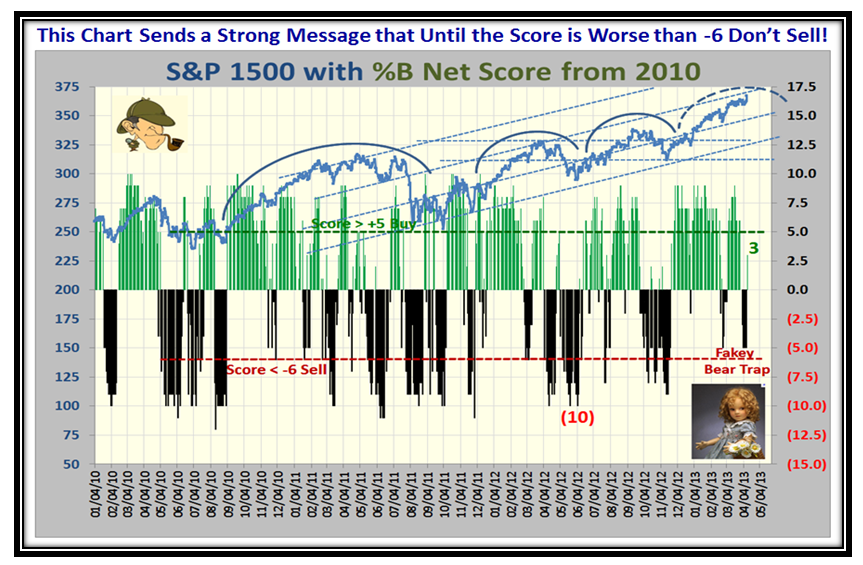
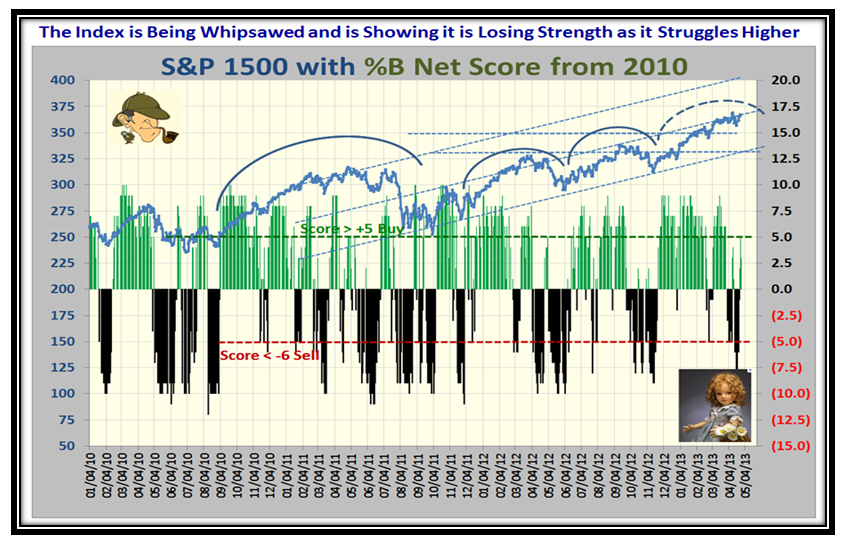
…And this chart confirms the struggle the S&P 1500 is having as it drives to new highs:

Tails Pat2

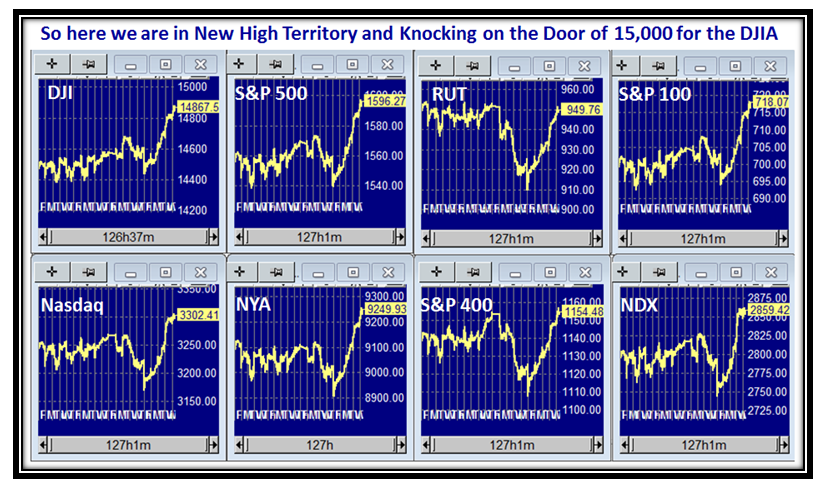
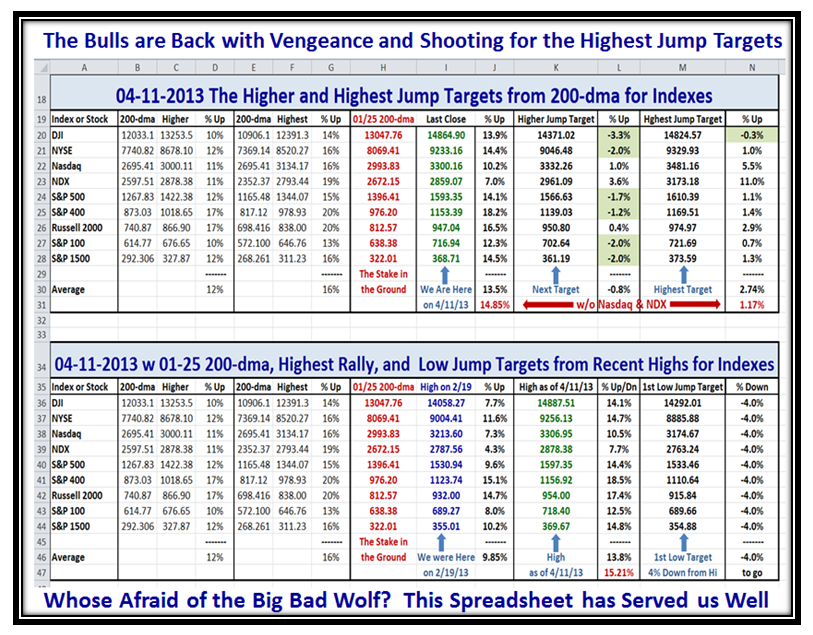
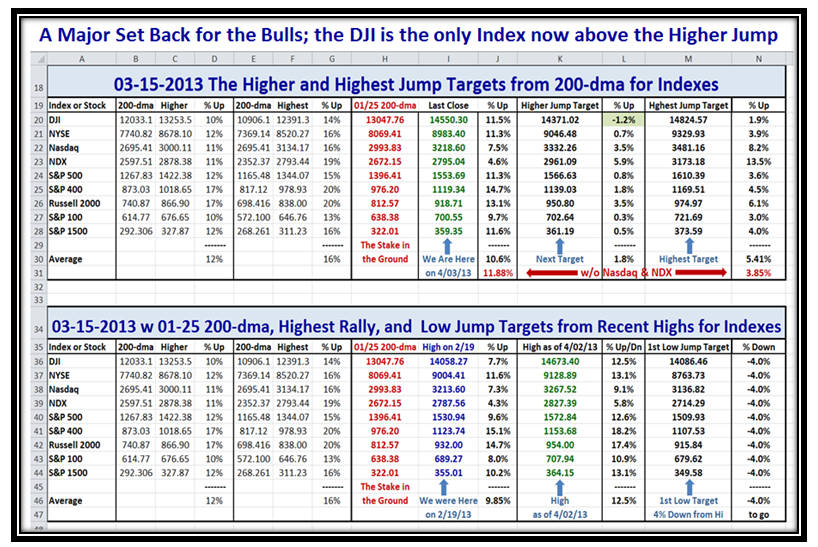
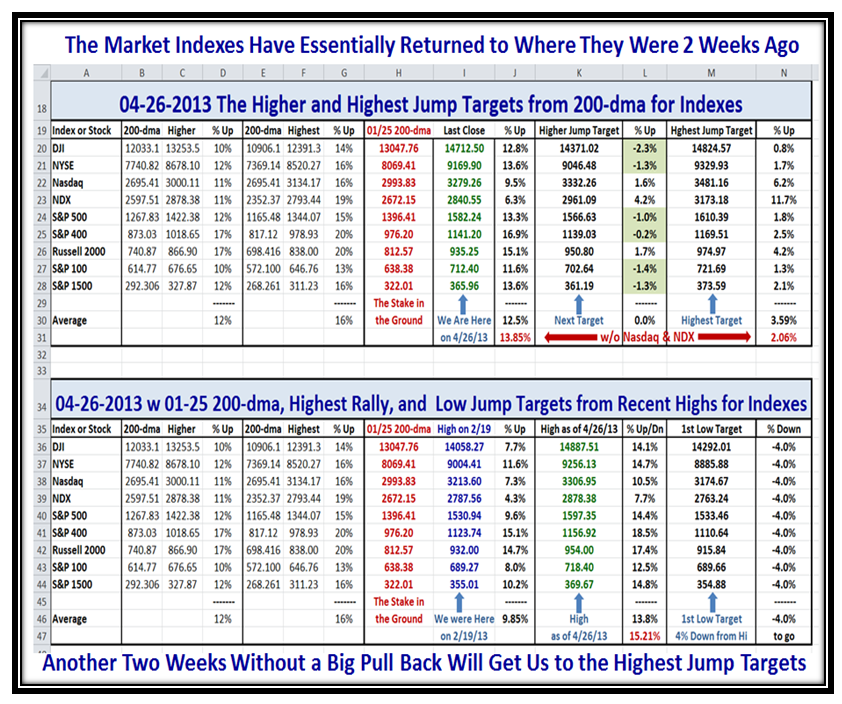
I felt you would like to see an update on the High Jump progress, and the bottom line is that we are back to about where we were two weeks ago with most Indexes having got back past their Higher Jump Targets:

Tails Jump

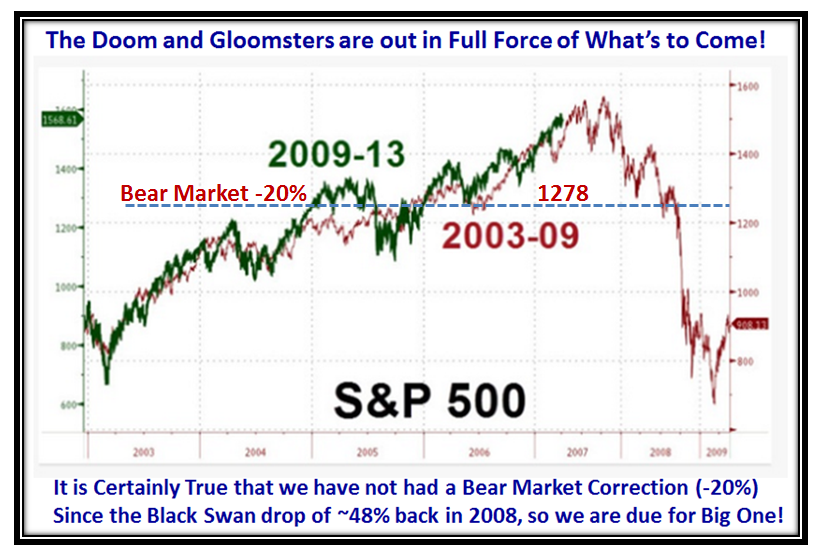
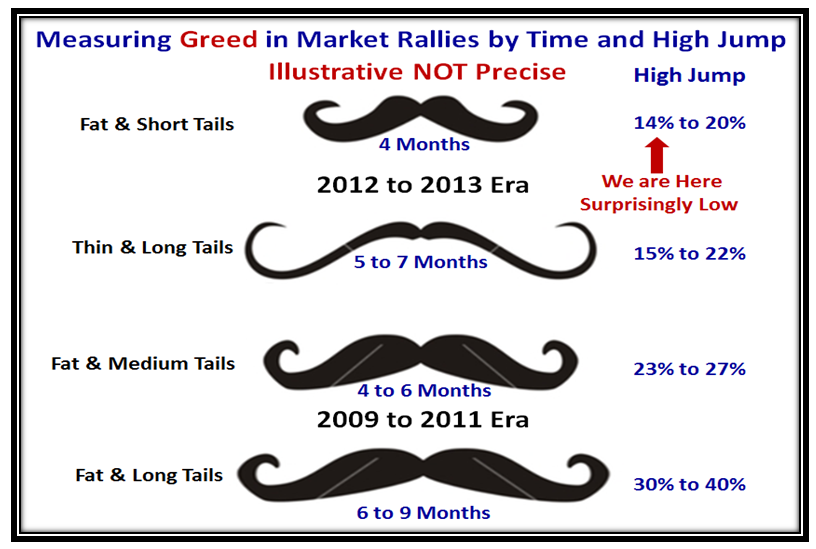
Finally, I hope this last chart will bring a smile to your face as we look at how to measure GREED in Market Rallies by both Time and the High Jump.  Note that the 2009 to 2011 era was much more rewarding and robust than the past two years and especially right now for all the reasons I have shown you above.  The numbers are meant to be illustrative and not precise though they attempt to show the two different eras based on past history:

Tails Handlebars

Good luck in the coming weeks, and let me know if this has stimulated you in your own research as to where we stand in this foggy Market!

Best Regards,

Ian.

Stock Market: Floodgates Opened Wide!

Wednesday, April 17th, 2013

After a week of turmoil both up and down, today’s action has given control to the Bears, but with the craziness of the Market we shall see where we go next:

Party Picture

Yes. most of you understand that Emotion Rules the Market, and the pictures I use to define Greed on the one hand and Fear on the other, but as you well know when the floodgates open to the downside, your Nest Egg gets killed:

Party Emotion

It goes without saying that I have built much of my process based on John Bollinger, and it didn’t take me long to see that the big pay dirt is at the Extremes of Fear and Greed.  We know how to perform in between, but the stomachs come into play at the extremes , and I hope I help you most at such extremes:

Party Normal

A year ago, John Bollinger reminded me at times like this when markets get Overbought or Oversold they can remain that way for long periods of time before they break or rise again, and he calls them Fat Tails…so I fed him this as my version with tongue in cheek!

Party Tails

We have not seen a Market like this and short term Players can enjoy the volatility of a totally news-driven Market:

Party Indexes

Let me show you the Explosive Growth we saw in the Indexes just seven days ago and then what transpired since:

Party Buckets Up

Just focus on the columns I have highlighted to get the pulse of the Market in two minutes.  Here is Five days later:

Party Buckets Dn

The very next day, the Indexes bounced back and things were looking better for the rally continuing:

Party Buckets Up2

…And here we are one day later and completely down in the Doldrums again:

Party Buckets Dn2

Net-net, this market is in total oscillation and wildly so…results not seen in 13 Years of History;  this speaks volumes:

Party Pat

…And here is Grandma’s Pies just back to two days ago:

Party Pies

…And finally, here is the spaghetti of the A+B vs. D+E scenario…back to Stalemate:

Party Acc

Keep your Powder Dry and the Best of Luck,

Ian

Stock Market: Fool Me Twice, Shame On Me!

Thursday, April 11th, 2013

Yes, you guessed it, Uncle Ben did it again and the Bears are wondering what hit them.  Their turn will come sooner or later but for now we are back to New Highs and flying high:

Fool Picture

We have now had several different occasions where Big Knee Jerks are followed immediately by huge recoveries in the Market Indexes but where Volume by and large has been relatively sluggish while the Indexes trot up to New Highs:

Fool Indexes

This next chart is an Eye Opener with explosive moves in all Market Indexes to the upside yesterday.  There are now seven Indexes in Overbought territory, and following through again today but as one would expect not quite the same enthusiasm:

Fool Explosive

Grandma’s Pies are back to being healthy with ~ 2:1 in Favor of the Bulls:

Fool Pies

It is difficult to stay calm when we have these earth shattering days with big yo-yos in the Market Indexes, but it seems of late that when the %B Net Score is no worse the -5 it pays to wait for the next day before acting.  However, this is probably a situation of the times we live in where any bit of news around the world can cause the markets to go into a tail spin or reach for the stars almost on a day to day basis:

Fool Score

Uncle Ben used his magic wand again and drove the Market back up to Overbought in three days flat…we now show three Fakeys, all within the span of 3&1/2 months which leaves the Bears in a quandary…but one of these days their turn will come:

Fool Piat

Naturally, with all this turmoil from day to day the Acc/Dist Ratio wobbles all over the place, but at present it shows bullish favor:

Fool Acc

It goes without saying that the DJIA is riding highest of all the Market Indexes.  We can see from the following chart that it has now surpassed the Highest Jump Targets and that five more are only <1.5% of doing the same.

Fool SS

Of course, all good things eventually come to an end and few would disagree that we need some form of decent correction before one should reasonably expect to continue with a rally that is now all of four years old with corrections no worse than ~17% along the way.  Whether we shall see a Bear Market Correction of >20% is in the lap of the gods, but note that the Doom and Gloomsters are  out in full force touting the worst is yet to come.  I have added the line for a Bear Market Correction of -20% on the S&P 500 which is 1278 so we will make that a stake in the ground once the correction is underway.

Fool Doom

Play close to your vest, and enjoy the move up while you can.

Best Regards,

Ian.


Stock Market: Floodgates Opening, but No Panic Yet

Sunday, April 7th, 2013

As expected the poor Jobs Report on Friday took the Market down big time at the open, but there was a respectable Bounce Play from the lows.  However, it was not nearly enough to stem the tide and with the S&P 1500 losing another 2.5 Buckets to the downside on top of the 5.4 Buckets two days previously, the Bulls are hanging on with their finger nails.  This next week will tell:

Floodgates Picture

The knee jerk on Friday is obvious from the next Chart of the Market Indexes:

Floodgates Indexes

The Russell 2000 (RUT) has given up around 3% from its high and has shown its teeth with a drop of %B x BW to below Zero:

Floodgates RUT

The turbulence is evident from our next chart of the damage done to the S&P 1500 these past three days:

Floodgates Pat

I have picked up on a view which I introduced to you in my last Blog Note and hope you will use this to stay on top of the right side of the Market and to understand the shifting winds as we go into the next week using the HGSI software.  There is a lot on information at a glance with this view using the Major Market Indexes with the T1 view in Warehouse:

1.  We had 5 Indexes take a > -0.24 Hit on Friday, with the NASDAQ 100 going down over 4.25 buckets.

2.  We have two indexes, the NASDAQ and NDX, both below the lower Bollinger Band

3.  They ran for cover in the Transports and Utilities on Friday

Floodgates Indexes2

Now for a look at the top two canaries, one gasping and the other healthy…AAPL and GOOG, respectively:

Floodgates Canaries

AAPL’s performance has been worse than dismal and is down about 40% from its high.  Maybe it is finding its bottom, but sad to say with this recent performance it has given up its leadership to GOOG.  However, you must still follow it as its weight on the NASDAQ and NDX Indexes is so out of proportion compared to the rest of the stocks that its movement will influence these Indexes both ways:

Floodgates AAPL

Now, let’s look at GOOG which is behaving substantially better, with the Canary still sitting up and chirping…it is the leader now:

Floodgates GOOG

We shall see if the Floodgates open wide next week or the Bulls come charging back to produce another Fakey!!

Best Regards,

Ian

Stock Market: Major Shot Across the Bow

Wednesday, April 3rd, 2013

Yes, this was a Major Shot Across the Bow as the Market Indexes dropped down for most of the day.  Net-net the Bears had control today, and we shall see if they can continue to take the Market down:

Bow Picture

This next Chart shows the damage done today in the Major Market Indexes:

Bow Indexes

Most of the Indexes suffered greater than 4 Buckets to the Downside, and the RUT was one of them:

Bow RUT

…and here is the picture for the LOW of the day with the RUT.  Richard B. from Thailand taught me back in November to keep a beady eye for the %B x BW to fall below “Zero”, so both these charts are a tip of my hat to him, as they don’t get below this level more than twice in any one year.

Bow RUT2

It’s now time to pay attention to the downside targets from the Highs.  I’m sure you know by now the natural targets are -4% and then -8%, so here are the Measuring Rods using the Nasdaq:

Bow Nasdaq

Here is the picture in a nutshell of the damage done today as portrayed by the HGSI Software:

Bow Bollinger

This picture of Grandma’s Pies clinches the story for you with a 2:1 ratio to the downside:

Bow Pies

That 5.4 Buckets down on the S&P 1500 says it all, and now we have to wait and see if the Bears can really take control and take this Market into a full correction, or whether this was only a flea bite:

Bow Pat

It goes without saying that the road to the Highest Jump Targets were hit hard today and as a result we have only the DJIA Above the Higher Jump Target, whereas there were seven just a couple of days ago:

Bow Spreadsheet

Please remember that the Jobs Report comes out on Friday and we shall see where this Market goes.

Best Regards,

Ian

Copyright © 2007-2010 Ian Woodward
Disclaimer: Commentaries on this Blog are not to be construed as recommendations to buy or sell the market and/or specific securites. The consumer of the information is responsible for their own investment decisions.