Stock Market: Fat Tails Starting to Get Longer
Every time the Bears feel they have collared this Market by the neck, it bounces back to the point where Fat Tails in the Bollinger Bands vernacular are now gradually turning to Long Tails. Here we are but a week away from May when the traditional saying of “Go Away in May and come back in October” is much on the lay peoples’ mind like you and I to make sure we protect our well earned nest egg. We are looking for every clue that finally the Big Guns have lowered the Boom and to avoid being trampled on when there is a mass exit.
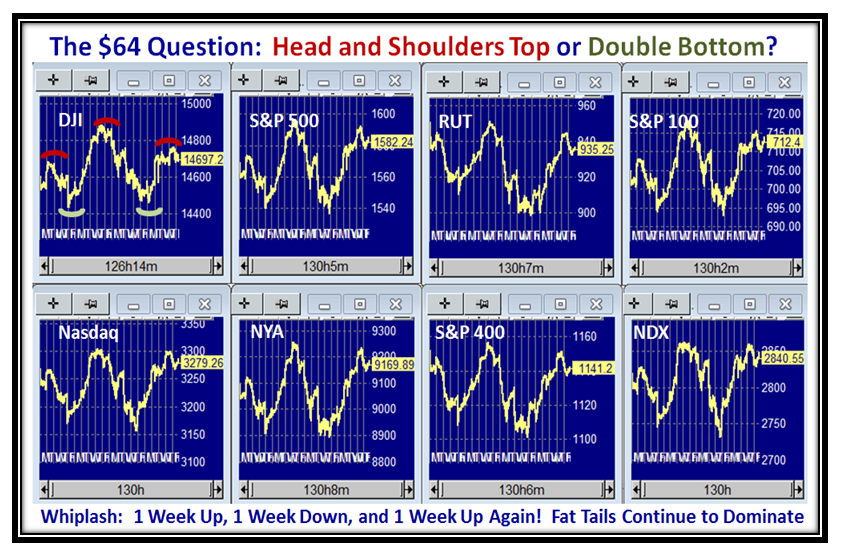
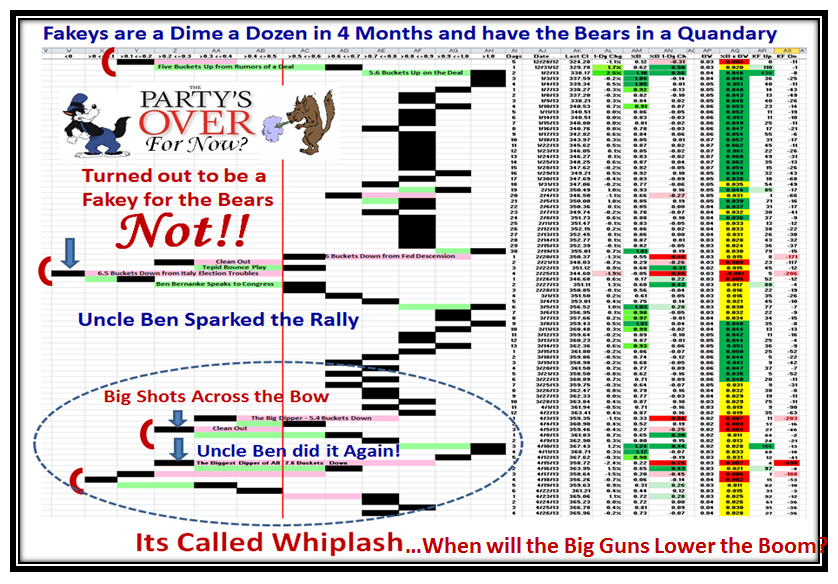
Not only do we see whipsaws with 1 Week Up, 1 Week Down and then 1 Week Up again, but one can’t help being whiplashed and only very short term players are making good returns if they can consistently stay on the right side of the Market. The chart patterns for the Market Indexes show the quandary of either hitting a Double Bottom or a Head & Shoulders Top. Each Blog Note I suggest that surely the next week will resolve the direction only for us to find it is drawn out for yet another week, while the Market Indexes continue to inch up and regain the losses of the previous week! Rounded Tops is the name of the game, but this time these Fat Tails are gradually giving way to Long Tails.
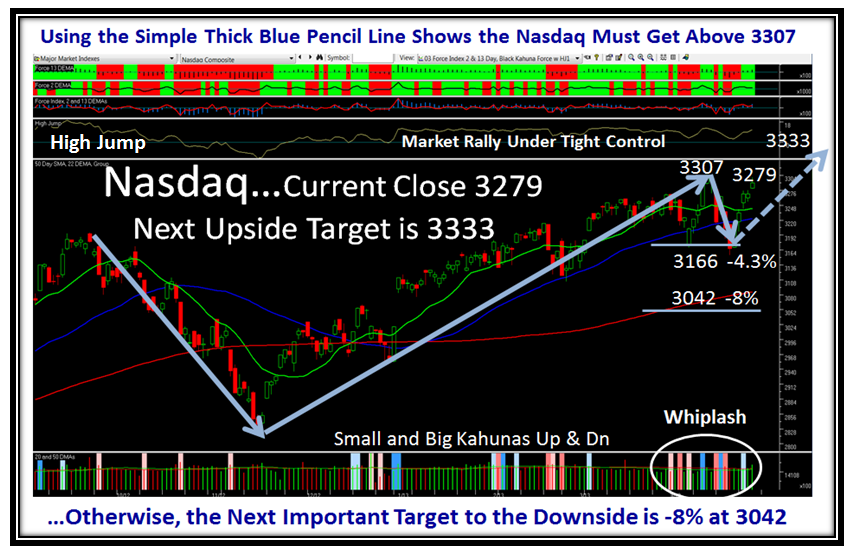
I have laid out the High, Middle and Low Road Scenarios using the Nasdaq in the following chart. I have shown you that -4% is the first port of call to the Downside and that is exactly what happened in the drop from the high of 3307 down to 3166, which was just below the previous low. This leads to the simple technique of using the Thick Blue Line to draw it from the Low back last mid-November to the recent high and then one down as shown , since it broke the previous low of a couple of weeks ago. If the Market trots down again, that yardstick of 3166 becomes the Middle Road Scenario. Anything below that level we look to the Low Road Scenario at around the -8% mark which also happens to be around the 200-dma. The High Road requires us to get above the previous old high and aim for the Higher Jump Target for the Nasdaq at 3333…a convenient number to remember. Anything less is essentially tantamount to Head and Shoulders Top…between friends!
I spoke of Whiplash earlier…well there it is staring us in the face with both Up and Down Small and Big Kahunas. Now cast your beady eyes on the window with the High Jump and note how the line is essentially flat while the Index itself has trotted upwards. I infer that this Market is under tight control and that by and large the giddy ups and downs are completely News Driven almost from day to day. With the little guys essentially out of the market, given the Low Volume the Indexes record each day, the High Frequency Traders are having fun especially when we see what happened in the Market Indexes over 4 minutes due to a false rumor of an attack on the White House!
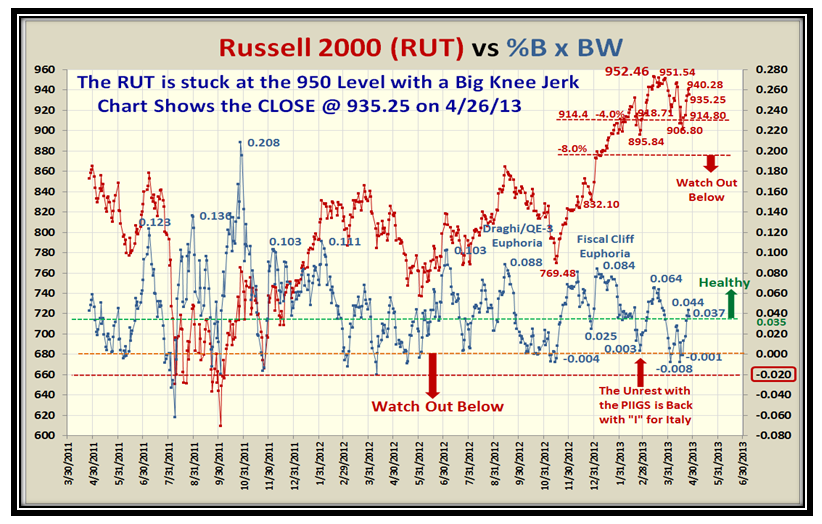
Again, the Russell 2000 (RUT) shows the struggle it has had over the last couple of months, and unless there is a decisive breakout above 953, we will head down into the doldrums again:
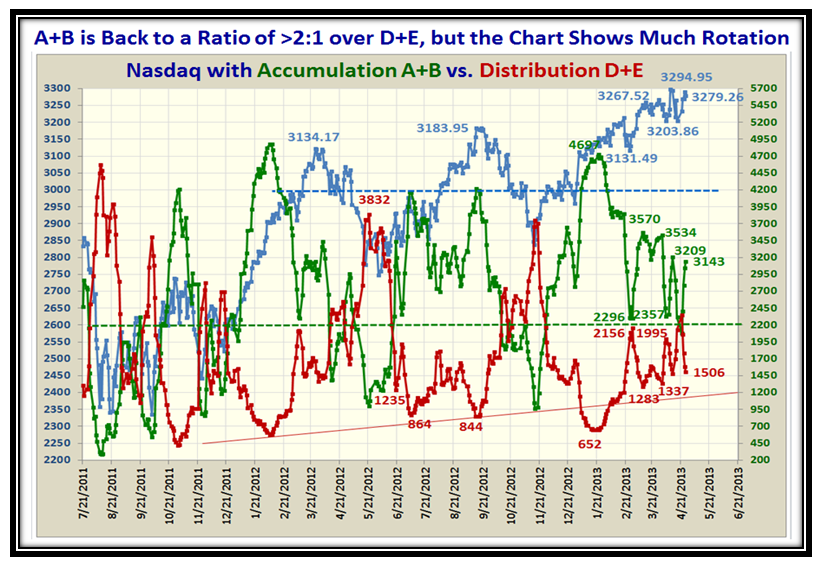
It is no surprise that the Accumulation versus Distribution is back once again to a 2:1 ratio, but the yin-yang is very evident now:
This next chart needs no explanation, as it shows the whiplash we have suffered this past month:
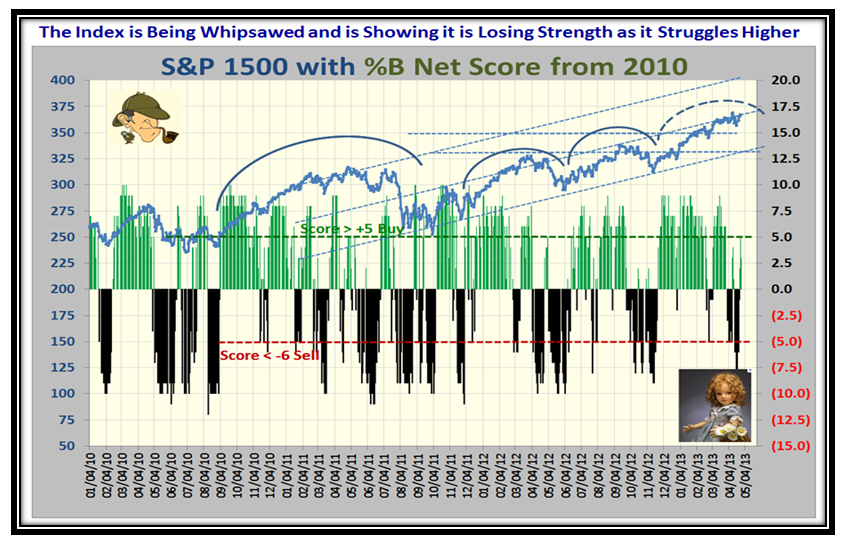
…And this chart confirms the struggle the S&P 1500 is having as it drives to new highs:
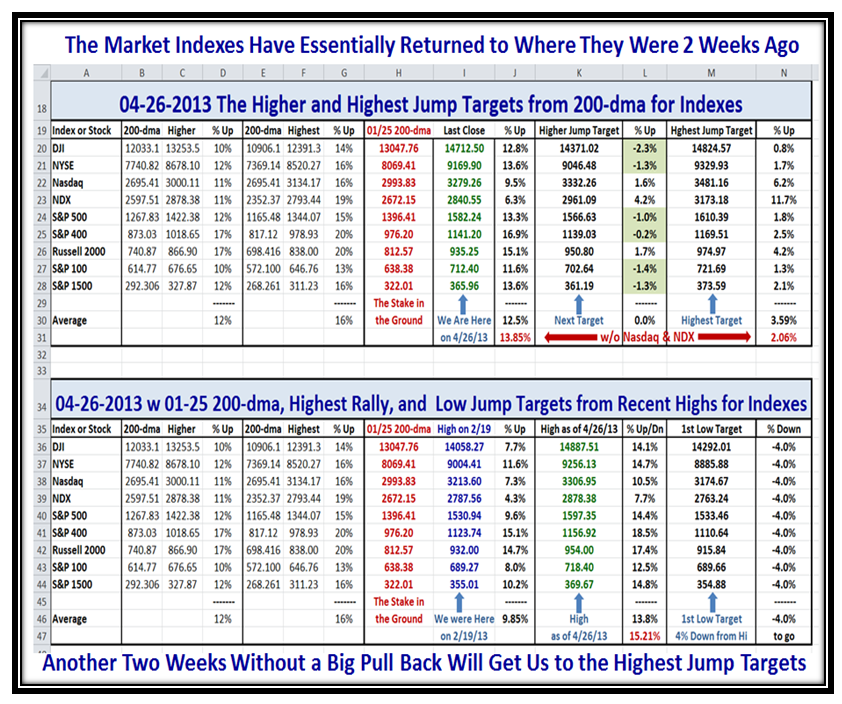
I felt you would like to see an update on the High Jump progress, and the bottom line is that we are back to about where we were two weeks ago with most Indexes having got back past their Higher Jump Targets:
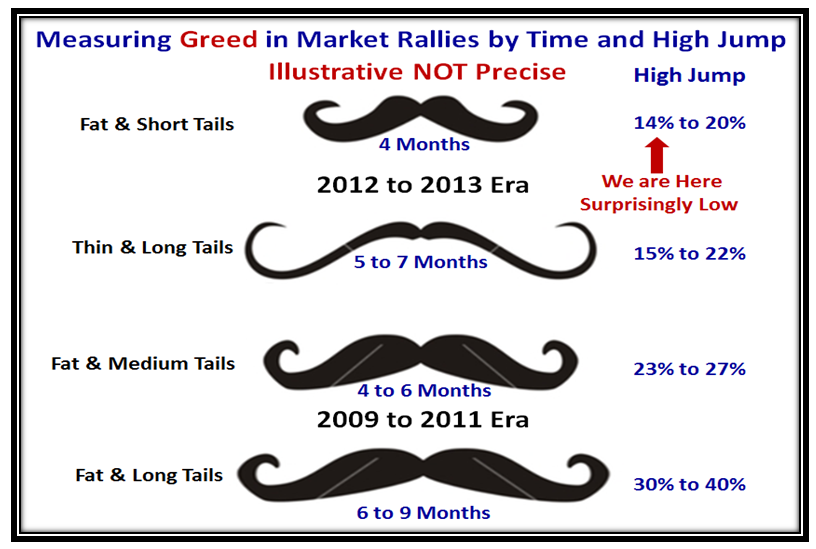
Finally, I hope this last chart will bring a smile to your face as we look at how to measure GREED in Market Rallies by both Time and the High Jump. Note that the 2009 to 2011 era was much more rewarding and robust than the past two years and especially right now for all the reasons I have shown you above. The numbers are meant to be illustrative and not precise though they attempt to show the two different eras based on past history:
Good luck in the coming weeks, and let me know if this has stimulated you in your own research as to where we stand in this foggy Market!
Best Regards,
Ian.
 Ian Woodward's Investing Blog