 Ian Woodward's Investing Blog
Stock Market: Wonders Never Cease!
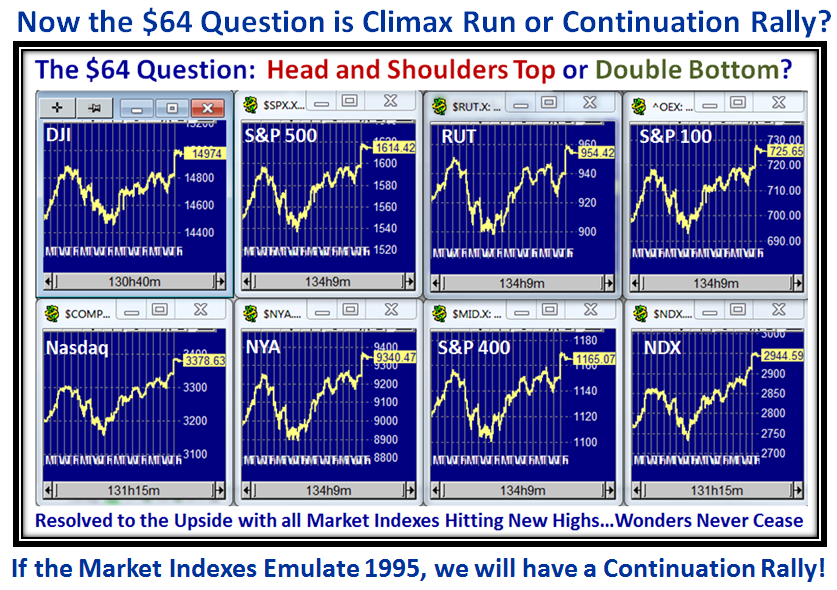
I need hardly say that any of us expected we would be hitting new highs with a resounding move upwards for the Bulls to continue this long Rally essentially since mid-November.

…And here is the picture of the Market Indexes which show the explosive breakout the last couple of days:
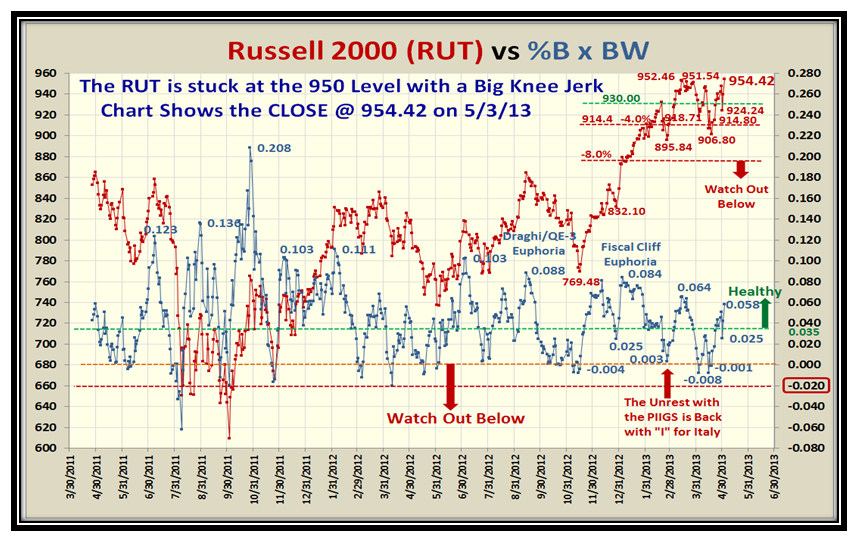
As we well know the Small Cap Stocks have recently been sluggish but the RUT is recovering and above its old high:
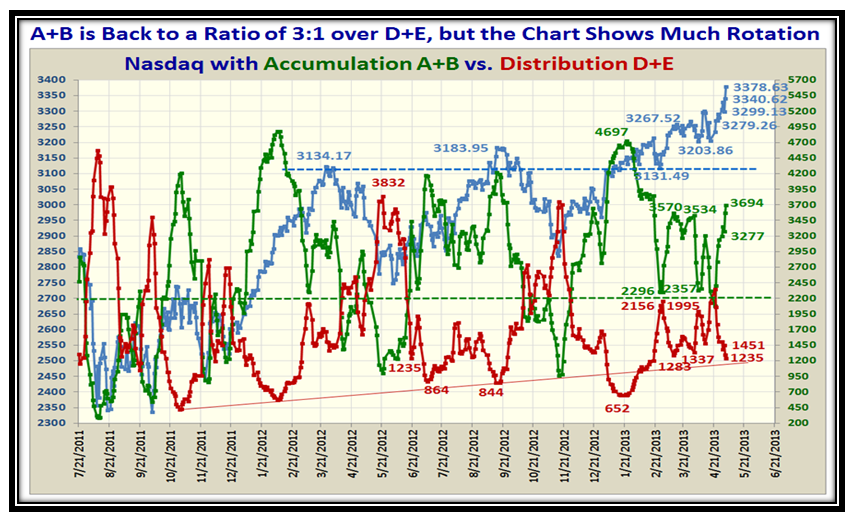
The Accumulation to Distribution ratio has now improved to 3:1, but we have a ways to go to show a 4:1 ratio:
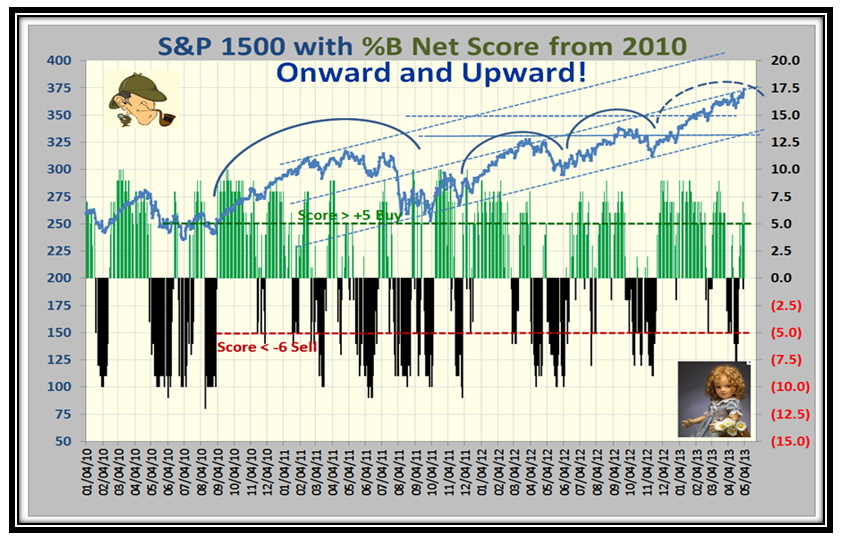
The %B for the S&P 1500 is now back in safe territory sitting up in the 0.8 to 0.90 Bucket, so again we have a cushion:
…And the twin picture of the %B Net Score continues its upwards journey:
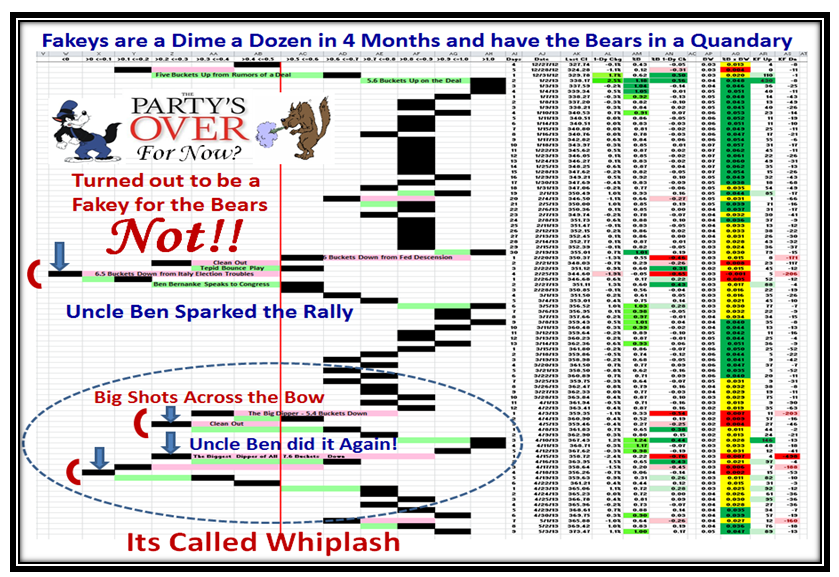
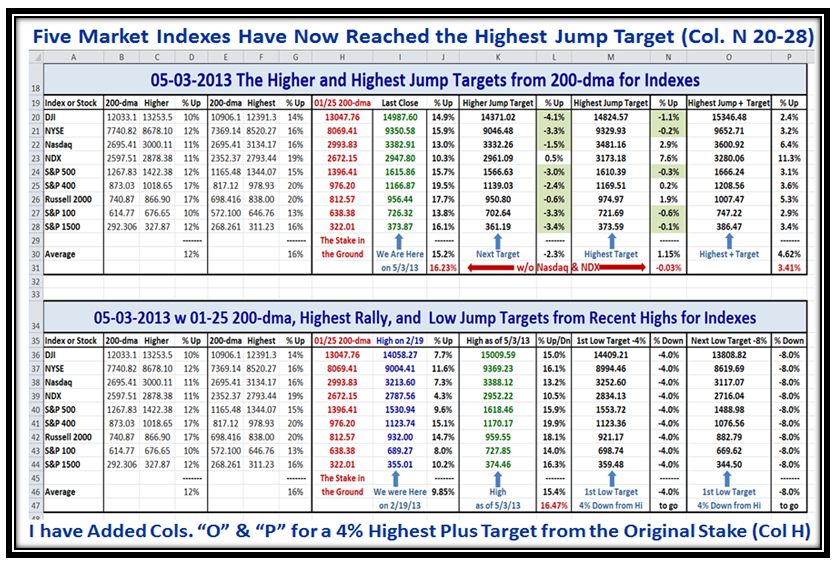
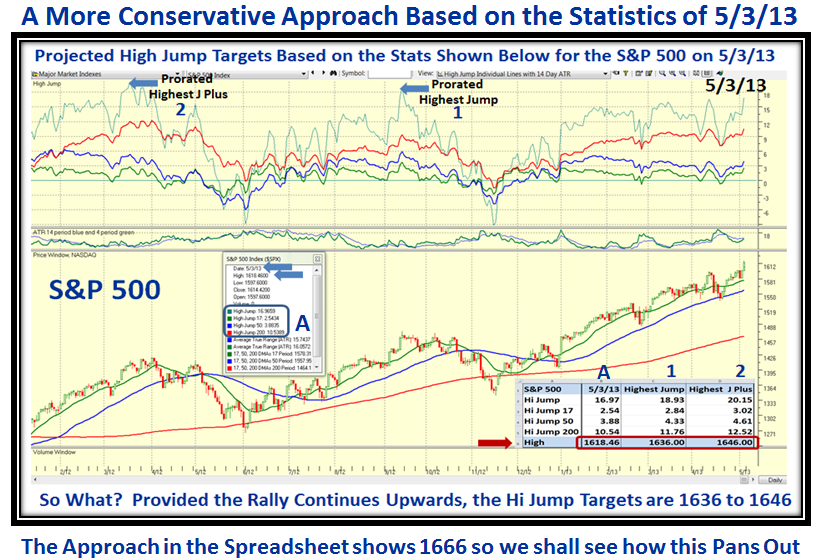
Now for the High Jump Spreadsheet which has served us well during this extremely difficult period of staying on the right side of the Market. I have not seen such knee-jerky action in several years…this is a very tricky market, especially for the Bears. You will note that we are now to the point where five Indexes have surpassed their Highest Jump Targets that I set back on 1/25/2003. So that we can continue this process to show the High Road Target, anticipating that the Rally continues upwards, I have added a further couple of columns for what I have called “Highest Jump Plus” Targets which adds 4% to the 200-dma Stake in the Ground numbers shown in red as a reasonable next jump target. Please also understand that I have shown a different method lower down and you can take your pick, as these two approaches give us a range of 1636-1646, to 1666 for the S&P 500. When this plays out and we finally have a correction, we can then determine the best approach to use in the future.
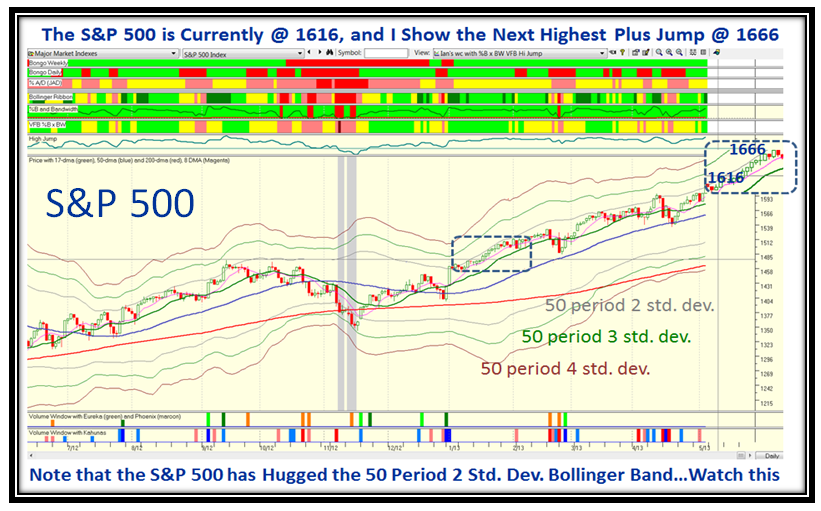
For this second approach, I had a brainwave to use a 50-period Bollinger Band with 2, 3, and 4 Standard Deviations, and as you can see I feel I struck oil. The S&P 500 Index hugs the 50-period 2 Std. Dev. line and the entire envelope is tracking up in similar fashion to the 17-day MA. In this next slide I took the past snippet and attached it to now to show the expectation over the next couple of weeks if the Rally continues upwards.
Going back into history, it suddenly struck me that the last time anything like what we have seen continue with the Rally far past May was in the Days of Wine and Roses back in 1995 when INTC was declared the World Leader in Semiconductors:
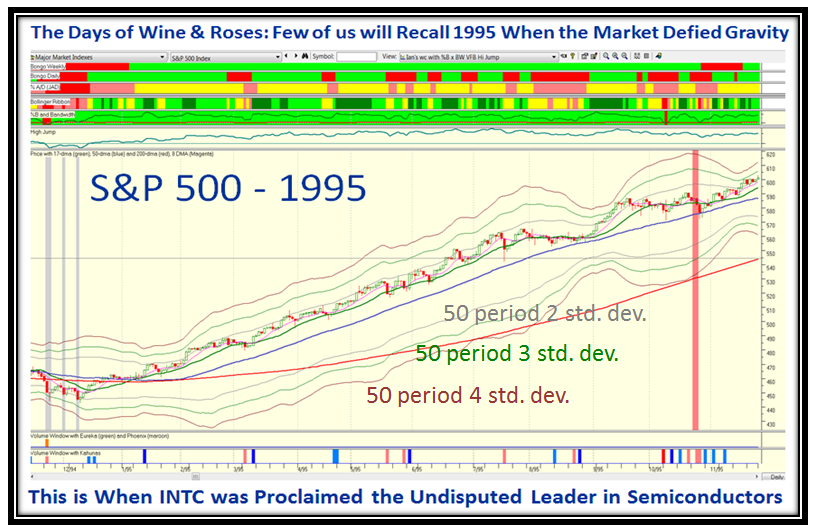
So what’s my point…it has happened before and Wonders Never Cease so don’t be surprised if it happens again. In this new example of addressing Targets, I have taken the latest numbers as of 5/03/2013 (Friday) and applied them for the Higher and Highest jump records during 2012, so that I am using recent ratios and prorating them based on current performance:
I hope all of this is of value to you…so far it has proven worthwhile, and hopefully has kept you on the right side of the market.
Best Regards,
Ian
