Q&A: Accumulation vs. Distribution
I felt this question in the Comments Section was worthy of highlighting with a Q&A Comment on a follow up Blog Note:
- mike Says: September 2nd, 2013 at 7:19 am editHi IanHappy birthday and Happy Labor Day!! I was wondering if you can provide a quick reminder of the significance of the A+B vs. D+E stocks. I did a search of the blog entries on this site but could not come up with anything other than A+B represent stocks under accumulation and D+E are those under distribution. If you could mention what A, B, D, and E represent that would be much appreciated, thx Mike.
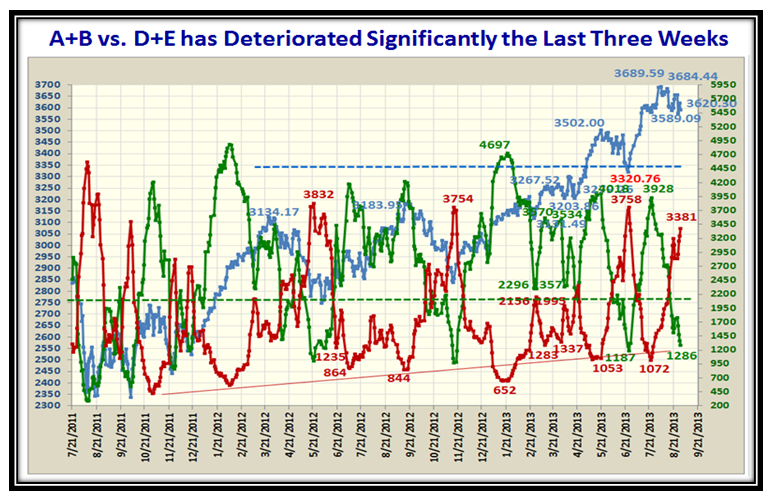
- ian Says: September 2nd, 2013 at 11:24 am editMany thanks to all of you for your good wishes.Mike…to your specific question about ABCDE…The great Guru on High Growth Stock Investing William O’Neil came up with the idea of categorizing stocks and ranking the database into five groups of Accumulation to Distribution. The HGSI Software ranks stocks with Price Above $5 and Avg. Daily Volume >100,000 shares from 100% to -100%, and so the categories are A = +60% to +100%; B = +20% to +59%; C = -20% to +19% (neutral); D = -21% to -60% and E = -61% to -100%.As you see from the charts I use to depict the degree of accumulation vs. distribution “A-E” and “A+B vs. D+E” are the most enlightening to watch for overall strength and weakness of the entire database of about 6820 stocks using the criteria above of $5 and 100,000 shares ADV. The ebb and flow of the Green lines (A+B) vs. the Red lines (D+E) gives a good history of when we may be at a top or bottom. If the Market continues on down from here, another 400 stocks added to the D+E stocks of 3381 would suggest we are oversold and should look forward to a bounce!
- I find the value is in the consistency of where the tops and bottoms appear over the years:
-

Best Regards, Ian.
 Ian Woodward's Investing Blog