Stock Market: Bollinger’s “Bandwidth” Rules the Roost Right Now
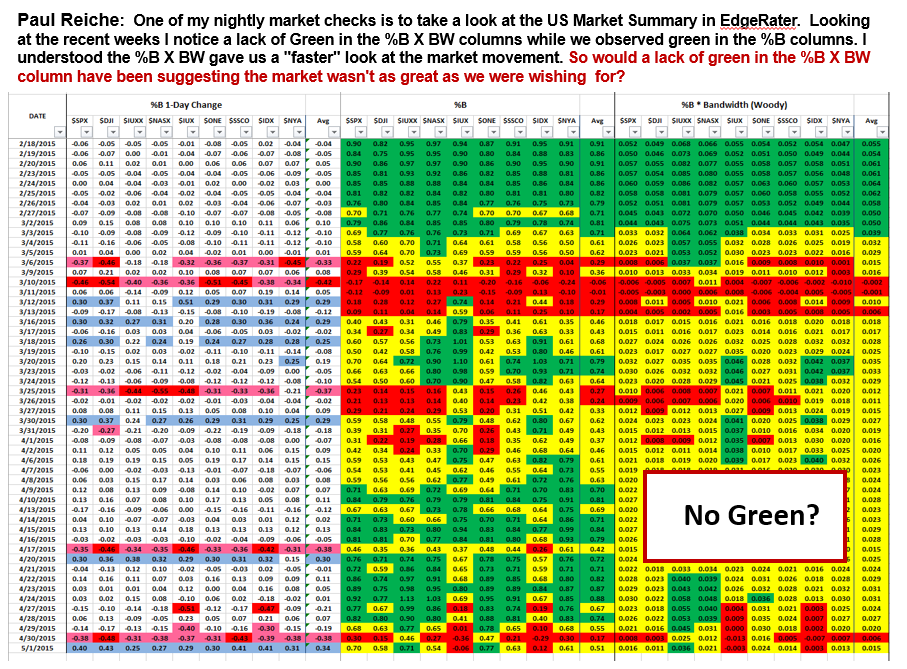
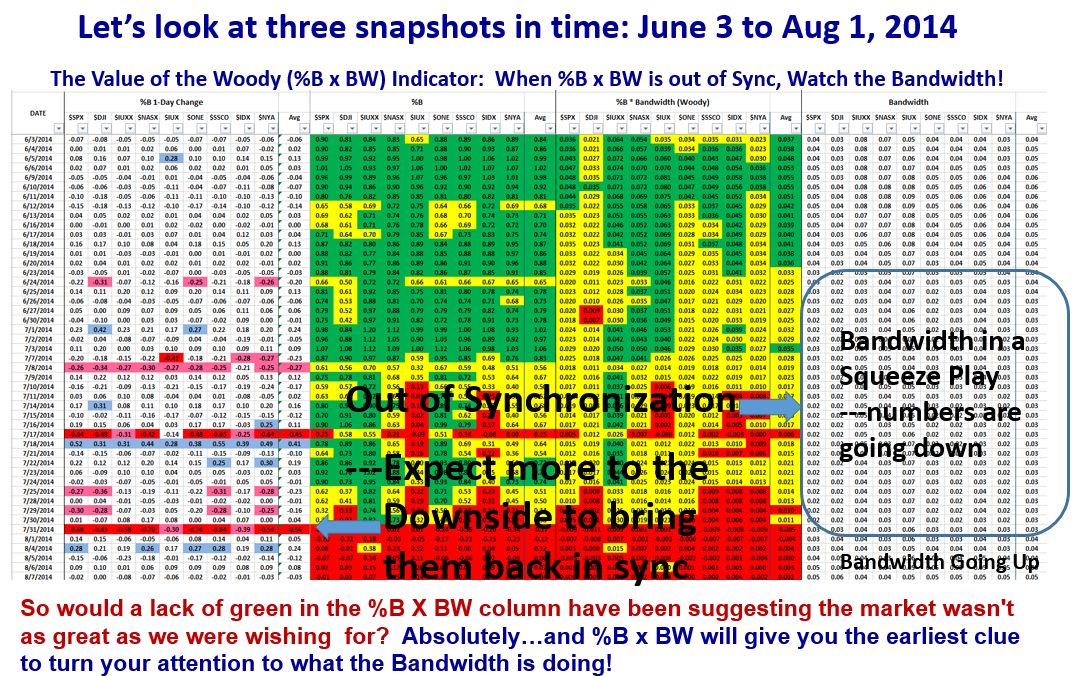
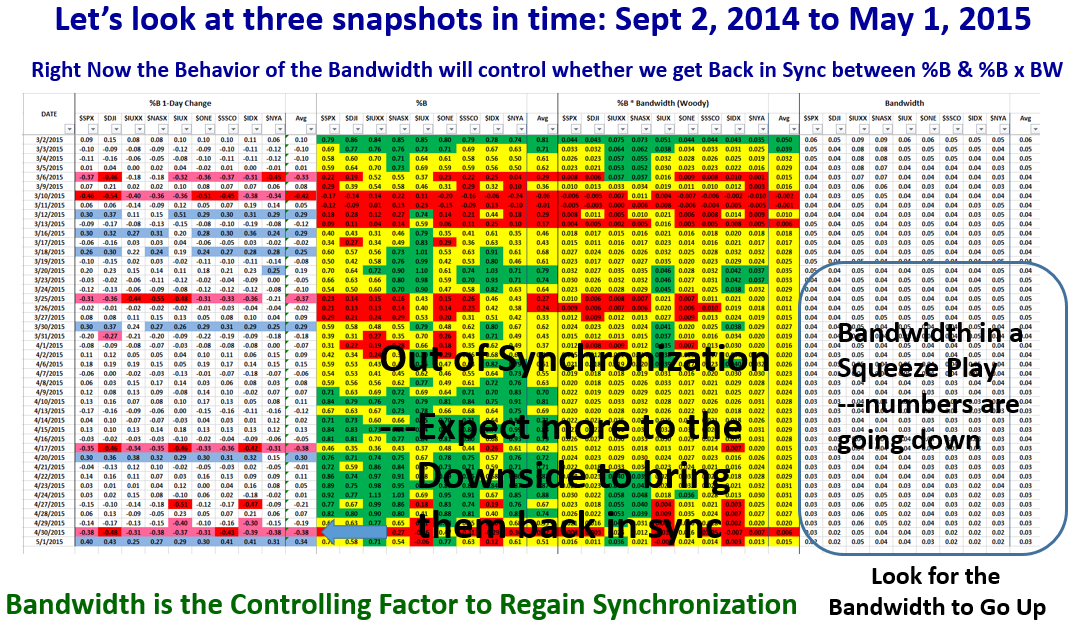
My good friend Paul Reiche made an astute observation when comparing %B versus %B x BW and wondered why the colors are not in “Sync” as shown in chart 7 below. The value of the Woody Indicator (%B x BW) is to give a faster look at the market movement as he rightly says and at such times it pays to turn your attention to what the Bandwidth is doing! I will cover this scenario in charts 7 to 10 below.
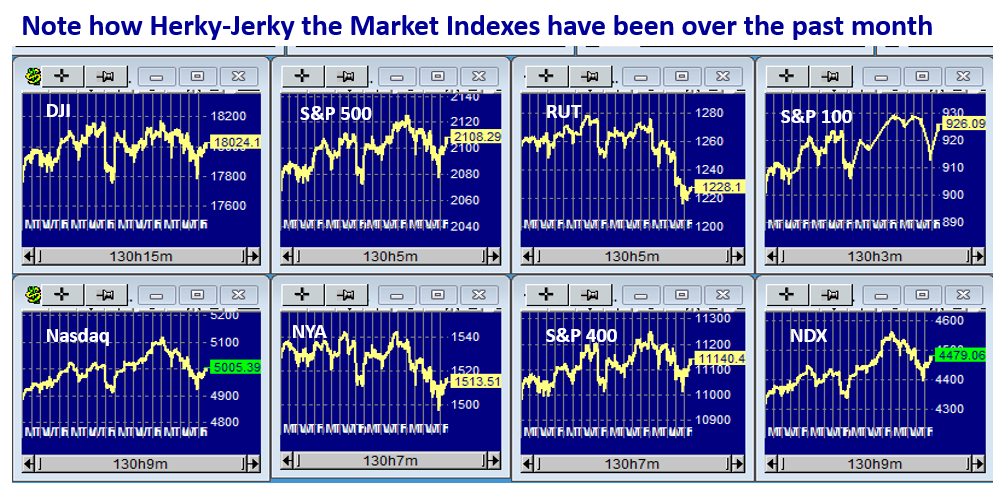
Let’s first look at the Market Indexes to show the lay of the land and as you would expect it has been a choppy market to say the least for the past month:
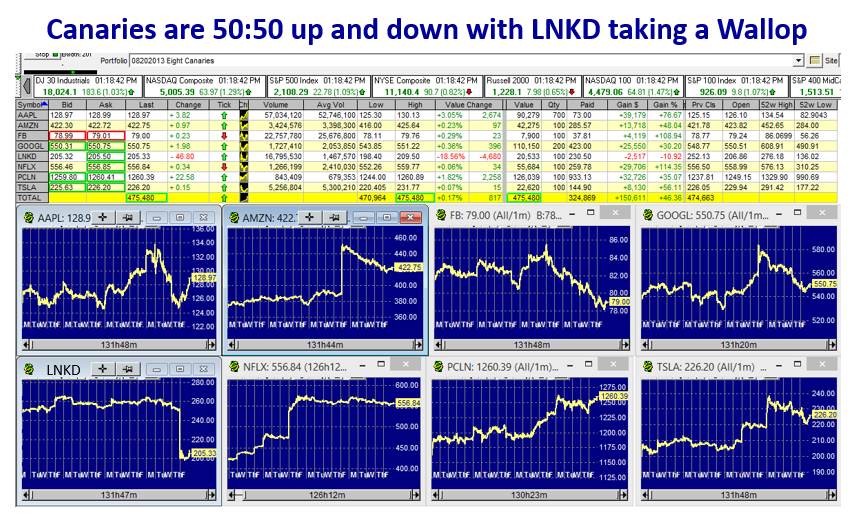
The Canaries haven’t faired much better though NFLX and PCLN have been the stars with LNKD just taking a wallop:
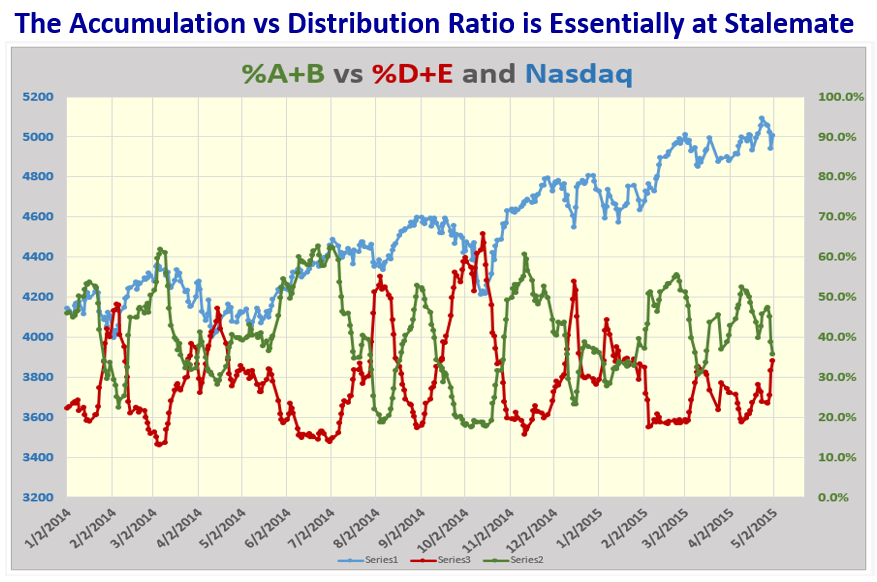
Note that the Internals of the Market as viewed by the Accum. vs. Dist. Ratio also show that we are at Stalemate:
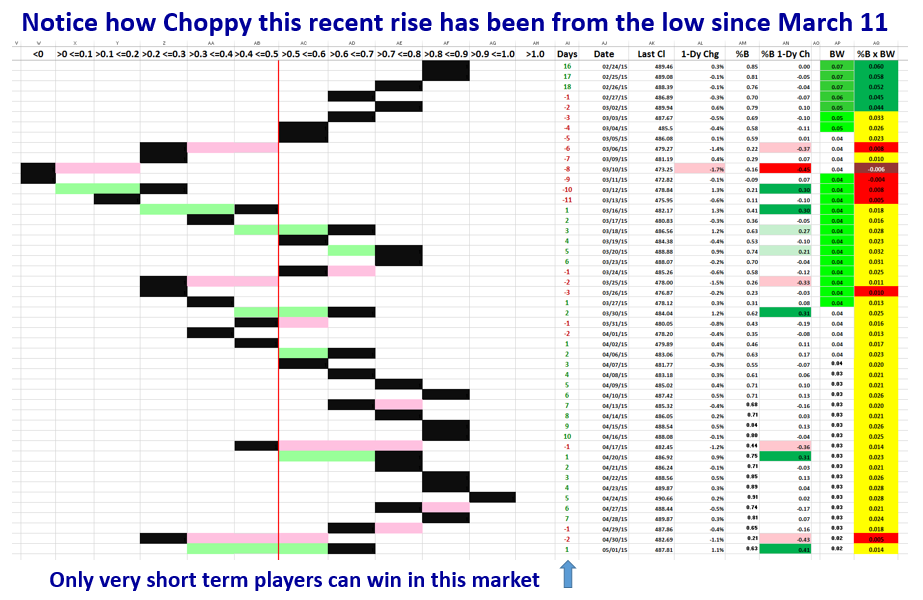
The choppiness we have had to put up with is quickly evident in this next favorite chart of ours:
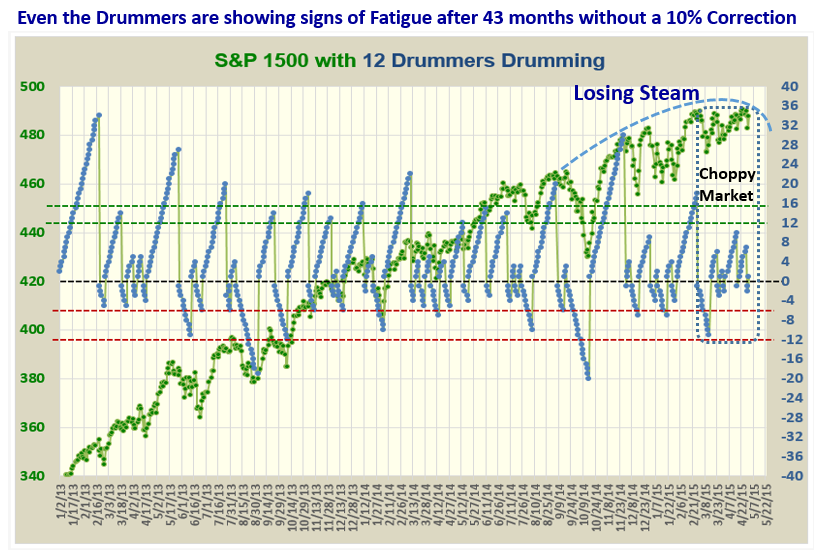
…And here is the Drummers Chart which also shows the signs of a Choppy Market:
Now for Paul Reiche’s astute observation below:
So let’s go back in time and then bring us forward to date to see what happened in a similar situation:
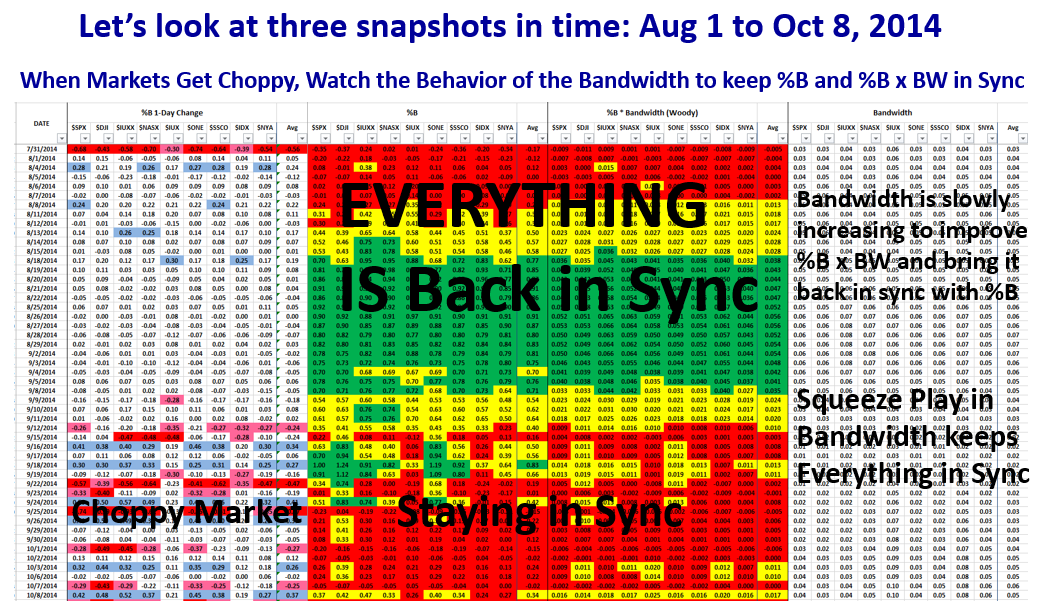
…And here is the follow on chart which shows how everything got back in sync!
Lastly, we are back up to date and so we keep a beady eye on the behavior of the Bandwidth to ultimately bring us back into sync:
Let’s see what transpires over the next week or so. Hopefully things will right themselves in the fullness of time!
Best Regards,
Ian.
 Ian Woodward's Investing Blog
