The Stock Market High and Low Road Targets
Every now and then, we come to the junction of Robert Frost’s “The Road Not Taken”. This is one of those critical moments in time. All the odds and most of the sentiments point to the Low Road, since this Bear Market Rally is long in the tooth, produced records for moving higher faster than most in the past, and showing signs of drooping. Just last week, it chalked up seven straight days up on the Nasdaq, and the SOX Index is moving up in leaps and bounds. Likewise for every point that can be made in favor of the Market continuing to rise, there is a counter-point that seems equally plausible.
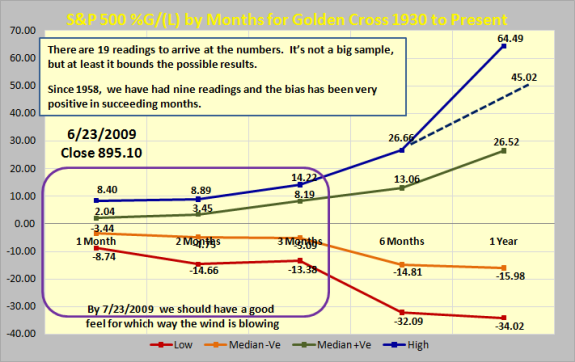
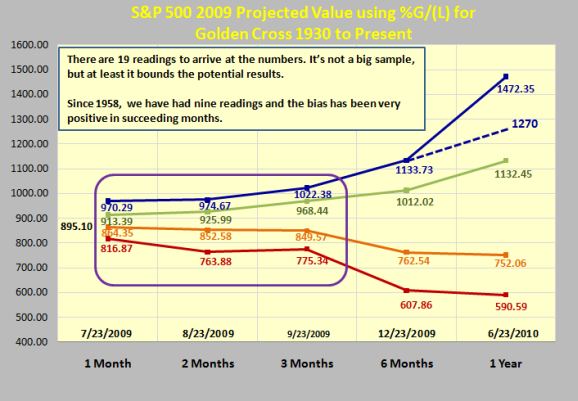
In the July Newsletter I covered the gory details of the Golden Cross Debate, and one piece out of that study needs repeating on the blog. The next two charts bound the immediate High and Low Road Scenarios based on past statistics and we do not have long to wait to see which way this round of events is pointing. Note that by Thursday, the 23rd of July, we should see our first stake in the ground going forward.
Note that the boundaries are either -8.74 % down or +8.40 % up for the worst and best cases, respectively. I will note in passing that we have already had a 9% drop in the S&P 500, albeit not according to the current pictures relating to where we go from here. Going into tomorrow, we are on the positive side of things with the current reading as of Friday on the S&P 500 at 940.38, which is just 35 points from the highest target. We are in the thick of the Earnings Reports season, and there can be many a slip twixt cup and lip, but so far so good with the technology big stocks coming through with beating estimates. It is no wonder the Semiconductor Index is on fire.
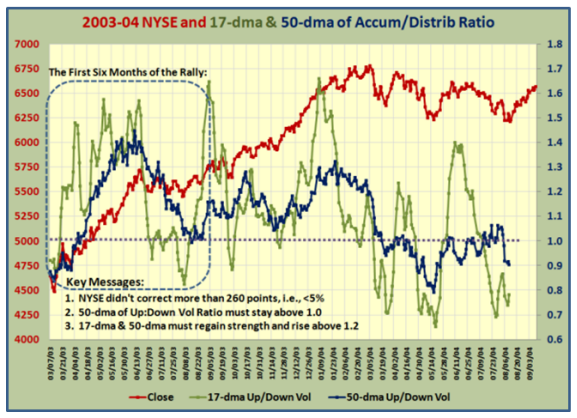
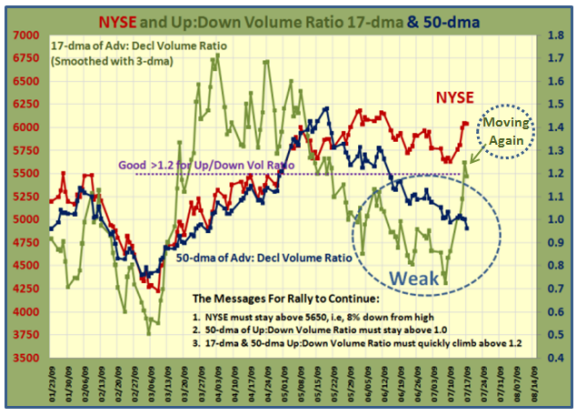
It is not surprising that the 2003 Bull Market Rally is viewed as the recent benchmark for a successful move coming out of a long recession. Most pundits point to the fact that this recession is still young in time compared to that 2000-03 timeframe, being only half the time. All Technicians will point to Price and Volume as the yardsticks to measure. We are now 4&1/2 months into the Rally, and we know that after the first 2&1/2 months of major thrust in both Price and Volume, the Rally has lost its steam by in essence going sideways for the past two months. But sometimes that is exactly the “Pause to Refresh” needed for all mountain climbers, before they conquer the next peak. You be the judge:
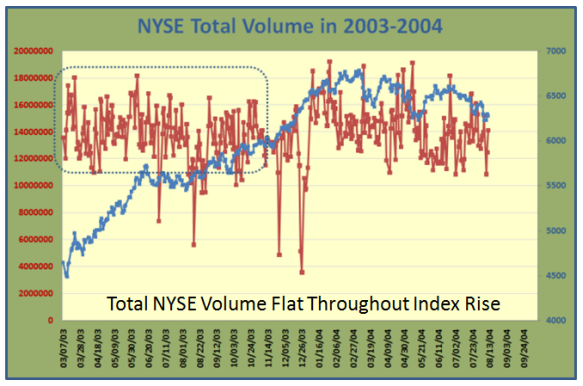
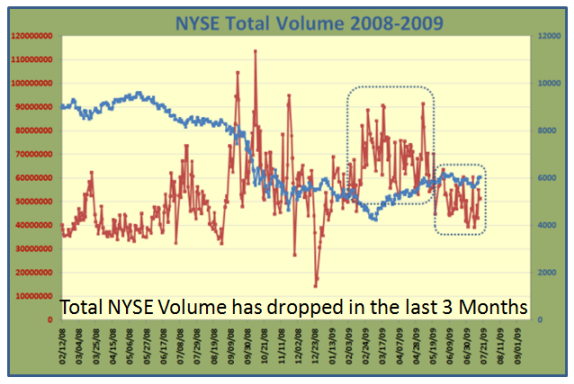
It doesn’t take long to see that the initial move on both Price and Volume was superior than the 2003 timeframe for the first 2&1/2 months. Granted it has fallen below the 1.2 ratio we expect for continued momentum over the longer haul, surprise, surprise, the 17-dma has perked up considerably this past week….moving again. The next week will tell us whether this was a flash in the pan or we continue to see the ratio rise to the required 1.5 to 1.7 level. the 50-dma Ratio must climb back above 1.2 and stay there. Be assured that the move must be very strong with the Nasdaq driving hard to 2000 in the next week, and the S&P 500 to 970 for this move to be on and believable. Now let’s look at the Total NYSE volume picture for the two occasions, 2003 to 2009:
Of course the recent hue and cry is “Where is the Volume”, and certainly that is understandable, since there has been a recent dip by a factor of two. However, if you look at the 2003 timeframe it was relatively flat for not just one year but two during the entire price climb. Certainly we would want to see the number get to the higher end of the current range at 70,000,000 (say), but I do not believe we need to see it much higher for the rally to succeed. Remember this is the period of the summer doldrums.
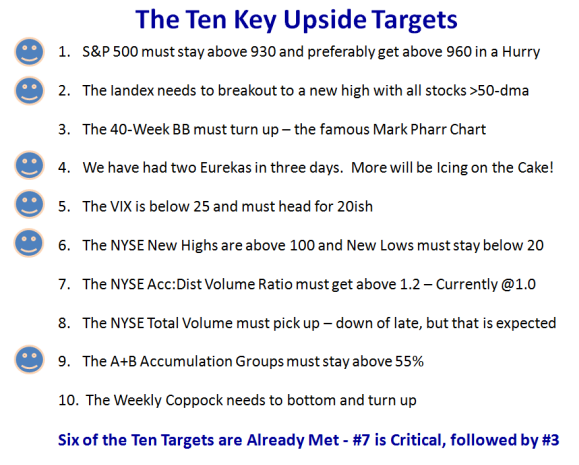
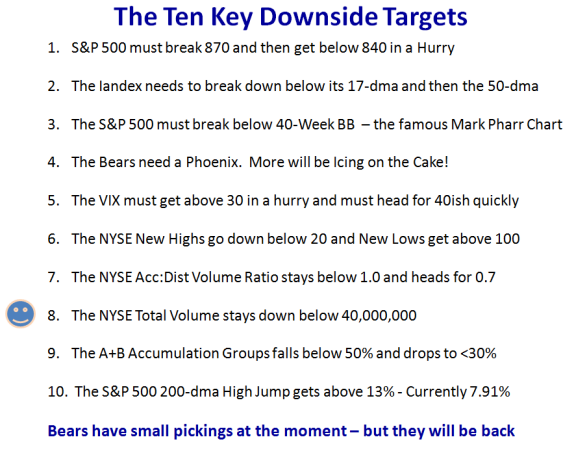
I wind this up with the two sides of the coin, the ten targets for the Bulls and the Bears:
If you believe these are the right targets at this time, then the Bulls have the upper hand.
Best Regards, Ian.
 Ian Woodward's Investing Blog
