Ian Woodward's Investing Blog

Author Archive

Rome Wasn’t Built in a Day…but, Where’s the Beef?

Monday, August 20th, 2007

The Beef

Today’s volume on the bounce turned out to be very disappointing, leading one to recall the caption above, from all of 20 years ago.  There is no question that buying came back in to the “Game Plan Index” I gave you several days ago. (See an earlier note below.) However, today’s action was little more than marking time and we will soon see a retest of the lows I described earlier.  Remember 1371 on the S&P 500 is the line in the sand.

The good news is that the Game Plan Index has recovered a bit, but we need a lot more.  The Tsunami still shows the Index is on a sell, and we need this to turn to solid green again, before the coast is clear.  Keep your powder dry and don’t be too impatient to start nibbling. We still need the Big Bad Wolf to Huff and Puff one more time to see if the Market can hold or fold:


 Game Plan

 From today’s action, expect that retest of the lows soon.  Ignore today’s green bar.  Best Regards, Ian.

Who’s Afraid of the Big Bad Wolf

Saturday, August 18th, 2007


Whose Afraid 

One could not help but feel the angst and hand wringing this past week when Hedge Fund and Carry Trade news hit the wires.  This was a severe body blow to the Bulls who hardly expected this news after the excitement of relatively good Earnings Reports a couple of weeks earlier.  As would naturally be expected, the shorts in their multifarious forms knew a good thing and took the Market down to test the usual first line of defense, the 50-dma and then in quick succession headed for the 200-dma when the former could not hold.  I’m not telling you anything you didn’t know by now that a well trained Technical Analyst would do to draw automatic lines in the sand.

Many are in a State of Denial from the shock of seeing their fortunes pruned, but we had two weeks warning with the Eureka and Hindenburg Omen triggering together as far back as June 13th, which was the very first warning sign.  (I describe the Eureka, Kahuna and Tsunami indicators lower down in this Blog.) As we well know we needed several additional Hindy’s to trigger and we got them at least eight more times until the last one on 7/24/2007. 

The bottom line is that readers of our newsletter knew well in advance that the end of this 4+ + Year Bull Run was reaching a climax.  In the March Seminar I suggested the top for the S&P 500 was 1557 and we hit 1555.90, so benchmarking and target setting does work.  With the help of the newly developed Blog I was able to keep you abreast of the thinking going into the correction.

But, that was last month, and the next question is what happened these last two weeks?

1. The Big Bad Wolf has huffed and puffed and blew down the straw house. That got us down in quick succession to a low of 1427.67 on 8/6/2007, breaking the 200-dma. and -8.2%.  As we well know 77% of the time the S&P 500 will hold at this point and either go up on its way back to the old high and beyond or it will toddle on down to test this same low. You will recall this was the first murmur of the sub-prime fiasco surfacing with vigor.

2. We didn’t have but four days to wait on the dead cat bounce to find we were headed down again, this time with Hedge Fund chaos to finish with a full break of the 200-dma to make an imprint low of 1370.60 or 12% down from the high.  The close was at 1411.27 which was 9.3% down.  So either way the gurus of the 10% folklore should be satisfied that at least the spirit of the correction has been met.  Net-net, the Big Bad Wolf huffed and puffed again and blew the second house down of Sticks. 

3. As we chewed on our finger nails on Friday morning, safely sitting in our house of brick but realizing that both Asian and European markets were being hit heavily, and the futures showing we were in for another heavy day, in struts the Grand Old Duke of York…a.k.a. Ben Bernanke and with one stroke of the pen turned blood red into green. 

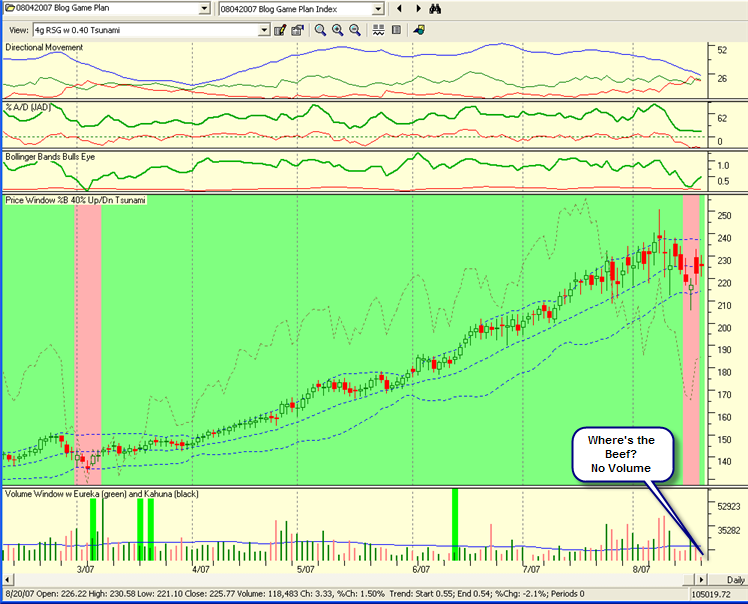
4. Shorts ran scurrying to cover and of course there was some bottom fishing, but as my colleague, Ron Brown suggest in his weekly free movie, the volume was not all that extraordinary given that it was options expiration as well.  With mumble billion shares shorted, of course there was short covering in sync with the overall market coming back almost 300 points in the last hour on Thursday and for good measure another 200 points on the DOW on Friday. The net result was the S&P500 marched up to the top of the hill and finished at 1446, just a smidgeon below the 200-dma at 1449, which of course is resistance.

Next week is a new one and the $64 question is what do we expect next?

1. Given we found a new low on Thursday, that will be the temporary Base Low until further notice, so make a note of it at 1371.  Don’t forget to tap it in lightly, as we are not there yet.

2.  Your earliest clue to the Asian reaction to the Fed’s action will be on Sunday night before you trot off to bed.  Then look at what has transpired in worldwide markets before the open in addition to reviewing the Futures markets.   

3. For starters, the S&P500 must break up through the 200-dma with conviction, in other words we need to see a follow through of taking the shorts to the cleaners, but more importantly fresh buying across several Industry Groups to see some breadth of recovery.  

4. With 1080 New Lows, a veritable print to note as one of the all time lows, we still have more new lows than new highs on the day with 171 and 46, respectively.  We need to start to see those numbers reverse quickly next week, and if they don’t then for sure expect more on the downside.  So that is one item to keep your beady eyes on.

5. For any form of reasonable bounce we should expect it to at least get back to the 50-dma which is at 1485, another 40 points up (say).  Anything short of that will be a disappointment and indicative that naysayer’s who feel the Fed should have done a full basis point or better yet should cut the Interest Rate have the upper hand.  If it makes this level, then one should expect another attempt by the Big Bad Wolf to test the previous low and this time it had better be the Piggy’s Brick House.  It must hold at or near 1370 for a double bottom to feel comfortable that the ship is righted and the Grand Old Duke of York didn’t ride his 10,000 men to the top of the hill to only ride them down again.

The bottom line is expect a Double Bottom and that is the time to either sharpen your pencils to select good candidates for a new bull rally or button down the hatches for a lot longer. Otherwise gamble in Micro-Moments every day.

The Lesson Learned: If you think it’s a bottom, you are probably early, if you know it’s a bottom you are way too late.  All short covering so far.  Overseas money coming in is a good sign. 

Goldilocks is exhausted and is looking grubby

Wednesday, August 15th, 2007

My August High Growth Stock Newsletter for subscribers will be published tonight. Here is an overview for those who are not regular subscribers. If you are interested in subscribing use the link on the right side of my blog and go to the HGS website.

The sub-prime loan fiasco finally caught up with the market and we have been on a roller coaster ride this past month. Intra-day Volatility has been extremely high with swings of 200 points up or down in a day becoming commonplace. All Major Market Indexes are either at or close to their 200-dma lines and have recently printed 4-month closing lows this week. The seemingly low volume early this week may be attributed to seasonality and some “black box” trading firms who are taking a break until the dust settles.

I have done full treatment on Change Management as a precursor to good Money Management in this month’s newsletter, and describe the ten criteria which are important. I note in passing that the Benchmarking Process I use for Target Setting established an Intermediate High for the S&P 500 of 1557, and I am pleased to say that the current high peaked at 1555.40, which once again proves the process and tests of reasonableness used will get very accurate results with minimal surprises.

Ron Brown, my colleague has applied his attention to the Accumulation/Distribution criteria to find emerging stocks that have pedigreed earnings credentials and are emerging from a C+ through B accumulation. The clever application of certain criteria to the process of filtering and reserving other factors for the Combo Rank function gets the cream of the crop to the top. It’s pretty neat stuff using proprietary HGS software functions.

Fools Rush in Where Angels Fear to Tread

Thursday, August 9th, 2007

At times like these, a couple of pictures are worth a thousand words: 

Say Nothing 

I note that some people may have ants in their pants. Just look once more at the Title of the Note I put up two days ago…The Early Bird Catches the Worm, but Watch Out for the Hawk Above.  If you are too hurried and do not have time to read the whole article again, then focus on these two points: 

  1. V bottoms are very rare patterns and one is far more likely to get caught in a retest of the lows. 
  2. Watch the internals of the New Highs and New Lows on strong up days.  Yesterday was putrid, and most would call it a Dead Cat Bounce.  It also happened to come off support at the 200-dma on the NASDAQ, which was a most likely call for most technicians. 

Now think of what has happened since then and the reinforcement of where the psychology stands which has not changed at all in my note of August 4…The Party’s Over and the Jig is Up! 

  1. The psychology – a 10% correction for a decent clean out 
  2. The Volatility has increased…200 DOW Points swings every day are commonplace lately 
  3. The Loans fiasco has now spilled overseas to Europe causing a miserable day here today 
  4. The Earnings are long since forgotten other than to prop up a few stellar reporting stocks Then ask yourself if you should be fiddling while Rome is burning; only Moment Traders are having fun and they must be so nimble that they are literally down to moments, and not within the day trade decisions. 

The Net-net message today is the less said by me, the better.  You had the warning signs from me well before this and I hope you heeded the messages.  Keep Your Powder Dry.  Best Regards, Ian.

The Early Bird Catches the Worm but Watch Out for the Hawk Above!

Tuesday, August 7th, 2007

Both the Last Dance and the Game Plan Groups I published a few days ago on this blog are holding up and are very strong, and I am sure quick traders have seized the opportunity. The stocks on those lists are the leaders.  I have said time and time again seek out stocks with recent strong earnings behind them.  For more details on the characteristics of the stocks to watch please see “The Game Plan for the Short Term” a few notes below.   

However (when one starts with a However you know the other side of the coin is coming), you may want to give some thought to a few other points: 

  1. Think about the potential IMPORTANT News that may be forthcoming on the very day you go for it.  Today is such a day, with the FOMC doing its song and dance.  The Nasdaq dropped over 30 points on the news, the DOW dropped over 120 points and sell programs came barreling in.  Then, just as quickly, they reversed themselves and were up as many points…a crazy volatile market, which we must get accustomed to.  We have had that for over 15 months now. 
  2. V bottoms are very rare patterns and one is far more likely to get caught in a retest of the lows. 
  3. Watch the internals of the New Highs and New Lows on strong up days.  Yesterday was putrid, and most would call it a Dead Cat Bounce.  It also happened to come off support at the 200-dma on the Nasdaq, which was a most likely call for most technicians. 
  4. However, to counter balance that, there is no question we are in a deeply oversold situation and there may be some low hanging fruit you can enjoy in the meantime.  We have not seen such a large number of “E – A” distribution for stocks since May of 2004, after the long run up in 2003.  Said another way, the A accumulation is at lows while the E’s are at highs, comparable to May of 2006 and other lows back in 2005, etc.   
  5. The correction so far has met the odds of a bounce back, i.e., you recall I taught you that 77% of the time the S&P 500 and for that matter the NASDAQ has held at an 8% minor correction.  That’s the good news and that is where we are at right now.  The bad news is if it breaks that level there is a further 11% chance it can hit 12% down on the S&P 500. 
  6. There is no question that good timing is everything, and the early bird who seizes the opportunity catches the fattest worm(s).  But watch out for the Hawk above, especially in such a Volatile Market.  As long as you trade with tight stops and raise your stops to preserve small profits and avoid automatic 8% losses, you will do fine. 
  7. Remember that “W” bottoms are more likely, so more cautious investors should wait a while to make sure a Double Bottom is behind us. 
  8. For those who want the market to prove it has bottomed and enter at a safer point, here are things to remember: 

a. Watch for a retest of the lows, i.e., a Double Bottom.  Then by all means look for the strong up day followed by the so-called Follow-Through-Day 4 to 10 days later. However, one must temper that with the tremendous Volatility we are now experiencing.  Down and up over 200 points within a day from day to day is becoming commonplace nowadays, so be careful, as we have now essentially experienced that three days in a row…between friends.  Don’t be too quick to jump in.   

b. Pounce quickly when the Market Index (NASDAQ) breaks through the short term declining tops line from its recent highs.

c. Wait at least until the 4-dma goes upwards through the 9-dma and preferably both go through the 17-dma, for confirmation that the ship has righted itself.  Use the 4a key on the Charting Module which is available with the HGSI Software.

d. For those who are even more cautious, we want the 17-dma up through the 50-dma, but you will be giving up a good deal of cloth on the upward rally.  That’s fine if it continues, but again you can get caught from being too slow on any retrace.

 That’s it for now.  Good luck and Best Regards, Ian.

Copyright © 2007-2010 Ian Woodward
Disclaimer: Commentaries on this Blog are not to be construed as recommendations to buy or sell the market and/or specific securites. The consumer of the information is responsible for their own investment decisions.