Ian Woodward's Investing Blog

Author Archive

The Just In Time Duo Saved the Day…Again!
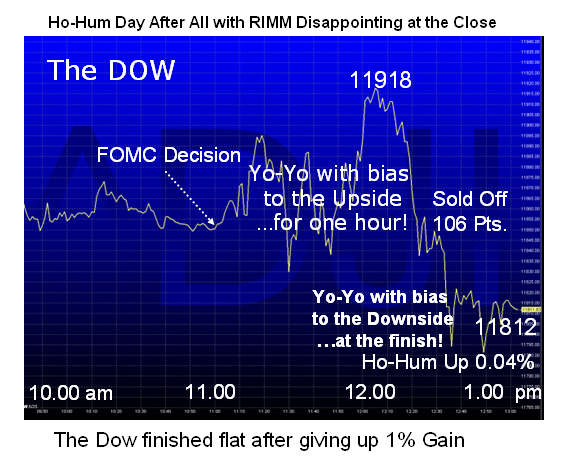
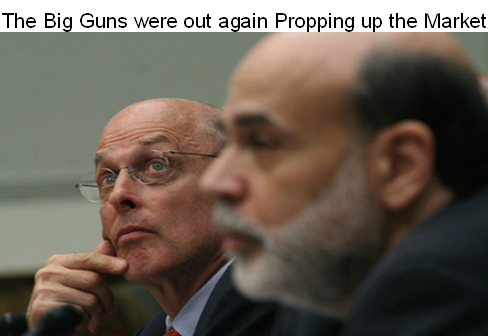
Tuesday, July 8th, 2008

Just when the Bears felt they had this Stock Market in their teeth, up pop’s Fed Chairman Helicopter Ben and Treasury Secretary Henry Paulson to save the day.  The “Duo” is due to testify in two days before the House Financial Services Committee on suggestions of shoring up the weaknesses of the federal financial regulatory structure.  The one-two punch worked as the market first responded positively to Bernanke’s assurances to extend the time frame for embattled brokerages to tap the central bank for emergency funds.  It then turned around and went on a rollercoaster ride up and down 100 points to finish over 215 points from low to high and come roaring back when Henry Paulson suggested that the “The prices homeowners realize when selling their home may not be as depressed as the headlines suggest.”

just

  1. Net-net, The Dow pops as crude oil drops $5.33, the most in nearly four months. $9 in two days.
  2. Alcoa came through with better than expected earnings and was up after hours.
  3. The market should follow through tomorrow when 2nd qtr. earnings are a concern
  4. Japan Nikkei 225 advances on U.S. Gains up over 1.7% in early going.
  5. From my Smorgasbord of items to watch, let me remind you I have been on target:
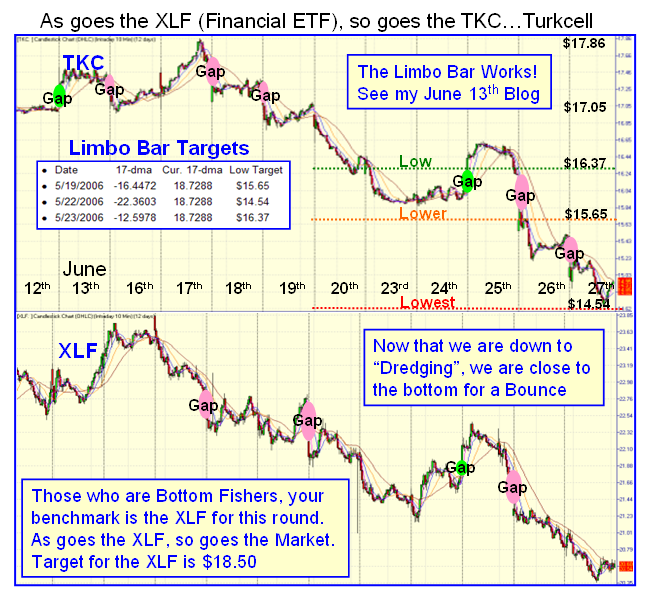
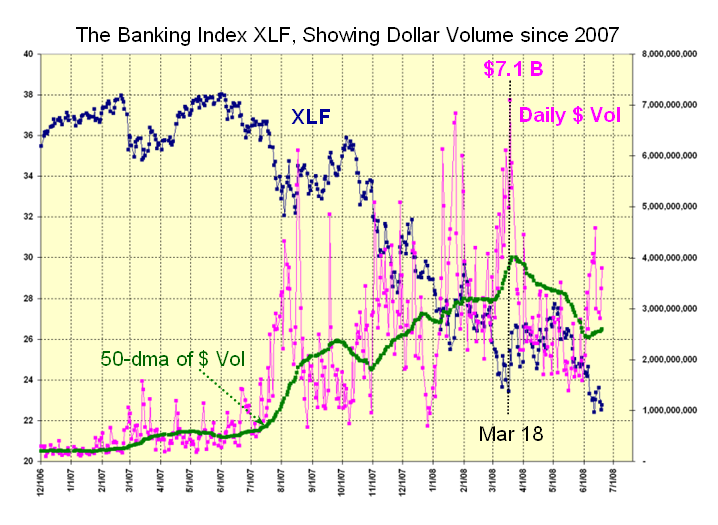
  6. The XLF bounced from its low of $19.08 yesterday to $20.53 with an up Kahuna
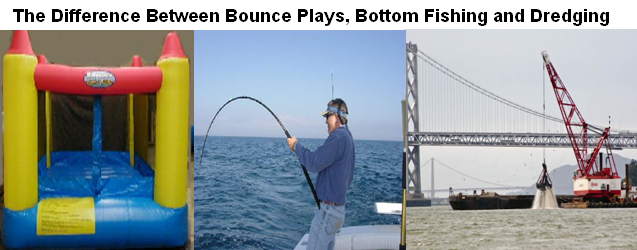
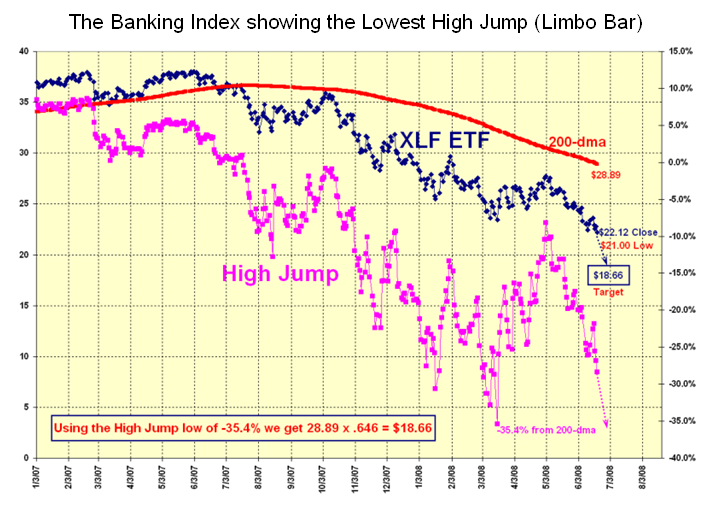
  7. The TKC Dredging is finished for now with a strong bounce from its low of $13.43, which broke the Lowest Limbo Bar I suggested at $14.54 and then closed at $14.49 all on the same day four days ago to now be at $15.68.
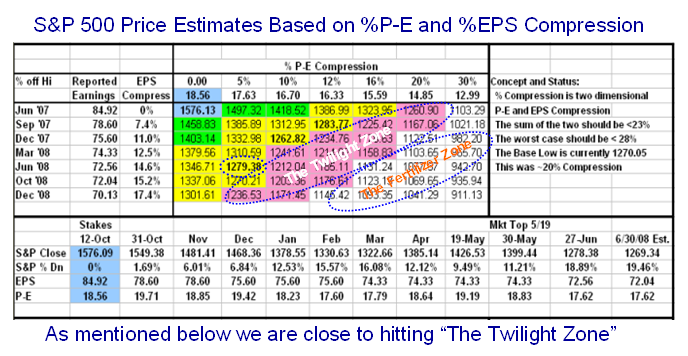
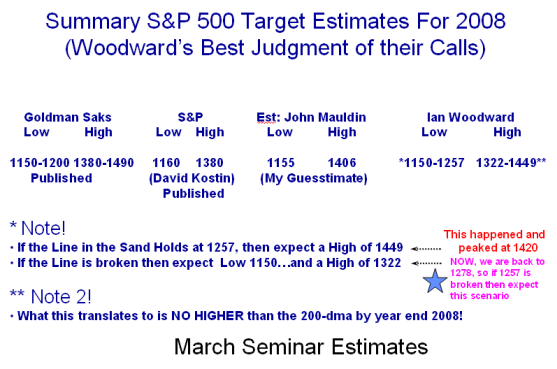
  8. Having broken 1257 on the S&P 500, the next in line was 1241.61 in the Twilight Zone and it hit 1240.68 yesterday for a low before bouncing back to 1273.69 today.
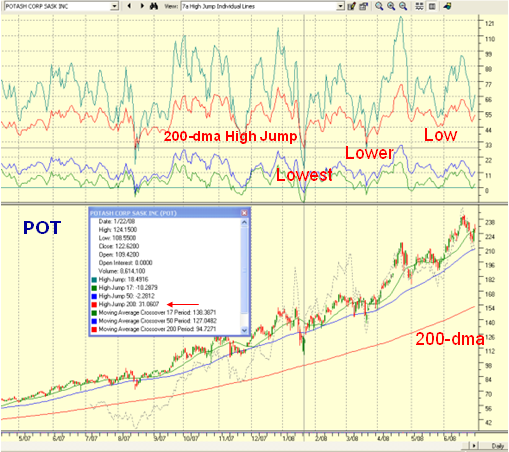
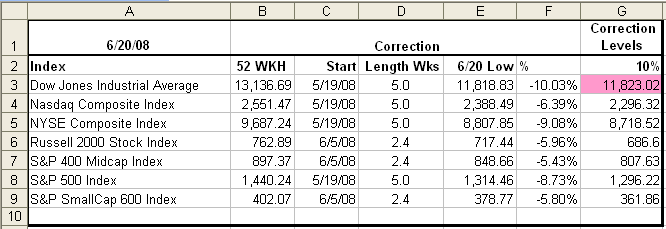
  9. Essentially all the Major Indexes are down ~ 20% from the October Highs and below their 17-, 50 and 200-dma so there is a lot of work to do to even think that we have begun to repair the damage of the last month.
  10. We can chalk up a POTENTIAL reversal day off the bottom and now we wait for the next set of signals, including the signs of a follow through day with simultaneous Eureka and Kahuna signals required to trigger in the next couple of weeks. 
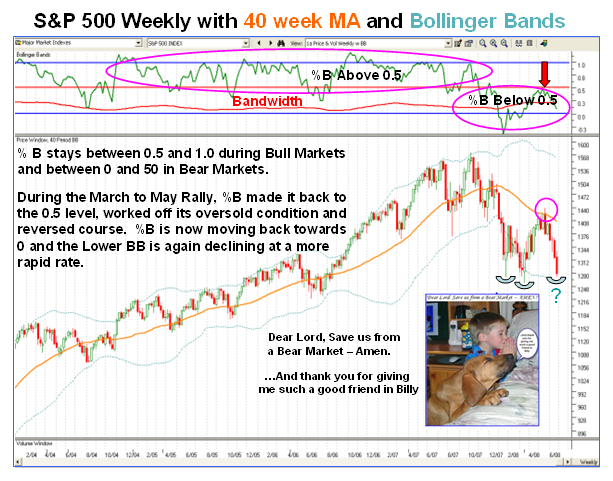
  11. Understand that we are no where near on the start of a fresh bear market rally and the best we can expect is a short bounce play until the drastic oversold situation and short covering is over only to find another test of these lows. 
  12. “V” bottoms from such an oversold condition are rare so one must always expect a re-test.  Likewise with the Distribution %E at 25% which is a record reading since many a day, it is most unlikely that we can expect recovery at this depth without some more Bear activity to drive the market down again.  Some of this excessive oversold number has to be burned off to bring %E to between -17% to -7% for a better assurance of having a successful rally attempt. 
  13. It would seem that unless and until the price of a barrel of oil can be driven below $100 for good measure, we will continue to have a see-saw market with more blood-letting to try and open the floodgates to the downside.  
  14. The target is $1150 on the S&P 500 which I first signaled many moons ago as being a distinct possibility with my blog of the “Thick Blue Pencil” of Feb 17th, 2008…remember that.  In that note I defined the four types of trader/investor, and cautioned that the only ones who have a fighting chance of making good money were Types 1 and 2! 

We have come full circle to that scenario six months later where frankly only moment and day traders can do well if they are really nimble. Best Regards, Ian.  


Bounce Plays, Bottom Fishing and Dredging

Tuesday, July 1st, 2008

I couldn’t pass up two opportunities from the Mailbag that relate to using the proprietary High Jump Tool in the HGS Investor Software.  Please understand that I know the two persons very well, so took a little license at wagging my finger a little to drive the point home…all in fun.

bounce

  •  Mail Bag Question #1: Seems like the Ferts, want to test some moving averages today… I am looking closely at MOS and buying around 134…interested in thoughts.
  • David: I have taught you the difference between a “Bottom Fisher” and a “Dredger”.  So you want to become a Dredger.  That’s not to say that the Fertilizers won’t get down there, but in that case we will have a lot more to worry about than buying MOS at $134ish, as we will all be truly in the fertilizer.   
  • High Jump using lowest recent (Limbo Bar) for 200-dma = 40.70 on 5/27/08.   
  • Current 200-dma = 97.31.  Therefore 97.31 x 1.4070 = $136.91, ergo you missed it today at $136.02. 
  • So the best time to take a flier was at its low today.  As my old man would say to me, “Son, You want Jam on it!” i.e., you want to be a Dredger at around $134.  But then again, who is to say it won’t go down another $7.26 (High to Low today) from here tomorrow.  If it makes a high of $142 say by the end of the day, you might just be lucky with your dredging and get it for $134.74.  However, the odds are slim to none as I write this.  It all depends on timing.  So pass the Marmalade at breakfast tomorrow and keep your fingers crossed.  
  • It’s not a perfect science, but I have already taught SKI (aka dorothyoz) how to play TKC and hopefully he has turned to Dredging on that one, but that beast was beaten way down to start with.  That kind of Dredging takes a lot of patience.  HGSI type bottom fishing and dredging is a lot easier for the likes of you who would be like a lamplighter...gone in a flash if the trade works against you.  Why? Because the HGSI Investor has a trump card, and it is called “Nimble”.  I’m sure you would take 4% in half a day any-time. 
  • The bottom line is that the High Jump is your best tool for giving you a fighting chance…use it.  It’s all possible with the HGSI software and a little coaching. 
  • I’m sure you won’t mind my having a bit of fun on a roller-coaster day.  Best Regards, Ian.
  •    

  •  Mail Bag Question #2: Hi Ian, It is nice to hear from you on a day like today.  If I apply the same principle to POT, I get an entry point of 220.37, is my computation correct?  And since it is not too far from the current price (220.98) as I write this, is it “safe” to buy POT now?  I know, it is always “my call”; just want your input on this as my exercise.  Thanks!  Best regards,  Theresa
  • Answer: Hi Theresa:  To answer your first point, yes, you did the Math correctly, so that is a good start!  Count one up for you   Now for the disappointment.  Unlike David who wanted to Dredge, you are hardly even bottom fishing…to all intents and purposes you are barely using the tool for a BOUNCE Play off the 50-dma.  If that was your intention then be my guest, but you are way too high to come in here for even a bottom fish, leave alone a Dredge.  BOUNCE Plays off the 50-dma is fine when the Market is Strong and very risky when it is weak. 
  • Look at the spread today…$14.40.  Another one of those tomorrow and you would be down to $208. Then what do you do?  It would be a Busted play if you were in at $220ish.  In other words you are looking for an entry which can only work if the Market goes up from here and POT goes up from $220; otherwise you are in for a busted play…i.e, the odds for the risk are a lot higher than the reward. I chided David for wanting Jam on it, but you hardly even want butter on your bread for a point of entry.

    pot

    1.  Please remember the concept of High, Higher and Highest Jumps.  Likewise, Low, Lower and Lowest Jumps, i.e., the Limbo Bar.  I’ll grant you that 44.09% is the Low reading for the 200-dma on 5/27/08, so you did the math correctly and it comes out as $152.94 x 1.4409 = $220.37, so pat yourself on the back for that one.  But I am afraid no cigar!  Why? look at the two cases below: 
    2. a)  But what if it goes LOWER to 31.47% as on 3/20/08…it would be down to $201.07 in a flash 
    3. b)  And worse yet, suppose it really corrected to its LOWEST Limbo Bar of 28.51% on 1/23/08; you would really be in a pickle as that would take us down to $196.54. 
    4. The lesson learned is to know where you stand regarding the competition with the Market and with POT.  NEVER only look at the first leg down of the Limbo Bar; look to the next one down and the lowest before you can assess the odds.  At least you will know whether you are taking a risky gamble or should be patient and wait for a better day to the DOWNSIDE in a BEAR MARKET. 
    5. It hardly even touched the 50-dma leave alone break it, as is its past history when it really corrects.  So take comfort that you know how to do the calculations correctly, but that is not enough to differentiate between a Bounce Play, Bottom Fishing and Dredging.  Now you know all I know.  Who said that HGS Investors don’t know how to play the Value Game?   It’s Value of a different kind when you know how to use the High Jump correctly.   Best Regards, Ian.

    It turns out that David bought as his T/A signals triggered, but Theresa was just practicing her skills for how to calulate the points for Low, Lower, Lowest.  Ian.

A Smorgasbord of Good Stuff to Watch

Sunday, June 29th, 2008

You are either tired of this tricky Market and have already capitulated or you are all prepped for a Bounce Play.  It goes without saying that we are back to the critical Line in the Sand:  Do we hold the line at 1257 on the S&P500 or do we head down for the 1150 Target I have offered several times before on this blog and in the March Seminar Targets?  It is Nail-Biting Time and the question is “So you think you can dance” in this Difficult Market?

nail

  1. If you are an ardent follower of this blog, then I have provided you a Smorgasbord of items to watch this next week based on what I have taught you that are important in the Principles of HGS Investing. 

  2. With the HGSI Software we provide the investor the ability to practice several styles from Bottom Fishing to Momentum, from Trading in Moments to being patient, prudent and pouncing when the time is right. 

  3. We define opportunities that have MOMENTUM in Strong Fundamentals as its first and most important ingredient coupled with strong Price Gains in tune with the Market Direction.  Our approach is based on providing alternative scenarios that draw Lines in the Sand. 

  • We have had two Bingo Signals on the NYSE which suggests A Bottom…not necessarily the Bottom. 
  • All Indexes have Bongo Signals “No”.
  • We now wait for a Eureka within the next 12 days.  

I trust that the following snapshots from the past will give you what is important to look for at this critical juncture…I will let them speak for themselves, but it is always “Your Call.”  For those who attended the March Seminar, I strongly recommend you dust off the HGS 701 PowerPoint presentation.

s&p price  targets tkc Best Regards, Ian.

The FOMC did Something for Nobody!

Wednesday, June 25th, 2008

William Gross at PIMCO suggests the Fed is at Neutral, will not raise rates by December, the economy is de-leveraged and this is a period of slack.


magoo

 As widely anticipated, the U.S. central bank stands pat on interest rates.  But the inflation-hawk contingency appears to be gaining adherents, with policy statement admitting the risk posed by inflation has risen. MARKET SNAPSHOT:  REACTIONS TO THE FED
• Stocks retain gains after Fed Announcement then peter out
• Dollar retreats modestly
• Treasury market extends losses
• Crude oil pares some losses
• Gold rises as Fed’s steady
• Transportation – Shipping gets a bounce

fomc

Best Regards, Ian

Bank stocks in “capitulation”!

Friday, June 20th, 2008

Analysts at Merrill Lynch on Friday said investors appear to be capitulating with regards to bank stocks, frustrated into selling them down to levels below their real values as the credit crisis continues to wreck balance sheets. The analysts also slashed their earnings outlooks for several large regional banks and said they will continue to boost loss reserves and cut dividends. From Reuters financial headlines today…

  • S&P may cut debt rating for Ford, GM, Chrysler
  • Ford cuts truck output as sales tumble
  • Merrill shares fall on rumors of profit warning
  • Market ends lower on banks, oil concerns
  • Analysts slash U.S. bank estimates more as credit worsens
  • Yahoo shares fall after reports of executive exodus
  • Winnebago tumbles; CEO warns on price war

We are now 5 weeks into this correction, with the DOW already -10% down from its recent rally high as shown in the chart below.  Wednesday could be a big catalyst day with Durable Goods Orders at 8:30am, Crude inventories at 10:30am, the FED announcement at 2:17pm (this is where the fun should begin…but in which direction?), and RIMM earnings after hours.  Before that, it should be a sleeper.  If the NASDAQ does not undercut early in the week, there

ss

So let’s turn our attention back to the theme of this note which is how might we know where the Line in the Sand is for two scenarios: 

  1. The Banking Index ETF, i.e, XLF holds support at the 2002 level of $18.52 or higher, finishes the capitulation and reverses to the upside.  This will also imply a capitulation to the Limbo Bar (Lowest High Jump) for XLF which is $18.66 and -35.4% down from the 200-dma. 
  2. We have a Major capitulation that borders on a crash in the Financial Markets and heads even lower to establish a New Limbo Bar Low of > -35.4% from the 200-dma. Why all this excitement in using the Banking Index as the focus for understanding the degree of severity for the possibilities of this correction?
  • Sub-prime problems have taken their toll on Financial stocks and the Banking Index. 
  • What many have not realized is that the Banking Index is a fraction away from making a 100% drop down to its 2002 support levels.
  • The July 25 calls of 297,929 to puts of 62,653 provide a ratio of 4.8 which is a massive expectation to the upside on the XLF and Banking Index.
  • Daily Volume is once again showing signs of rapidly increasing with today’s volume at a staggering 188,753,200 shares and a dollar volume of $4.19 Billion
  • Lest we get too excited, I do not expect full capitulation until this number exceeds $7 Billion, and if you don’t believe me we exceeded this number on the previous Base Low when we hit $7.1 Billion on March 18, 2008, as shown in the following chart:

chartNote how there have been several attempts by the bottom fishers to find support only to capitulate and the Index head down again to find support, as it has trundled down to current low of $21.00 which it hit today:

2002 Note how the Dollar Volume has gone into oscillation in 2007-08, and that it has peaked several times above $6 Billion, so we should expect that at capitulation.  Now let’s look at the Limbo Bar picture:

limbo 

With all the financial turmoil along with the speculation in Oil no one knows where the Market will find a bottom, but at least you now have the guidelines and yardsticks to watch and measure and take action accordingly.

Best Regards, Ian.

Copyright © 2007-2010 Ian Woodward
Disclaimer: Commentaries on this Blog are not to be construed as recommendations to buy or sell the market and/or specific securites. The consumer of the information is responsible for their own investment decisions.