Ian Woodward's Investing Blog

Author Archive

The Decision on Round #3 of the OK Corral Fight is Imminent

Saturday, February 23rd, 2008

This week every short term trader has been mesmerized by one question which had Bulls and Bears still wondering which way this market will break…up or down.  As part of their repertoire of tools rhey had the old favorite of Technical Analysis Symmetrical Triangles as the center of attention.

round 3

With Triangles uppermost on our minds, let’s review the bidding one more time, where I have now expanded the playing field from the High on October 31 at 2860 to a low which would take the next down leg to 2010 on the Nasdaq, as shown below.  This would imply a 30% correction:

ok  As the headline above says, it is once again Nail-Biting Time for Round #3 at the OK Corral to stay with the theme I set in an earlier blog.  Last week I showed you my assessment as we have watched the saga from February 8 to 15 and Now Feb 22.  Victory was snatched one more time from the Jaws of the Bears where with only about half-an-hour to go to the close on Friday, just like clockwork there was a surprise EVENT relating to bailing MBIA out of their Credit Loan Crunch problems.  That news drove the Dow up over 100 points and the Nasdaq about 40 points and left a long spidery leg with a Hammer for the day.  Technical Analysts were licking their chops that at least the decision on which way the market was headed was down, but at the close the question of which way next week is still in the balance. However, this is the fourth Friday in a row where it has closed up…net, net we do not have conviction one way or another to drive this Market with explosion to the upside or to the downside.  If it breaks to the upside we drive for 2540 and if to the downside, we retest the Base Low at 2203. 

The good stuff on Symmetrical Triangles is still intact for yet another T/A element to watch for next week.  Unless there is again some follow through tangible information that breaks early next week on this subject to continue to drive the Bears to cover their shorts and possibly force the pattern to the upside, the odds still favor a move to the downside with Lower Highs and Lower Lows.   

  1. The bias to the downside is reflected by the number of NYSE New Highs being only 15 and New Lows 97 on Friday…not good.  The weakness to the upside is exacerbated by the fact that since December 27 we have not had a single day with more than 68 New Highs over 57 trading days.   

  2. From past readings of failed rallies in Bear Markets, the longest that the rally has held is 18 trading days from the Eureka signal and we are right at that period.  This coming week is critical.

  3. The 200-dma has peaked and started to roll over.

  4. % B of the Bollinger Bands has broken down through the Bandwidth, again signaling weakness.

chart

Late Breaking News:  My good friend, Mike Scott, reminds me “that the closer to the apex of the triangle that the market or stock gets the more likely to get a head fake…A short false move prior to the real move.  This tends to sucker punch a lot of traders and those with stops placed close into the formation.”  Next week will be interesting to see how this unfolds.

Best Regards, Ian.

Helicopter Ben is Between a Rock and a Hard Place

Tuesday, February 19th, 2008

ben

The market opened with a bang to the upside buoyed by the overnight markets in both Asia and Europe being up, and the DOW shot up to the High of the Day at the Open at 14498.8, tried a valiant attempt to hold it by mid afternoon and then slithered to finish 11 points for a swing of roughly 160 points.  The Nasdaq didn’t fair any better but it dumped its high of 2350 down to 2306 at the close for a loss of 16 points.  Yet the opportunities within the day were plentiful if you know just where to look.  Most of the Smart Groups and StockPicker Groups featured under Woodward and Brown in the HGSI software gave you excellent fishing holes, and were right up the alley I left you with at the weekend. 

On Sunday I showed you where to do your homework and fishing for worthwhile candidates.  Just to remind you here is the Family Tree I offered you of where the best opportunities lay with Bottom Fishing being the primary theme:

tree

Shown below are some snapshots of our favorite Smart Groups and StockPicker groups to show you where the emphasis was and also the very reasonable results for a day’s fishing, especially when the market closed down today.  As we well know, tomorrow can be different, but that is up to how good you are at fishing even when the wind is in your face.  What I am implying is that the High Growth Stock Investing Process can help you find you opportunities in good times and in bad, and we have simplified the process for you to select the best from the top 10 stocks in various favored approaches.  The bottom line is that there is nothing better than a High ERG stock in times like these.

coal Obviously many of the same stocks appear in these different Smart Groups, but with the Group Inclusion Report function in HGSI you can quickly establish the best of the bunch!  Best Regards, Ian.

One Good Turn Deserves Another

Monday, February 18th, 2008

weatheronwallstreet.blogspot.com

weather 

On a lazy Monday morning when the Stock Market is not open, I felt I should pay a compliment to a fellow blogger “Buddy” who has my site on his Links and Resources, and return the favor by pointing out his blog to you.  It is a neat site, and what I envy is that his notes pierce to the heart of the matter, are short and crisp and just made for those in a hurry to get the feel for the Weather On Wall Street.  Put this site on your rosta of sites to visit and enjoy his insight.  Don’t mean to steal his thunder, but here are three headlines that sum up the weather in his eyes:

  1.  Short Term: Neutral…..watch for break up or down from triangles.
  2. Intermediate Term: Bullish
  3. Long Term: Bearish 

 …and he gives a short synopsis of why and what to emphasize.  It’s what I call “Good Stuff”.  Keep up the good work, Buddy. Best regards, Ian.


Sometimes the Thick Blue Pencil for Highs and Lows Works Better

Sunday, February 17th, 2008

To those who are avid Technical Analysts, this blog note is written with tongue in cheek, so don’t feel that I have taken leave of my senses.  However, there comes a point when there is a fine line between Art and Science.  The proponents of the great Masters of Fibonacci, Gann and Elliott Wave will measure everything from upside down to sideways and back, and of course they are laying down the scenarios for “if this, then that, and maybe something else” in the chess game of what the market is telling us.  However, sometimes trying to look five moves ahead can be detrimental to your psyche, and I always try to KISS it at times like this.  Remember what I have taught you: My world works in threes:  It is green, yellow or red; or it is up, down or sideways….or, you get the point.  Fundamentalists pooh-pooh this stuff as a bunch of rear view mirror mumbo jumbo, and some will even never admit a mistake but leave it to their heirs to find out.  Those who use both F/A and T/A are usually rewarded for their expertise at times like these.

picture

So what’s my point?  It all depends on three things: one’s time horizon, your stomach for risk and reward, and your willingness to act quickly. Alternatively, to be prudent, patient and pounce when the all clear has been signaled.  Types 1 and 2 are short term players who are accustomed to high risk, look for quick turn-around and are nimble.  Types 3 and 4 would rather wait it out before they act, as discussed below:

  1. The Day and Moment Trader – If your time horizon is very short term ala a day to a week – you are comfortable on all three points so it is extremely important to try all the tricks of the trade and to measure this up and down and in your lady’s chamber stuff with a fine tooth comb and with precision.  These are the true GANN, Fib and Elliott Wave types.  They wallow in it and more power to them.

  2. The Swing Trader – If your time horizon is a few weeks as a swing trader, you are itching to hit the quick moves up but don’t have the stomach to bottom fish in real time or find every nuance of what’s happening today to the “enth” degree then you look for the likes of Bingos followed by Eurekas. You also watch the friendly investment newspaper to tell you whether they grudgingly give you a qualified follow through day or a strong go signal.  Well, we got a grudging follow through day message the other day and so we are still in turbulent waters, and all of us would agree.  What’s more by now, you surely have been bitten as you stuck your toe in the water, because you don’t care to or know how to bottom fish in a moment to moment trade environment.

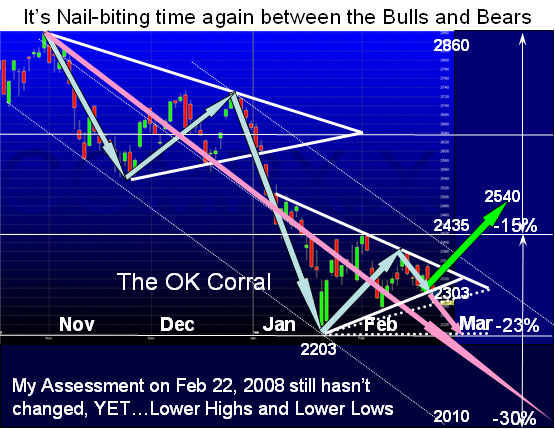
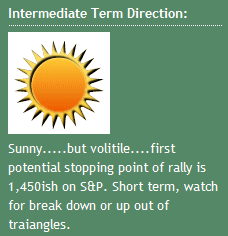
  3. The Intermediate Term Trader – They have little stomach for being faked out.  They are prepared to wait for the usual decent move up from a bounce play before you will consider looking for long side opportunities.  In my terms that means you want assurance that the ball is currently at the 50 yard line which by now you well know is the half way blue line between the Market Top and the Current Base Low, which you have now seen drawn on the three blogs featuring the Fight between Bulls and Bears at the OK Corral.

  4. The Long Term Buy and Hold Type – They are not prepared to take any risk, but want to be re-assured that having got out, they can come in and stay in for the long haul of several months to over a year; especially since this blog and others all around you tell you we are on the verge of a bear market or in one and worse yet tippy-toeing into a Recession. 

It is for the benefit of the last two types that I purposely introduced you to the thick blue pencil process, which you have recently seen on my blog notes and today in the Newsletter.  The Keep It Simple Stupid (KISS) approach really works well if you will just look for higher highs and higher lows for you decide when it is safe to come in.  All the rest is “if, and or but, coulda, shoulda, woulda stuff” that is best left to the pros at the short term game. The first lesson in the Thick Blue Line Keep it Simple process is shown below. 

five year

   So if you are a category 3 or 4 type these are the process steps to remember:

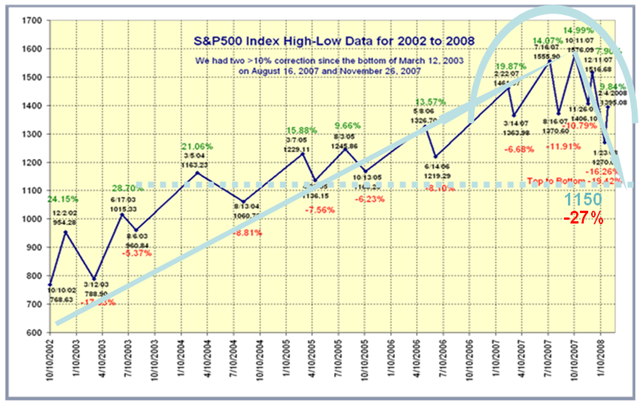
  1. Over the five year period from 3/12/2003, we had a long rally with higher highs and higher lows

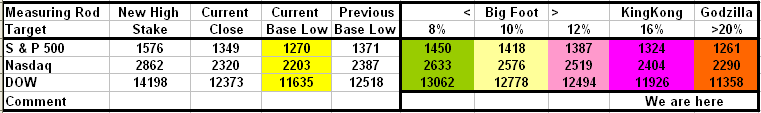
  2. The corrections on the S&P 500 have essentially been < 8% since from past history we know the probability is 77% that they will not be more than that, and it behaved according to form. 

  3. Once you see a -11.91% correction as we did in August, that’s the time to begin to consider lightening up on your long term positions fat with profits, especially if they are laboring at the top.

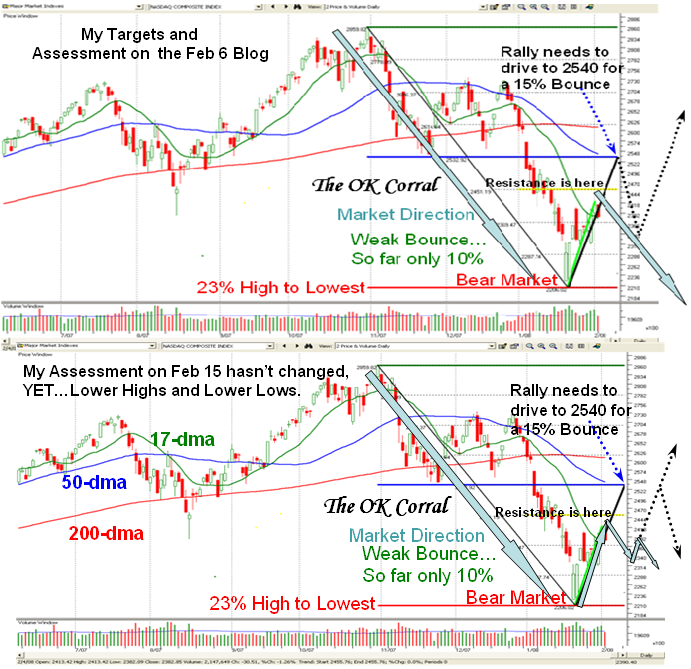
  4. The moment you see a Lower High followed by a Lower Low, the party is over.

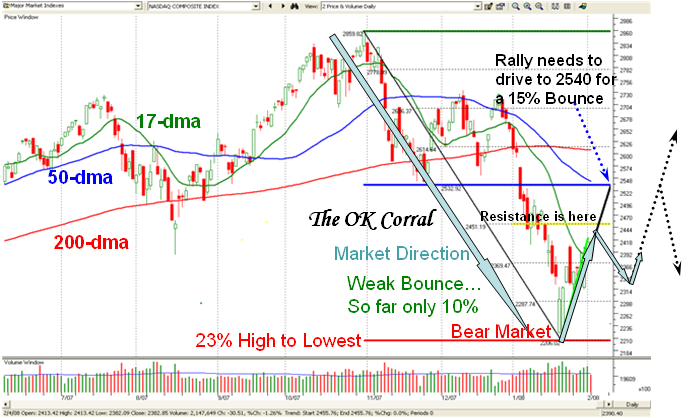
  5. Get your thick blue pencil out and draw the two arrow lines to remind you the direction has changed, and then for good measure draw the McDonald’s Archway, especially when it does it twice in a row to confirm that we are definitely headed down until further notice.

  6. If there is a major break to the downside, expect exhaustion and a Bounce Play.  That is when you draw the 50 yard blue line between the high and the low and wait to see if it can get back on the Bounce Play to that point. 

  7. Invariably you will be able to also define other points of resistance such as the 50-dma and 200-dma lines as shown which for sure keep you on your toes but hibernating in your fox hole.

  8. It is not difficult to set Targets that would seem obvious to anyone who can at least show sufficient interest to read a chart at the HGS 101 level.

  9. Then see if the Market can achieve those basic targets or not.  When the Bounce Play peters out, draw another blue arrow downwards to remind you to sit tight and wait for more evidence, not withstanding Bingos and Eurekas and all that good stuff  that help the short term players analyze which way the wind is blowing. 

  10. I don’t have to belabor the point, but the bottom chart shows where we are at right now and at this stage we are essentially on the 25-yard line and half way to either making it back up to the first Target I set of 2540 on the Nasdaq or half-way down to retesting the Base Low and/or going down further into the doldrums.

 charts

Those who are Category 1 and 2 types and have studied the relationship of Bingo to Eureka will immediately understand that although the two signals in that sequence signify the start of a Bull Rally, it all depends on whether one is in a long Bull Rally or in the throes of a Bear Market.  A Bingo signal signifies exhaustion and/or capitulation to the downside.  A Eureka signal signifies irrational exuberance by Bargain Hunters to the upside.  Having just had a Bingo signal on January 22, 2008 followed by a Eureka signal 4 trading days later on January 28, we did in fact have a rally which was short lived, but we are currently in a retrace similar to other such rallies in a Bear Market:

  1. Of the six previous Bear Market rallies, three were long and three were short lived.     
  • The three long averaged 13% gain over an average of 70 trading days   
  • The three poor rallies averaged 5% gain for an average of 15 trading days. 

   2. On the other hand there have been nine different occasions since 1996 in Bull Markets where such signals bode well for an average move of over 20% up in the NYSE over an average trading period of 139 days, which is significant.   
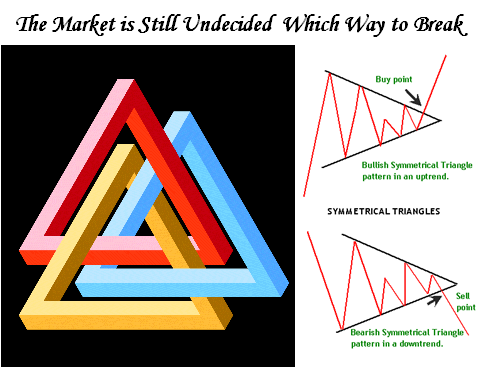
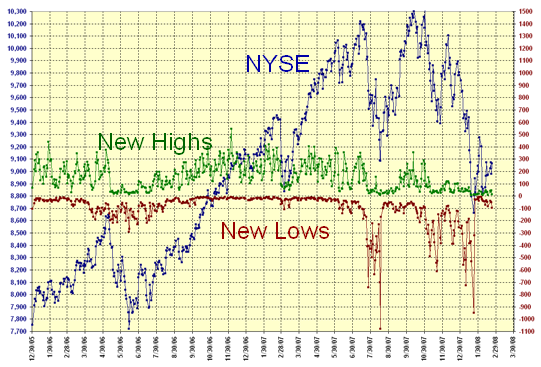
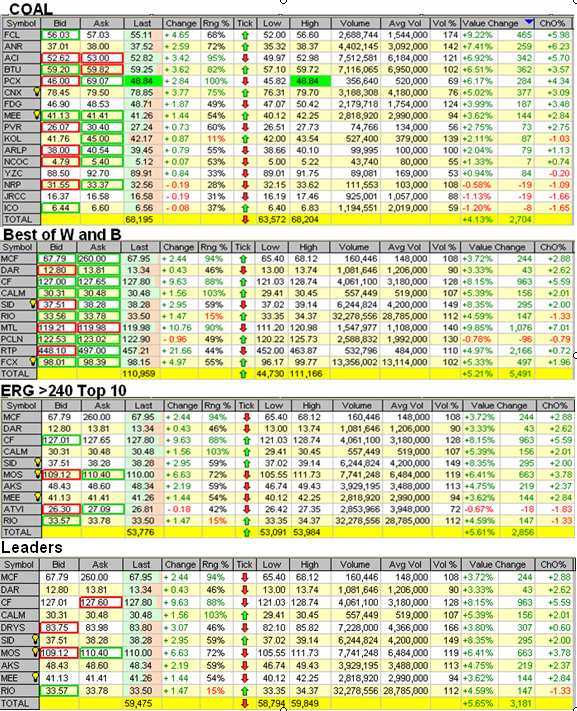
So, here we sit on a long weekend in limbo and the Market pointing down but can go either way, though the odds favor the downside.  What is surprising is that Friday was Options Expiration as well as preceding a three day weekend for the Stock Market, yet the Market rallied into the close.  Likewise, the number of New Highs AND New Lows are both exceedingly quiet at less than 50 each per day for the past 15 of 17 days.  On Friday we had 73 new lows.  We can examine the tea leaves to our hearts content, but I say yet again to the point of beating it to death until it is drummed into our heads: we cannot expect a significant rally until we see New Highs on the NYSE exceed 100 and preferably 150 for several days in a row. We are in the thick of Earnings Reports season, so rule #1 is do not buy any stocks who’s Earnings Reports are not out yet.  Even great earnings reports get met with “buy the rumor and sell the news”.  If you don’t believe me look at what happened to DRYS the other day…up over 6% in after hours having reported great earnings and then down about 8% the following day.  But tuck that piece of news away and of course the Transportation – Shipping Industry group is hot.  Nimble is your trump card…so here are the places of opportunity: 

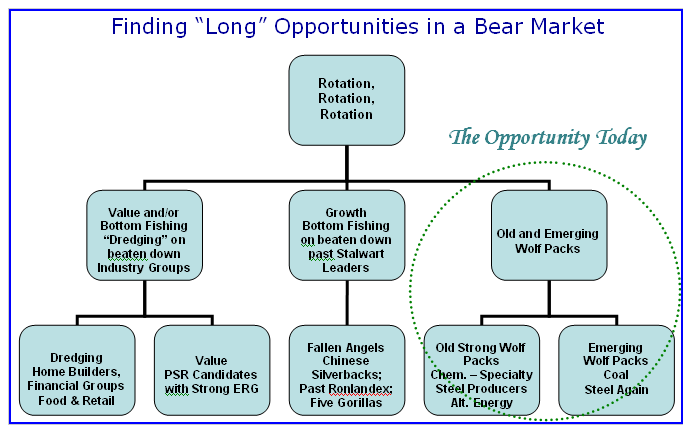
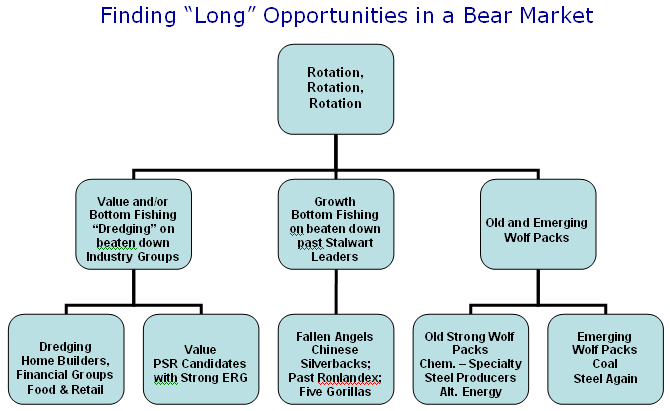
  1. Value and Bottom Fishing or should I say “Dredging” on beaten down Industry Groups
  2. Growth Bottom Fishing on beaten down past stalwart Leaders
  3. Old and Emerging Wolf Packs

…and because it is a nice long weekend for you to do your homework, here is the Family tree of where to hunt:

tree   Good luck to you all, and thanks to our new follower from Kuwait City, Kuwait who has just signed up for the newsletter!   Best regards, Ian.

Warren Buffet, the White Knight to the Rescue

Tuesday, February 12th, 2008

buffet

In my last blog I said “My take is there are very few Bulls with conviction at this point in time to provide a strong rally. So the conclusion is that some outside powerful surprise EVENT is all they can hang their hat on…” and sure enough we got that event today!  U.S. stocks bounced higher for a second day this Tuesday morning, with investors drawing a psychological lift from billionaire investor Warren Buffett’s proposed buyout of municipal bond insurers’ liabilities and another round of cost-cutting by auto giant General Motors Corp.  Billionaire investor Warren Buffett is offering to help out troubled bond insurers by offering a second level of insurance on up to $800 billion in municipal bonds.  Just when things were looking a trifle tepid by way of the Bounce Play, this surprise news gave the stock market a 200 point lift first thing this morning.  Whether it will hold is another matter, but it is a step in the right direction to get this Market off its lows.

Late Breaking News as I go to Press: It held, but it was a disappointing day with the Nasdaq finishing flat and the Large Cap NDX got hit hard after a promising start.  It is a trifle discouraging to say the least, when the Market seemed to be shaping up for a further follow through Eureka day to finally finish as a fizzle, giving up the 30 point gain that it had during the day.  Unless we see immediate excitement by way of “oomph” tomorrow, we can write this bit of news off as a one day wonder and I am sure the Europeans who seemed to take kindly to the Warren Buffet news must be wondering what happened here across the pond.  We badly needed a 2% point day for the follow through and all we got on the DOW was half  that.     nasdaq

The Bulls really need another strong follow through Eureka Day to propel the Nasdaq up to the 50-dma at 2540 BEFORE there is another drive by the Bears to take it down to test the Recent bottom at 2270.  The opportunities for the Bulls have been in essentially three different buckets according to your fancy: 

  1.  Value and/or bottom fishing “dredging” on beaten down Industry Groups such as Home Builders, Financial Groups and some Retail.
  2. Growth Bottom Fishing with Fallen Angels on beaten down past leaders who have lost >30%.  They include the likes of AAPL, BIDU, GOOG, GRMN and RIMM.
  3. Old and Emerging Wolf Packs with Coal the best of the bunch recently, and other faithful groups such as Chemical – Specialty, Steel Producers, Alternative Energy and Gold. 

Although there have been some excellent short term gains to be made to the upside, the best tactics right now are to play the short term to the upside and take what you can get.  Of course, the market will fool you every time as the expected play is another test to the downside in what is still a Bear Market and until the market Internals show us a markedly improved scenario, the retest of the lows is the general consensus.  Allen Nevalainen on the Yahoo HGSI bb has been doing intense work around potential upside and downside targets and I see he likes the Measuring Rod (MROD) technique of simply displaying the various levels that come naturally to HGS Investors, so here is the latest update on that picture.  He had tagged 1333 as a key threshold for the S&P500 and we seem to be through that barrier for the moment.  The “50-yard line” in my OK Corral picture is always a key level especially when it coincides with a key moving average like the 50-dma, and Allen has taken to it as a duck takes to water.  He applies that concept to the intermediate rallies as well to show potential swing trade pivot points where the Index must hold for the short-term bias to change.  He does good work.mrod At least we have been spared from a rout to the downside for now, and hopefully any retest will abate at or near the Current Base Lows shown in the chart above.  Please realize that we will need a 25% return from such levels to just get back to the old high, so that a very strong rally is needed to achieve such a target for the upside when and if we launch a strong rally.  Let’s take one small step for the bulls by holding the 200 point gain established first thing this morning, then we can worry about one giant leap for the Stock Market out of this mess.   Unfortunately, it was not to be. Best regards, Ian.

Copyright © 2007-2010 Ian Woodward
Disclaimer: Commentaries on this Blog are not to be construed as recommendations to buy or sell the market and/or specific securites. The consumer of the information is responsible for their own investment decisions.