Ian Woodward's Investing Blog

Archive for the ‘HGS Principles’ Category

Black Spot Disease and Rust – Simplified

Tuesday, September 11th, 2007


In my last note I mentioned Rules of Thumb for quickly establishing if a stock is extended.  I call it Black Spot Disease (BSD) and Rust after Rose Diseases.  My wife loves her garden and grows roses with tender loving care and she is always using her flit gun to get rid of the diseases.  So I took a leaf out of her book and go after my stocks with the same care!  Here are the parameters:

BSD and Rust Numbers

Tim Higgit who is one of our loyal clients came up with a brilliant idea for charting the BSD and Rust parameters in the HGSI software, and I am featuring his work here in this note.  I built on his concept by adding a Red line as shown down in the 200-dma window to show that DRYS, the stock I covered in my previous note on the High Jump Indicator, had reached a peak of 160% from its 200-dma.  You can immediately see that the Rules of Thumb work very well to give one the clue that DRYS should peak again at between $85 and $87 as shown on the chart.  For HGSI customers, this Charting View is posted on the HighGrowthStock.com Yahoo Bulletin Board for you to download into HGSI:

BSD and Rust Chart

Best Regards, Ian.

The High Jump – The Most Trusted Tool I Invented

Sunday, September 9th, 2007

High Jump 


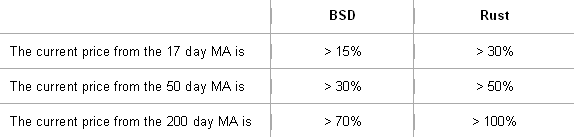
At a recent seminar I was pleasantly surprised to find that many in the audience make use of the Ian High Jump Indicator I have developed to establish when a stock is extended and due for a correction. There are three elements that will guide you to understanding when a stock is fully valued, relating to the % distance of the stock’s price from its 17 Day, 50 Day and 200 Day Moving Average. Just as the fundamentalist is concerned when a stock is overvalued and generally applies the yardstick of P-E to establish this, we can also use Technical Analysis to arrive at the same conclusion. The concept is very simple, and can certainly be a good guide for extended stocks.

Those who are lazy and/or do not have time need to remember only one rule of thumb.  Fund Managers will invariably take profits when the stock has made 100% above its 200-dma.  In other words they feel the stock is extended, and rather than be greedy, they lighten up and take profits.   


I see my good friend Manu Kapadia’s son Vince is contributing to the highgrowthstock.com bulletin board.  Now he is a chip off the old block, and has no fear, but is a young tiger.  Yet he has learned the tricks of the trade and is super nimble.  He has just contributed to conversations on the bb on two hot stocks, DRYS and EXM.  So let’s cut to the chase and review the bidding:


 High Jump #2

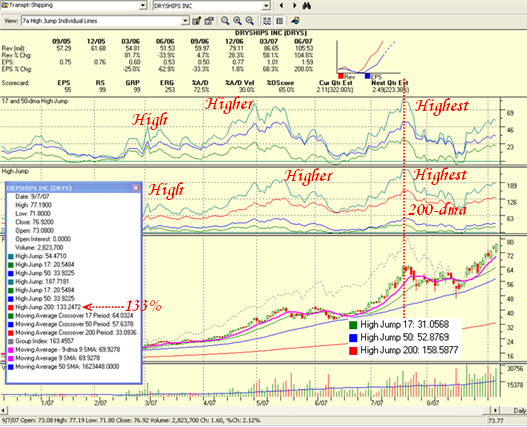
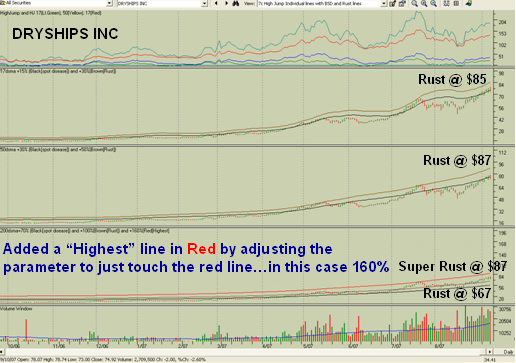
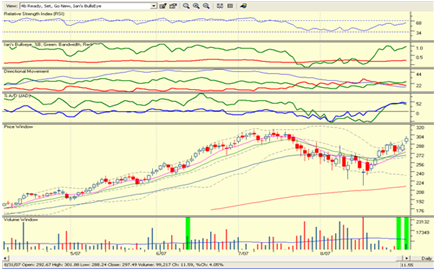
I show the High Jump at 133% up from its 200-dma, so we know it is in Rust Territory already, just like that rusty old car I show in the picture. 

The chart of DRYS above shows the High, Higher and Highest Jumps that it has made.  One can immediately see that the stock is currently at between the higher and highest level for the 17-dma + 50-dma on the upper window and at the Higher level on the middle window.  I show the High Jump percentages when it reached its highest level, and we see the highest was at 159% for the 200-dma so theoretically it has room to go another 26% on the High Jump.  Since the 200-dma is currently at $33 that means it could go to $85.47.  If we do the same arithmetic we get: 

  1. 17-dma   $64.0 x 1.31 = $83.84
  2. 50-dma   $57.6 x 1.53 = $88.13
  3. 200-dma $33.0 x 2.59 = $85.47 

It closed at $76.92, so there is a potential for another 15% up if it can reach over $88.  As Vince notes, the stock had a strong up day when the market sold off, so there is major upward drive. 

Late Breaking News on Sept 7: Analysts at Cantor Fitzgerald reiterate their “buy” rating on DryShips Inc (ticker: DRYS), while raising their estimates for the company. The target price has been raised from $71 to $94.  But the real reason for all the excitement is the EPS estimates for FY07 and FY08 have been raised from $7.28 to $7.75 and from $7.50 to $10.81, respectively. 

So with the stock the leader in the strongest group of all at this moment, there is a chance it can beat its previous highest jump and head for $94.  However with the market this skittish, realize that traders like Vince are prone to take their winnings and scarper…leave the scene of the crime in a hurry.  It only takes a couple of down days to take all the steam out of these high fliers.

The Message is with High Fliers like this, don’t sit there waiting to be taken out with a stop loss, but sell into the high and go.  Don’t get me wrong, you need to have a stop to protect yourself, but unless you can play with the mentality of a day trader who understands when the stock has peaked for the day, you will get stopped out at the low every time.  Likewise, you can’t afford not to get back in, because these trains leave the station fast.  The basic premise is you must understand that the stock is already very extended and you are playing on the steepest part of its ascent and therefore the most rewarding in the shortest time but with the highest risk.    

Best Regards, Ian.

HGS Investing Principles #3 – Review of the Game Plan Index

Monday, September 3rd, 2007

Most of you are familiar with the concept of the Iandex, which then became the RonIandex, where towards the end of a strong bull market rally, we select a minimum of 15 stocks in at least 12 Industry Groups, with no more than two stocks from the same Group.  We watch the Index behavior to give us a feel for what the Market is doing.   

We can take that concept a bit further and take a similar set of stocks after the market has corrected say 8% or so.  They are Leaders with solid Fundamentals, have just delivered an excellent EPS report and are essentially bucking the Market trend though have naturally given up some profit, but are not broken stocks.   

That is what I did with the Game Plan Blog Index of 18 stocks just one month ago on August 4th.  In that note I gave you the criteria, so I won’t repeat it here, and I suggested that if these leaders died the market was in for a lot more turmoil. Here then is the performance for the last two weeks compared to the S&P 500: 

Game Plan  

I also suggested that from a Charting perspective, you should watch three important facts: 

  1. All great leaders rise above the 9-dma, and as long as the Index stayed above that Moving Average the Index was very healthy.
  2. A healthy Index will stay above the 17-dma, but will often correct to it and then bounce.  Since the Index should stay above the Middle Bollinger Band, i.e., %B >0.5 (50%), there should be few Kahunas either up or down.  Ideally one would like the Index to have %B >0.7% to give us a cushion against a sudden drop in the market as a warning sign to liquidate ones positions.
  3. If the 17-dma is broken and then heads for the 50-dma and/or breaks it, watch out below.  The Chart of the Index still looks healthy though it certainly dipped down to test the 50-dma at the same time that the Market Indexes were floundering, but then quickly recovered on the bounce.

game plan #2 

Summary Results:

  1. The Index is up 98% and 157% on the S&P 500 after one and two weeks, respectively
  2. The Index is above the 9-dma, and all great leaders rise above it 
  3. 15 of the 18 stocks are still positive, i.e., 83%, and 61% are up from last week
  4. Although Acc/Dist is drooping, all signals are go on the Ready, Set, Go
  5. The two Eurekas for the NYSE though suspect with low volume, signifies a bonus plus
  6. A C&H formation and the %B at 0.8, which gives room to act if the market goes down
  7. A gain of 2.78% per week for 18 stocks shows overall strength 

The Message is the Market is still healthy, but this coming week should be the real test.   In my next Blog I will summarize what these three HGS Principles mean as mini-stakes in the ground and then reflect on the Macro picture for what will be the two most important weeks to come.

HGS Investing Principles #2 – Wolf Packs

Sunday, September 2nd, 2007

In the August 26th Blog I showed you how to ferret for Wolf Packs.  The particular one I showed you was the Chemical – Specialty Industry Group which caught my eye since there were 10 such stocks in the top 20 when I applied the 0a Key to All Securities, and sorted on the Combo Rank column.  No matter what list I look at, I always look for Wolf Packs as they often give clues as to “What’s Working Now”. 

Wolf Packs come in at least three different forms: 

  1. Industry Groups that have been trashed and show signs of life usually for a day or two and is invariably news driven.  An excellent example was a spurt of life the other day based on a rumor that Warren Buffet was buying the beaten down Housing Stocks.  Stay away from such wolf packs unless you are prepared to sit with dead money for a long time.  
  2. Industry Groups that are hot due to a theme or story in the market, such as the Energy Alternatives recently during the past several months.  These are excellent Wolf Packs provided you catch them early enough. FSLR, TSL, JOS come to mind in this group. 
  3. Industry Groups that have had a long run, have a very high long term Ian Slow Group Rank, but have recently been trashed and are showing signs of a re-birth.  This is the example I chose when I showed you the Chemical Specialty Group.  Here were the stocks I showed a week ago:


wolf pack 1 


The key point to observe is that the GROUP RANK for Ian Slow has gone up from 92 to 94 and this is a significant step showing continued long term strength.  I’m sorry I couldn’t maintain the same order, but take my word for it eight of the ten are up, albeit some only slightly.

wolf pack 2 

The more important picture is the comparison for the short term Group Rank which has jumped appreciably since a week ago.   However, the real message is to watch the wolf pack and wait for a down day and then on the next move up take the pick of the bunch.  They were FTK and ICOC at the time and I took the latter (as it was breaking out) for a 10% ride so far in less than a week.


wolf pack #3

Finally, the chart says it all…the Wolf Pack is alive and kicking, again showing that the Market itself is healthier than the flat performance of last week shows in the Indexes. 


Best regards, Ian

HGS Investing Principles – Using Different Investing Styles

Saturday, September 1st, 2007

Different

About a week ago I chose four different Investing Styles to give me clues for what’s working now.  You probably looked at the list and hopefully paused to think about what my message could possibly be, as I am sure you scour the HighGrowthStock.com website all the time.  Those who attend our seminars know me better by now, but I wonder if you got where I was taking you with the snapshot I showed you only ten days ago. 

Here is the update to the same four Investing Styles and we can certainly glean quite a few points out of this updated view:

 Using Diff #2

I know your eyes are squinting at this view, but the detail is not important…it is the color green! So what are the Messages:

  1. Pick the groups from StockPicker from the DAY BEFORE once you see a strong up day in progress in the market.  I originally showed this same set of groups after I saw a strong move upwards on August 22nd in my note “Looking a Gift Horse in the Mouth”.
  2. Go back and look at that note.  You will see that after one day Growth Investor and Swing Trader both delivered strong performances of 5.5% and 3.0%, with Value Investor and Best Stocks Under $10 behind, but respectable with 2.4% and 1.6%.
  3. The exact numbers are not important…what is important is that a basket which delivers 3% in one day is a strong basket, and Growth is better than Value at that time.
  4. Now fast forward to yesterdays results…granted on another strong day finishing up the week and eight trading days later.  11% and >9% for the same two groups of Growth and Swing Trader with all ten stocks positive tells me several things:


  • Say what you will, this market is healthier than we think and there is money to be made
  • Growth Stocks that are Leaders is the place to be
  • Doesn’t that sound familiar after watching  Ron Brown’s Movie today
  • There are five big winners in these two groups with 20% gains or better
  • It speaks well that STOCKPICKER groups give you a good starting point to ferret

Now dig further to get to the nuggets…take a look at the top 10 stocks from the four groups or whatever other menu you like.  Here is what you get:

Styles 3

It is exactly what you would expect…Technology, Telecom and Health Care is where its at.  Look at the # of Box 7 stocks and look at the Fundamentals in the last three columns. 

At this point, I’m sure you are saying “But I don’t have time”.  Of course not.  Ron and my job is to teach you how to fish, your job is to catch the fish.  More importantly, doesn’t that stiffen your backbone that there are opportunities to be found and that the HGSI software brings the cream of the crop to the top with its StockPicker Groups.  What you should get out of this note is to know the What, the Why, the When, the How, and the So What of ferreting for HGS Stocks.  Best Regards, Ian.


Copyright © 2007-2010 Ian Woodward
Disclaimer: Commentaries on this Blog are not to be construed as recommendations to buy or sell the market and/or specific securites. The consumer of the information is responsible for their own investment decisions.