Ian Woodward's Investing Blog

Archive for the ‘HGS Principles’ Category

Stock Market: Pause to Refresh or the Real Thing?

Sunday, April 22nd, 2012

The four month Rally is hanging on by a thread, but there are conflicting signals.  The general bias is down, but there are pockets of life with some stocks tight as a drum and heading up.  We have had rotation in the Leaders over the past month as I will show you, but the Leaders Index we developed at the March Seminar is showing signs of tiredness.  In all of this, hopefully the Impulse Indicators I have developed will help you determine whether we are in a Pause to Refresh or the Real Thing!  Sing along with me…AyeAyeAyeAye (iiii):

I have a lot of slides for you today, far more than usual, so I will keep the commentary short:

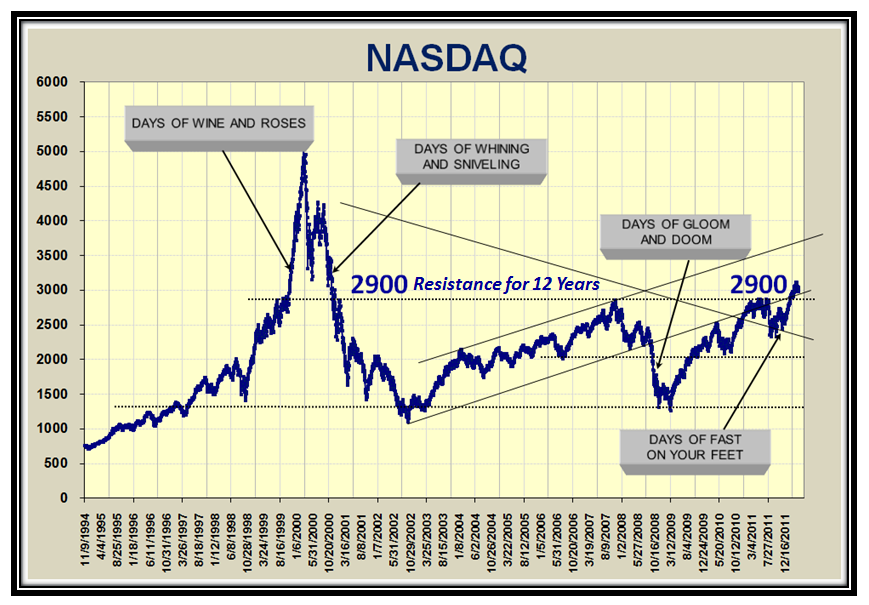
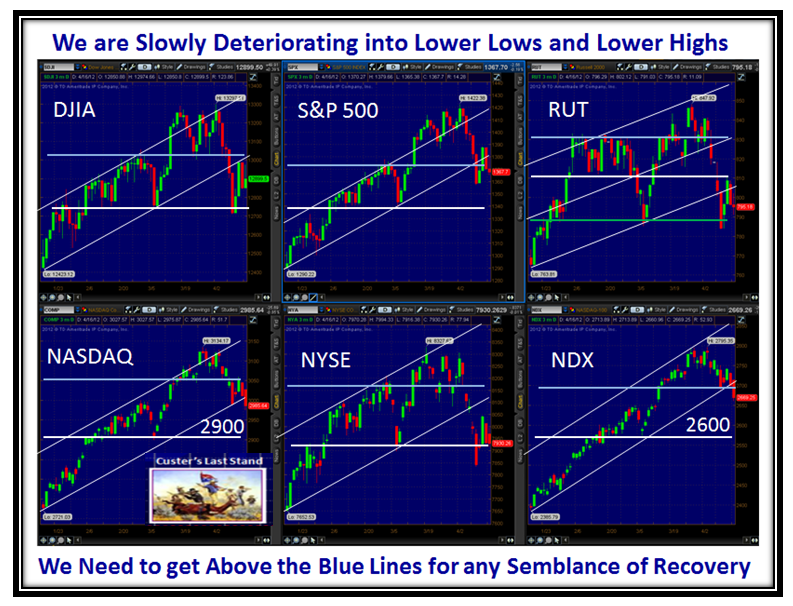
2900 on the Nasdaq has been resistance for 12 Years, and now we must hope it will hold at that level or move up:

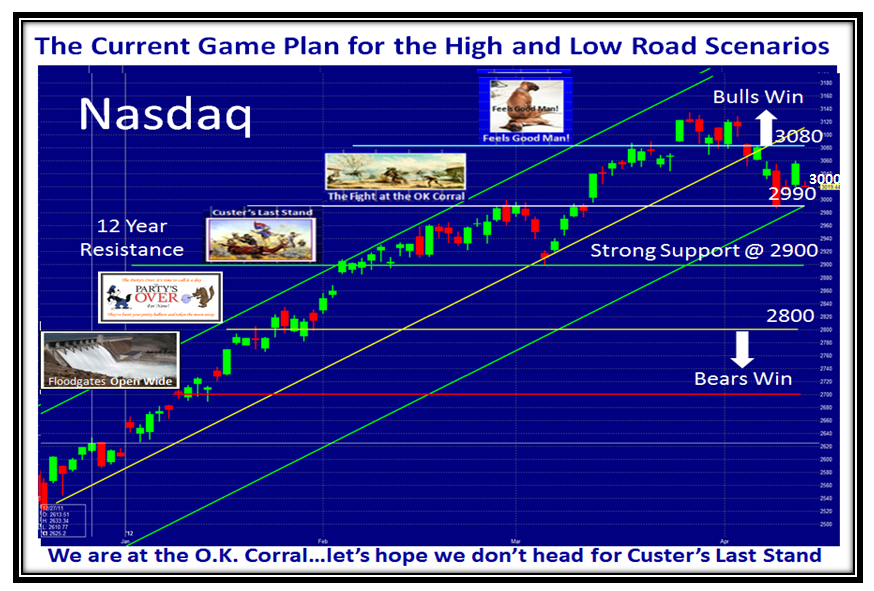
The Game Plan is simple, and I have coupled the stages with my favorite Pictures which suggest where we are:

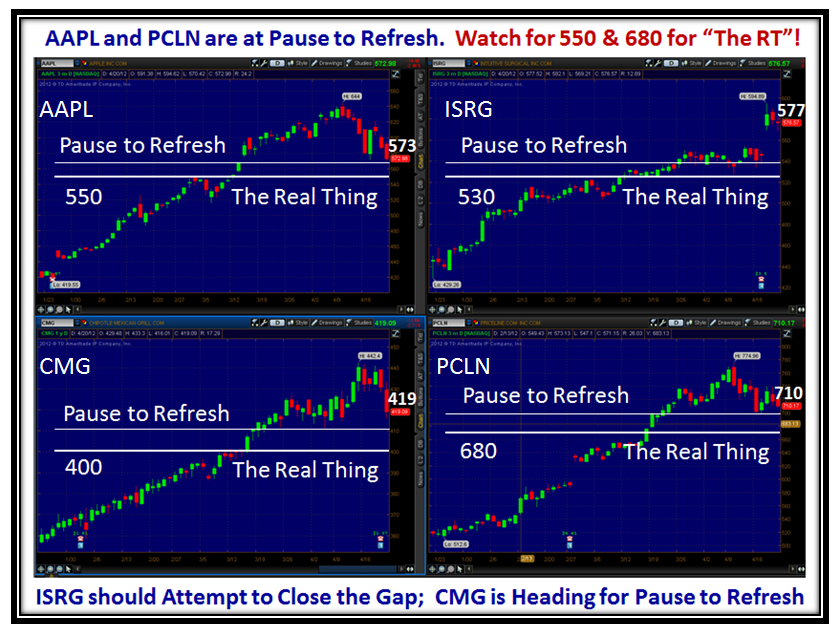
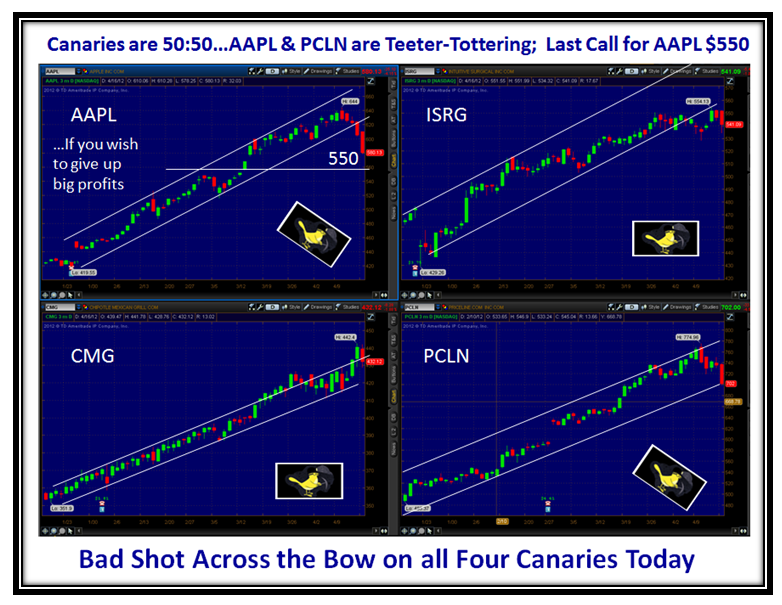
Let’s look at the Canaries;  AAPL and PCLN are at Pause to Refresh.  I show you the Real Thing Downwards:

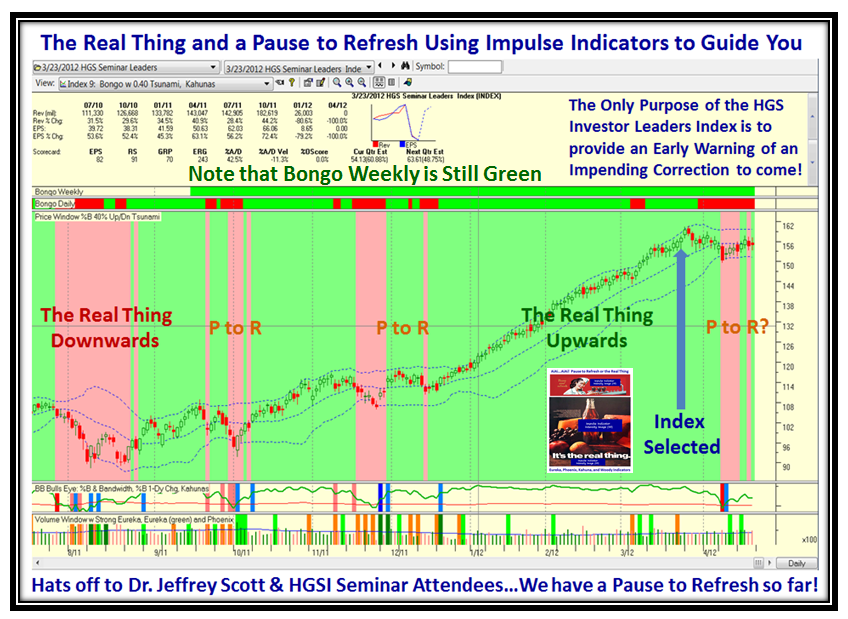
But “The Real Thing” can go either way as I show on this next chart of the Seminar Leaders, with Hats Off to Dr. Jeffrey Scott and the Seminar Attendees.   Make sure to sign up for his Webinar tonight for his latest findings.

Space is limited.  Reserve your Webinar seat now at: https://www2.gotomeeting.com/register/663790210

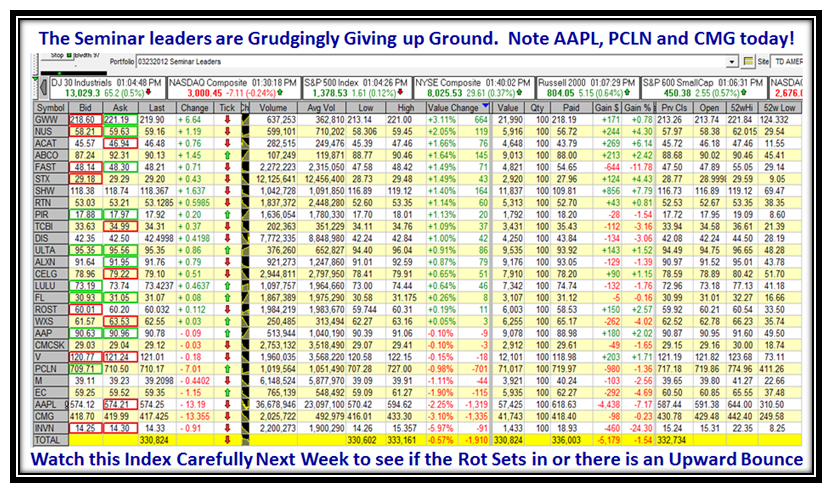
We are at Pause to Refresh and could go either way after a month in a churning mode:

…And here is the list of those stocks and their performance over the past month:

Now let’s take a leaf out of my good friend Ron Brown’s book who has done an excellent Weekly Report on this same subject and you need to make sure to download it.  “How to find the leaders to tell which stocks are still strong in this market.”   Copy and Paste it into your Browser:

http://www.highgrowthstock.com/WeeklyReports/

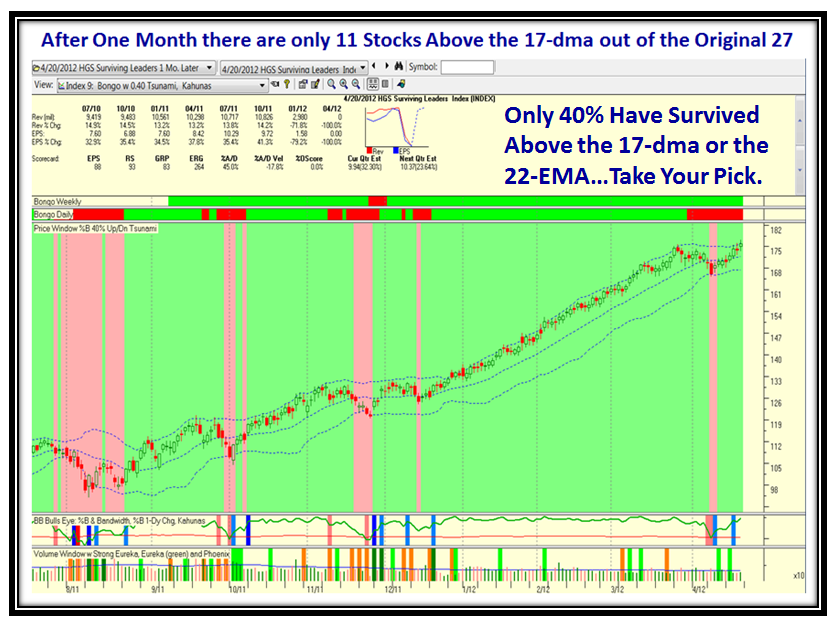
Here is the Index of the stocks that are still above the 17-dma from the list above.  We are down to just 11 Stocks:

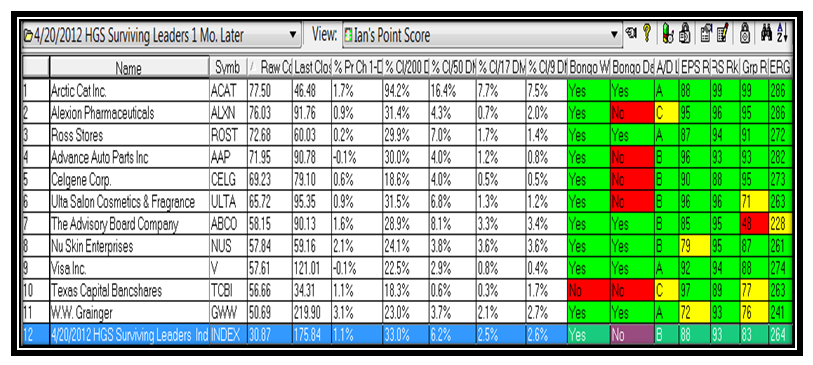
…And here is the list:

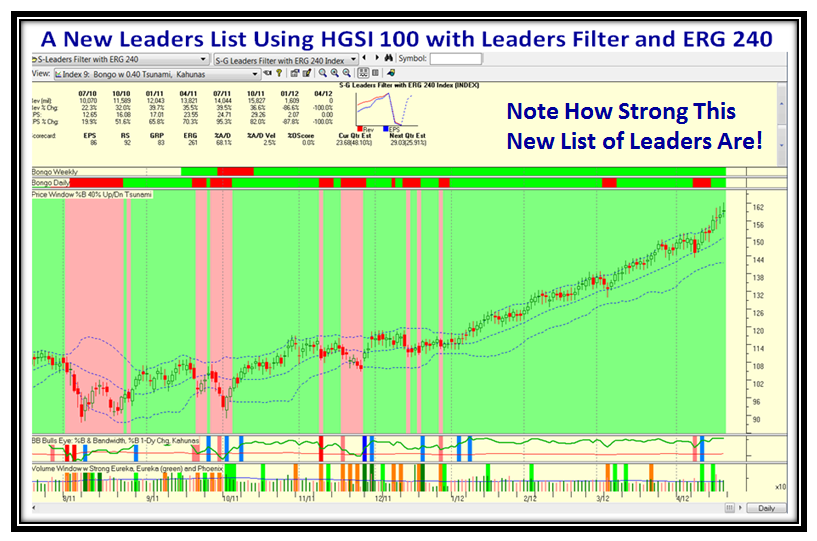
Let’s look at a New Leaders list Index using the HGS 100 as Ron discussed in his Weekly Movie:

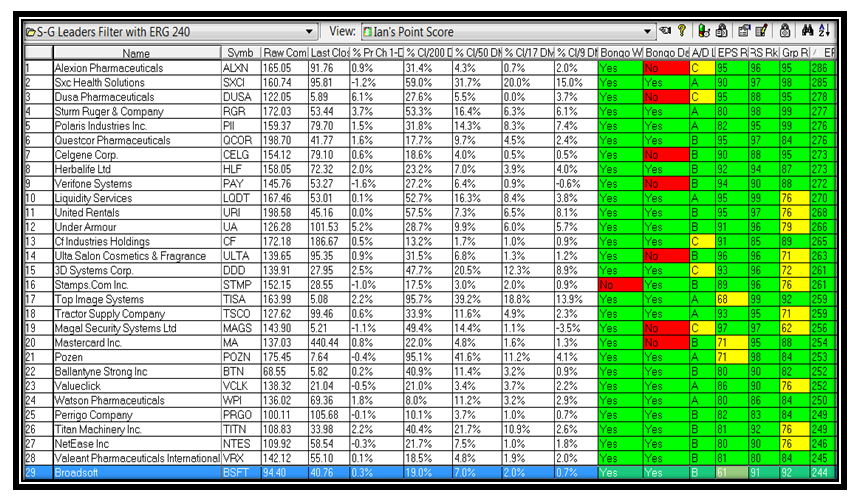
…And here is the List:

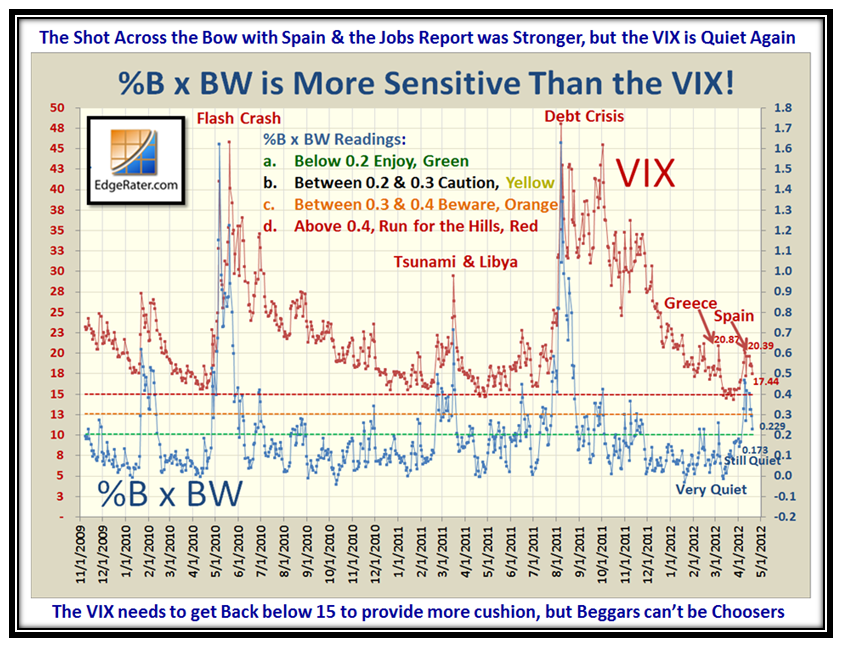
Let’s not get too excited, but the VIX went back into “Quiet Mode” after the recent stirring from Spain and Jobs:

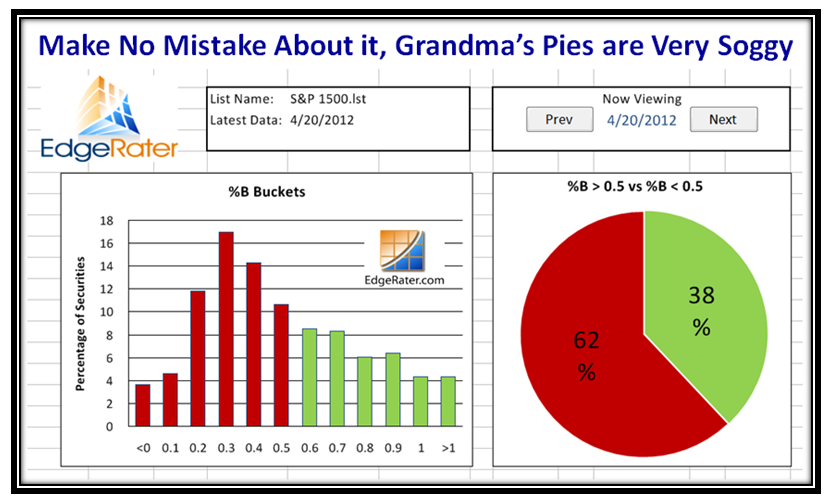
Now for the Gloom and Doom side of the equation, so that we review both points of view:

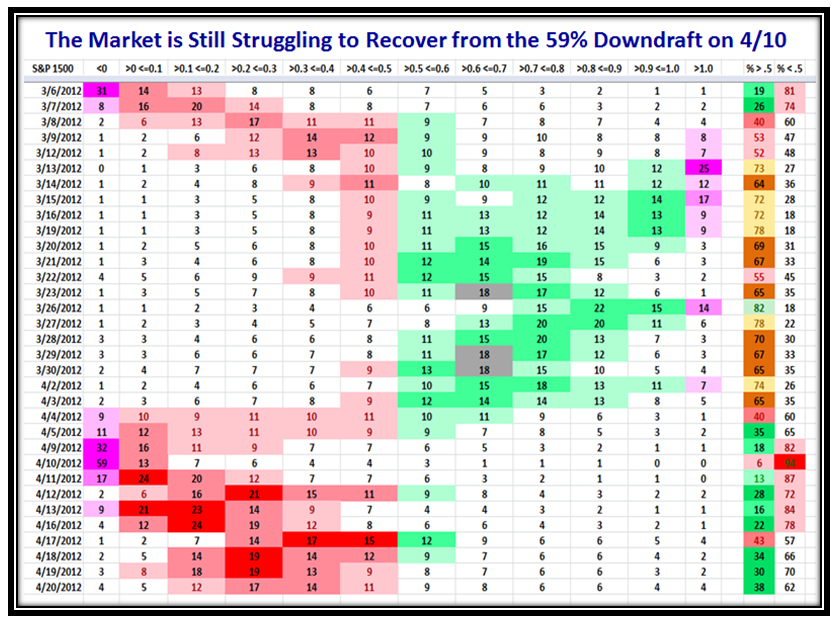
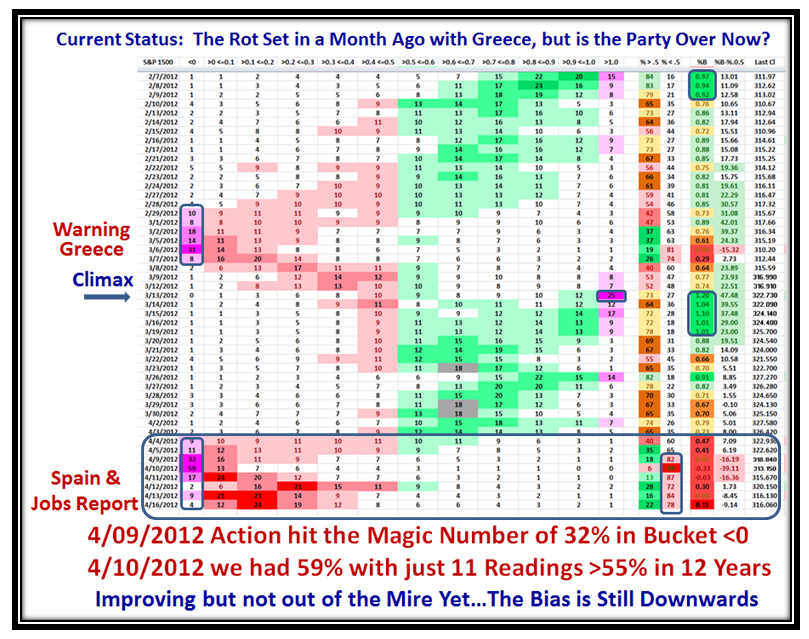
That 59% in Bucket <0 (below the lower BB) has taken its toll, and it seems we currently have “bifurcation”:

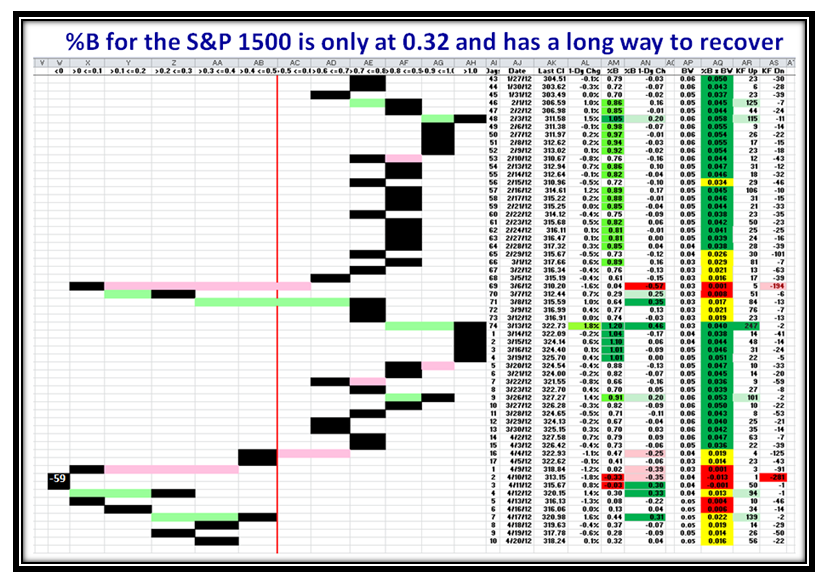
The next chart shows that we are by no means out of the woods, and there is no question the S&P 1500 is weak:

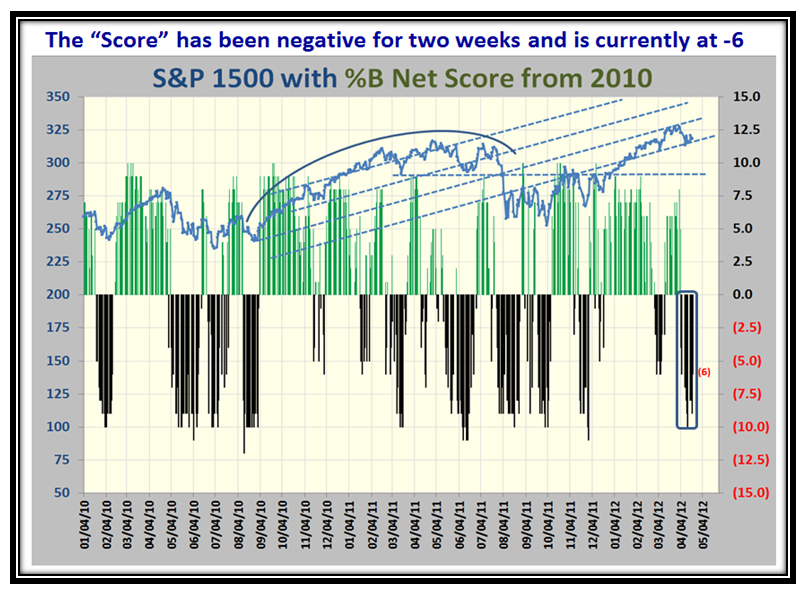
…And the overall Point Score is -6 which means we have to lift the Index a lot higher than it is now:

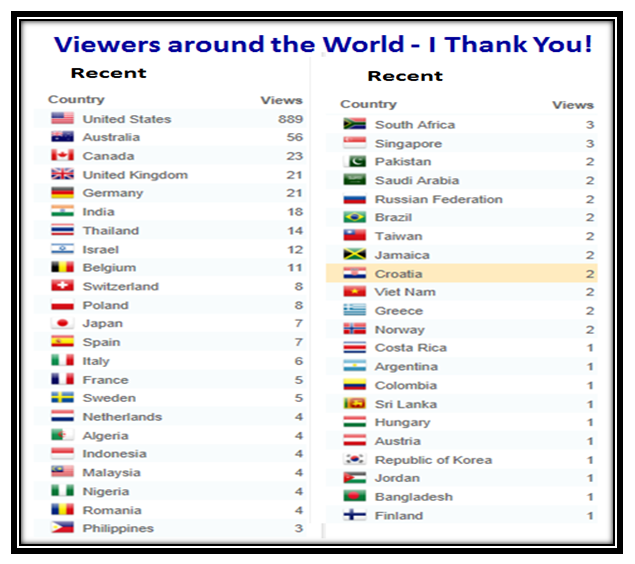
Each week I say that the next week is critical to getting us out of limbo and either the Market is showing that the Real Thing is either Downwards or Upwards.  My thanks to all the people around the world that support my efforts to keep you appraised of the balanced view of the Market.  Let’s hear from more of you:

Best Regards,

Ian.

Stock Market: Wonders Never Cease!

Tuesday, April 17th, 2012

Last night I wound up the blog note with “The Bottom line is that either there is a Major upward surprise thrust or we continue to drible on down to the next level of support which is certainly “Custer’s Last Stand” at 2900 for the Nasdaq.”

Well, Wonders Never Cease and we got that surge today!

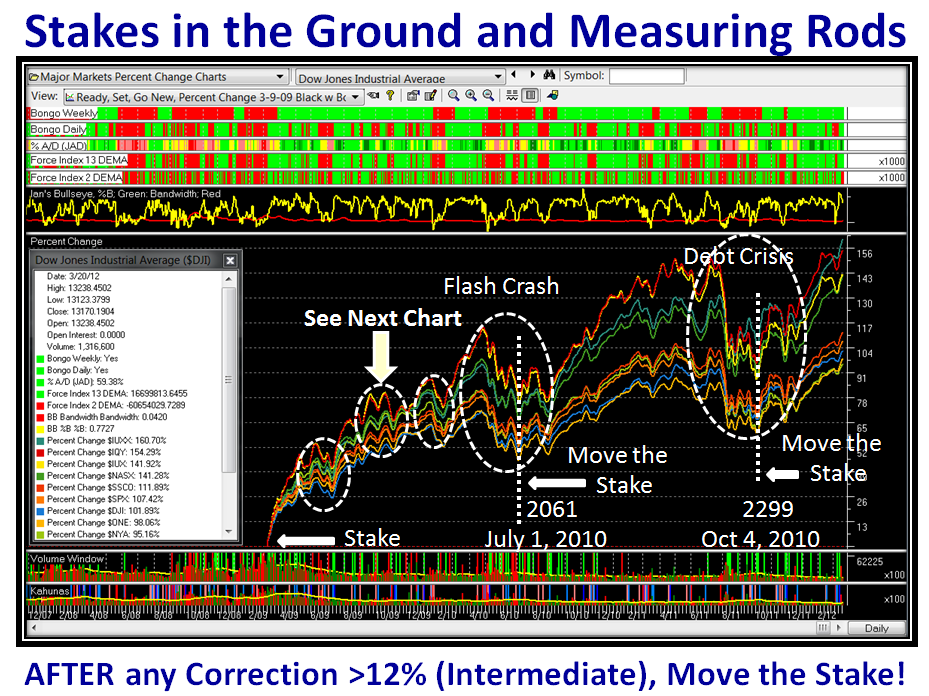
So we have a reprieve from what seemed the inevitable drip-drip process when markets are reaching a peak.  As I am sure you have realized the approach I use is to establish Benchmarks through past History to bound the “What If” scenarios.  The Stakes in the Ground and Measuring Rods come from significant points in time when the Market indicates unusual 1- Day Changes defining action at Overbought and Oversold points in time depicting Fear and Greed.  Days like today come and go and fade into the distance, but by capturing these unusual Impulses as they occur we have a roadmap of the tug-o-war between Bulls and Bears.

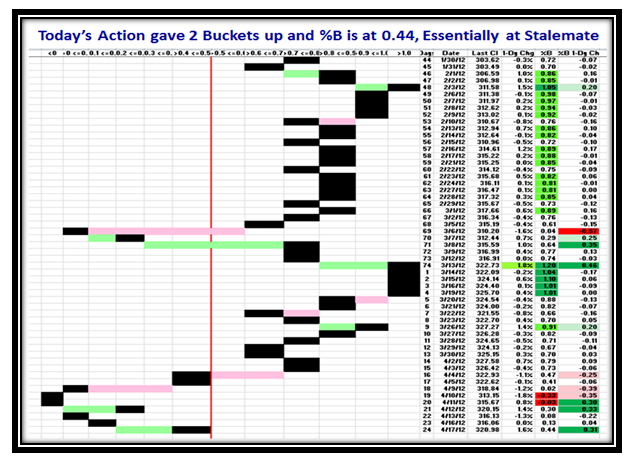
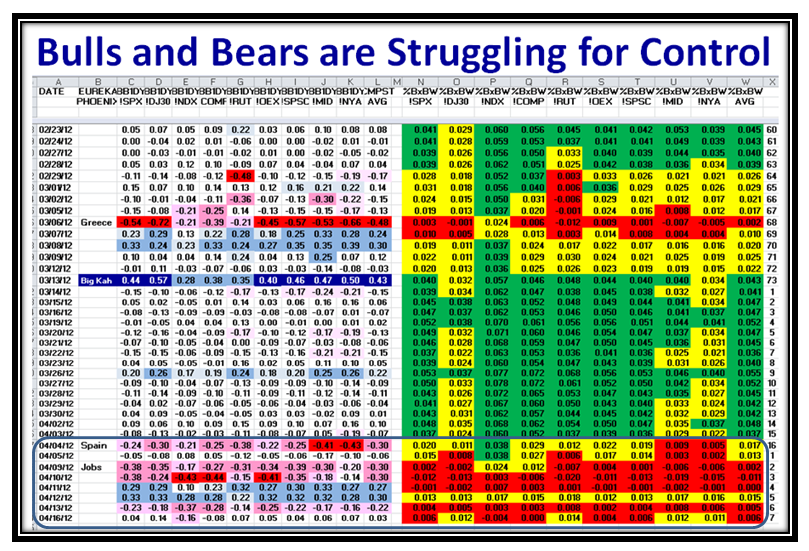
These Impulse Indicators capture the INTENSITY of the move so that we can make judgments as to the possible direction of the Market.  The likes of Eureka, Phoenix and Up and Down Kahunas have become staple diets in dicephering the probable direction especially when the preponderence of the move remains unchallenged instead of a see-saw tug-o-war which define uncertainty.  Yesterday the Bias was down, today we have a two bucket skip up and we are back in the area of Stalemate!

Any daily change of 2% or greater up or down is invariably a sign of a shot across the bow, so that I felt you would like to understand the “Sweet and Sour Spots” of the past for the last 12 Years on the Nasdaq:

The bottom line message and Rule of Thumb of the above chart is that the occasions to sit up and take notice of potential changes in market direction occur about 10% of the time based on the twelve years worth of history on the Nasdaq.  Within a week you and I will have forgotten that we had a 1.82% up day today, but the beauty of using Impulse Indicators such as the Eureka, Phoenix and Kahuna is they will invariably be triggered to give us the framework of the Market action.

When Bulls and Bears are at Tug-o-War, one immediately understands the instabilty and therefore the caution one should apply to your Investments.  Clear sailing is when the Positive or Negative set of Impulses go unchallenged which then sets the new direction or a confirmation of the old:

Where this Market goes tomorrow is in the lap of the gods and no one is clairvoyant, but what we do know is that all good leaders rise above the 17-dma which is the green line in the above chart.  So the market has work to do to recover from the small correction of about 5% it has had to date.  That line provides the immediate resistance, so we should watch that like a hawk.  Any further new impulses shortly to the upside will provide added fuel to the move, or anything to the downside negates the bias…it is as simple as that.  We are at Stalemate:

The Large Cap Leaders of AAPL, PCLN and ISRG all had strong up days today as did the entire NDX!  Good luck.

Best Regards,

Ian.

Stock Market: On a Wing and a Prayer

Monday, April 16th, 2012

The hour is late and this will be a short and sweet update:

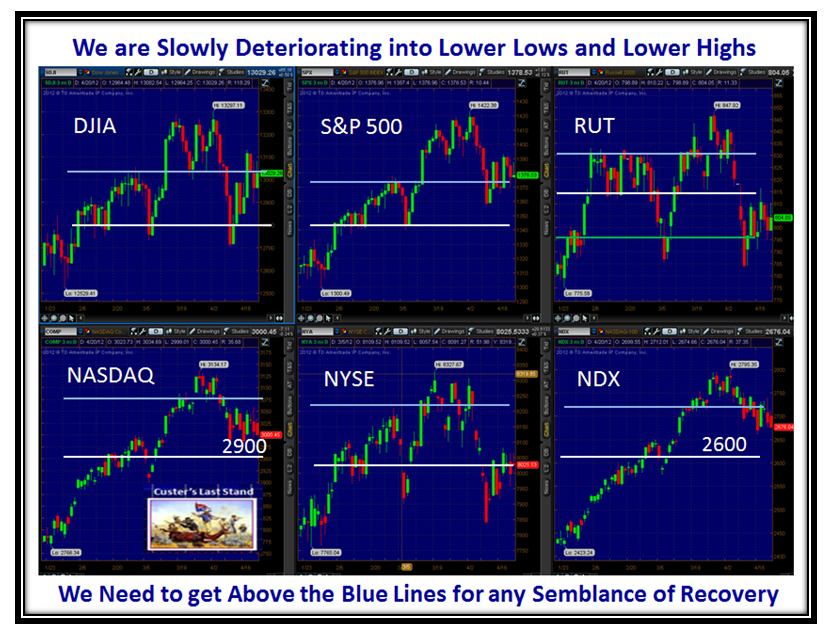
All the Major Market Indexes except the DJIA took a small hit today with the Nasdaq and NDX hit the worst:

And here are the Canaries with AAPL and PCLN teeter-tottering:

The 59% of S&P 1500 stocks below the Lower BB (<0) took the stuffing out of the Market:

…And here is the evidence that shows the Market Indexes are struggling.  The Market has been in a Correction for the past seven days:

The Bottom line is that either there is a Major upward surprise thrust or we continue to drible on down to the next level of support which is certainly “Custer’s Last Stand” at 2900 for the Nasdaq.

Best Regards,

Ian

Stock Market at Crossroads

Sunday, April 15th, 2012

Ron and I have been busy producing the April Newsletter which is now published:

Overview:

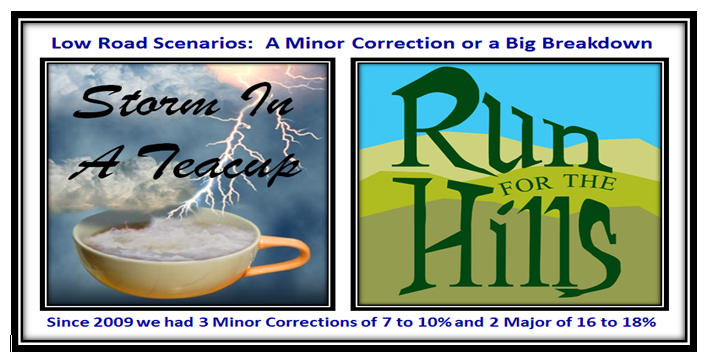
The Stock Market is currently at the crossroads of holding after a very Minor Dip so far of only ~ 5%, or heading on down for a normal 7% to 10% Correction as we experienced in the first three Corrections in 2009 during the long Bully Rally. Now for sure we have Double and Triple Top Scenarios on most fronts.  The $64 question is whether the shot across the bow on March 6th over the Greece kerfuffle followed by the more recent deeper pullback on April 9, 10 and 13 with the poor Spain Bond Auction coupled with a poor Jobs Report is a Storm in a Tea Cup or a warning to Run for the Hills as we close out the week on another down day of >1.25% on most Market Indexes?

The Major theme for this month is the High Jump Tool and an update of the Benchmarking of Fear and Greed.  I have reviewed the High Jump to give insight into this valuable concept which you will find only available in the HGS Investor Software.  I cover the High and Low Road Scenarios and a Review of the Market at this critical stage.

Ron covers “The New America Case Study”…a quick way to home in on up and coming Companies with strong Earnings.  Ron and I will give a brief demonstration at the Roundtable scheduled for Thursday April 19th. at 4.30 to 5:45 ET.  The emphasis will be on the New America Study.

Not a Monthly Roundtable Newsletter Subscriber?

Consider the value! For the current price of $200 a year, $16 a month you are getting the latest research from Ian Woodward that is not published elsewhere plus the latest HGS Investor software techniques from Ron Brown. To make this subscription even more valuable, you also get a seat at the W&B Round Table where a topic from the current month’s newsletter will be discussed in more detail. 

Attendance will require registration. If you are not a subscriber the registration will not be accepted. The session will be recorded and the video posted in the monthly newsletter section of the website for subscribers.  Please click on the following link to Register:

https://www2.gotomeeting.com/register/205015850

Best Regards, Ian.

Benchmarking Fear and Greed in Bull & Bear Markets

Monday, April 9th, 2012

Anindo asks an interesting question to compare Corrections in Bull and Bear Market Rallies:

Thanks for a timely blog Ian.  I note that %B < .5 is now 60 %. Is there a difference in how high %B < .5 gets in a bear market in 2011 vs a 5 to 8 % correction in a bull market that we saw in 2009.  The action in the leaders like AAPL, PCLN, MA, V, KORS, FIRE, CMG, ALXN, BWLD, LNKD all indicate a healthy market.

That may change on Monday as S&P futures are down 16.75 to 1373.5.

Thanks,  Anindo

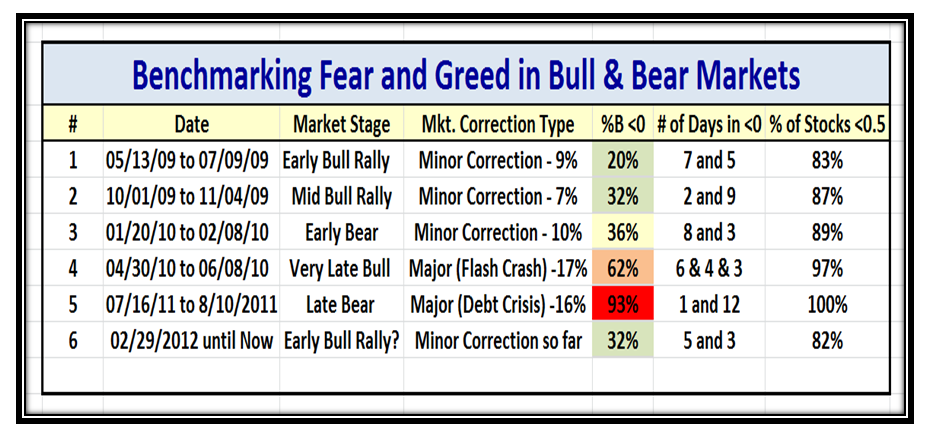
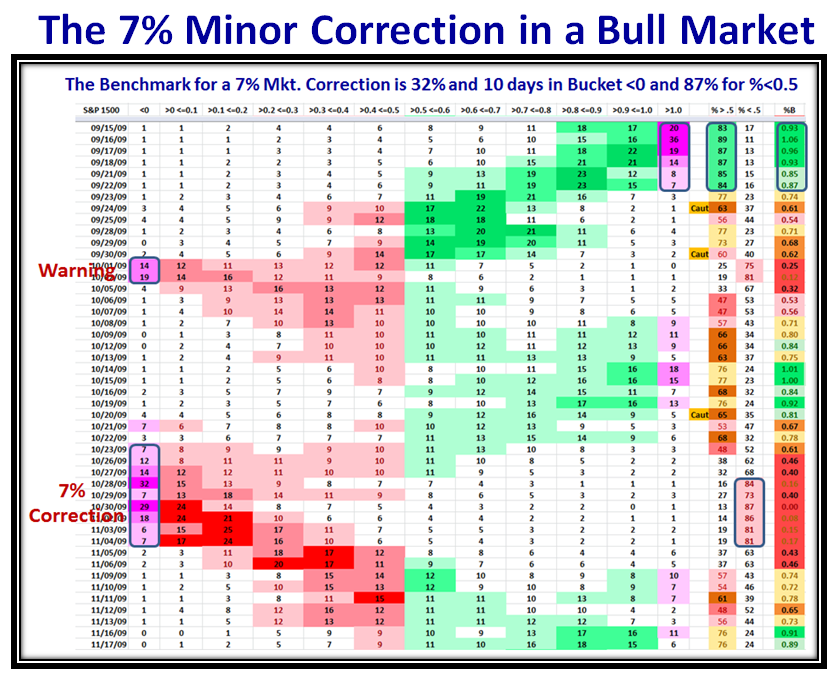
I had to dig back into the archives to give you a cogent answer.  I have used two Benchmarks to give you a good feel for the comparison for Minor and Major Corrections in Bull and Bear Markets.  I used October 2009 and August 2011 (Debt Crisis) for 7% and 17% Corrections, respectively. There is a lot of information on the charts which I have “ringed”, but let me get you to the Bottom Line Message before I unfold the nitty-gritty grimbling:

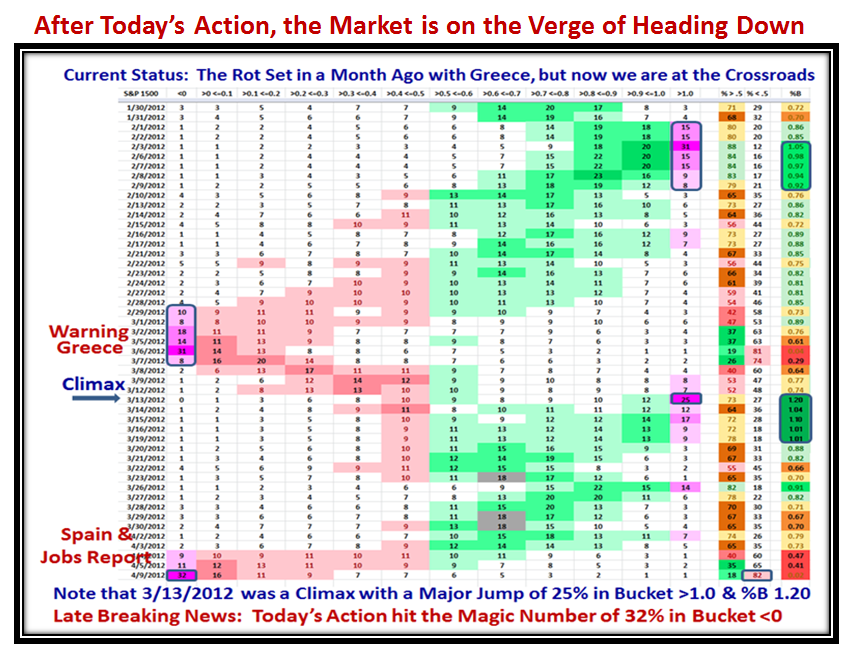
If %B in Bucket <0 exceeds 32% (~1/3rd of the S&P 1500 stocks), we are in for more than a Minor Correction.  Let’s see what transpires from here.  It will be particularly interesting as this is the first time in recent memory that we have so many LLUR’s (Lower Left to Upper Right) tight chart patterns still holding up that it will be a major tug-o-war between these and the others that have already been hit, which could determine which group wins out.  Late Breaking News says we hit 32% on the button today, so it makes this review very timely as the next few days will determine if the Market will hold or the floodgates open.  I have summarized the key statistics over the last three years and provided you with enough detail to understand the process I have used.

The above chart shows that in Minor Corrections the magic number for %B <0, i.e., below the Lower Bollinger Band for the S&P 1500 stocks is 32% or about 1/3rd of the total number of stocks.  Also note that the % of stocks <0.5 must not be higher than 89%, and we are already at 82%.  The next chart shows when these corrections occurred and I have used Item #’s 2, 5 and 6 to show the details.

Here is the picture of the Buckets and key data for Item #2, the period of Oct to Nov of 2009, a 7% Correction.  Note that the first Warning sign was three weeks earlier before the Rally Paused to Refresh:

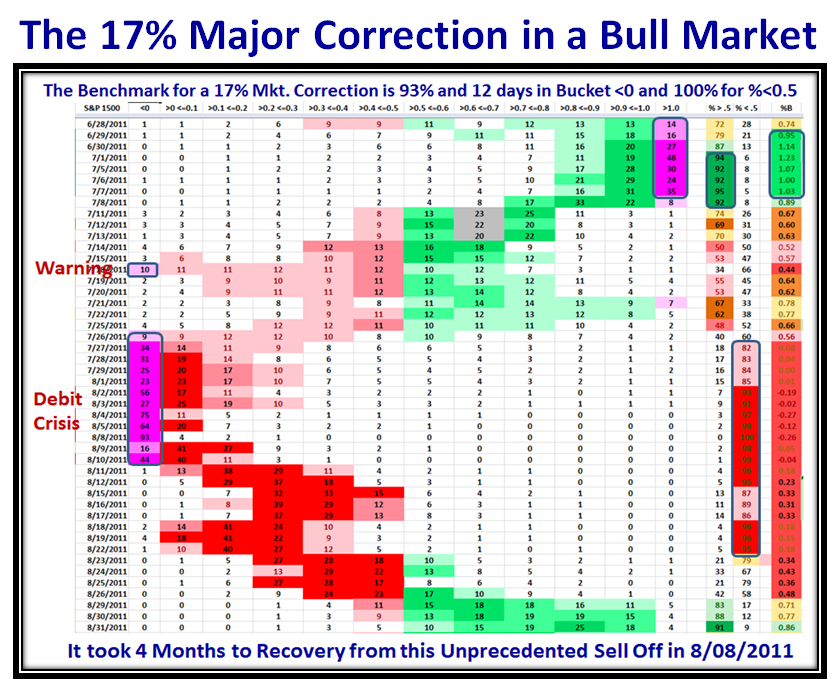
Let’s now look at a bleak picture which shows the dismal results for the Debt Crisis kerfuffle last August:

As you well know, these numbers of 93% in Bucket <0 and 100% of the Stocks below 0.5 are the worst seen.  Now let’s turn our attention to today, hot off the press.  We are sitting on a knife edge where we either see a Major push back up or the floodgates open and we either Pause to Refresh or go down for a full blown correction:

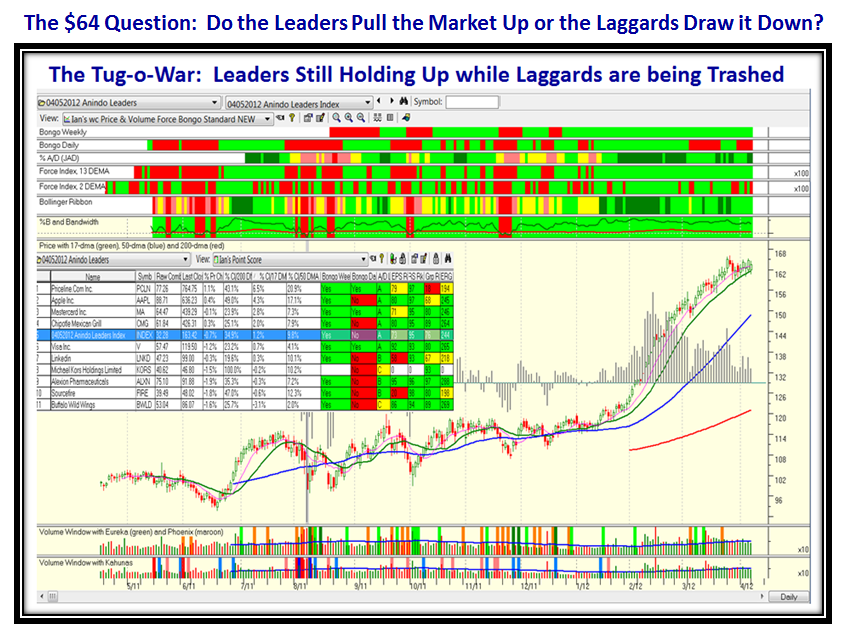
Those who attended the October Seminar are looking at the Leaders Index and scratching their heads as to what to do as we have not seen Leaders holding up so well while the rest of the market is exhibiting decay.  The “go to” stocks of AAPL and PCLN were actually positive today.  Since Anindo gave a list of 10 stocks he is following, I felt I would give him a bonus of his Leader Group chart which also shows the familiar pattern we all saw at the Seminar.  One of these days we might see him and a few others who sit down in San Diego again at the Seminars!

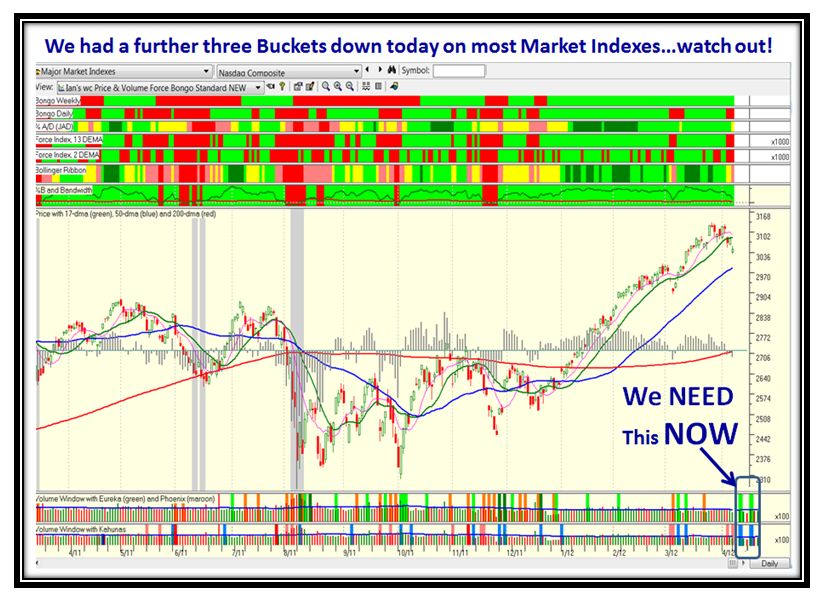
Before you get too complacent, we have now had two Kahunas down on the Nasdaq within three days.  Just cast your beady eyes back to August 2011, then try September and November to decide the odds for and against you hanging on.  The answer is simple…we must see equally strong upside Kahunas right away if we are to counter the inevitable pause to refresh at least and may be even worse.

As the popular saying goes on the HGSI Yahoo bb, “we will know in the fullness of time” and the time is NOW!

Best Regards,

Ian


Copyright © 2007-2010 Ian Woodward
Disclaimer: Commentaries on this Blog are not to be construed as recommendations to buy or sell the market and/or specific securites. The consumer of the information is responsible for their own investment decisions.