Ian Woodward's Investing Blog

Archive for the ‘HGS Principles’ Category

Stock Market: Uncertainity Weighed Heavily on the Market

Monday, July 11th, 2011

With all the recent writing I have done getting the Newsletter out, Carpel Tunnel is back in my right hand so I will keep the typing to a minimum:

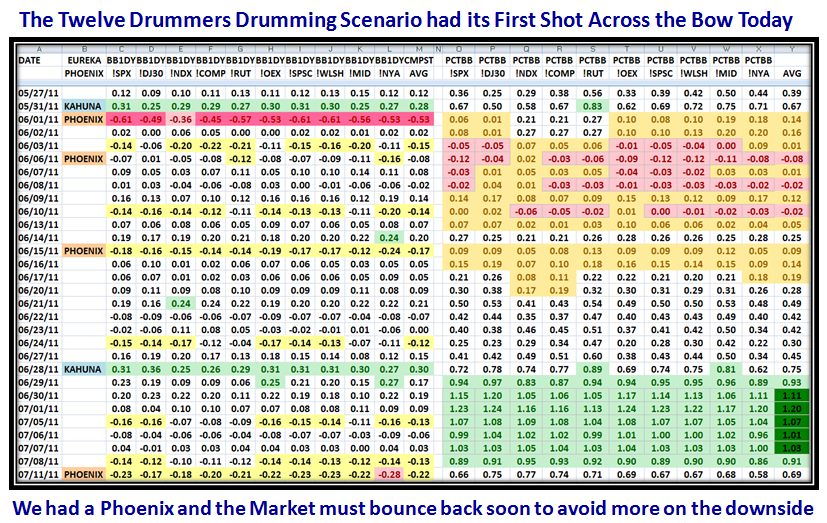
You know the symptoms…once we hit a peak WITHIN twelve days one should see a correction.  How big nobody knows:

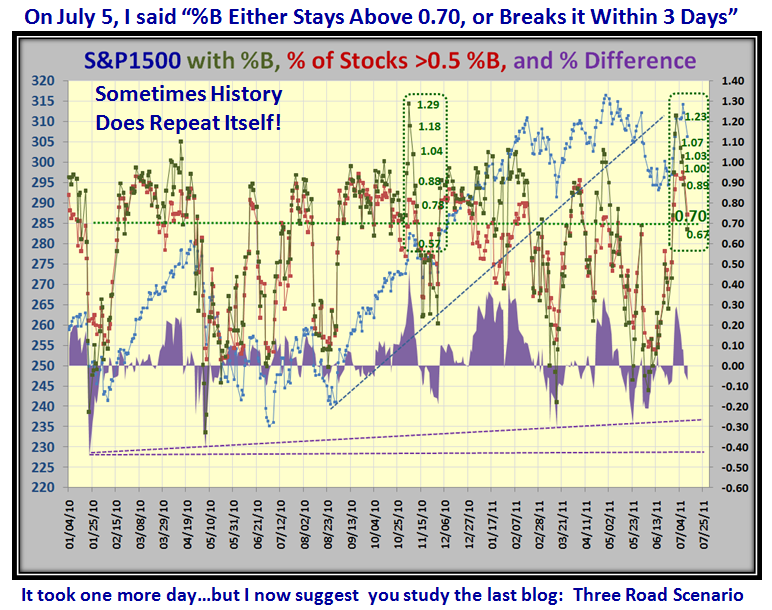
Who says “History Doesn’t Repeat itself?”  Well close enough for Gov’t work:

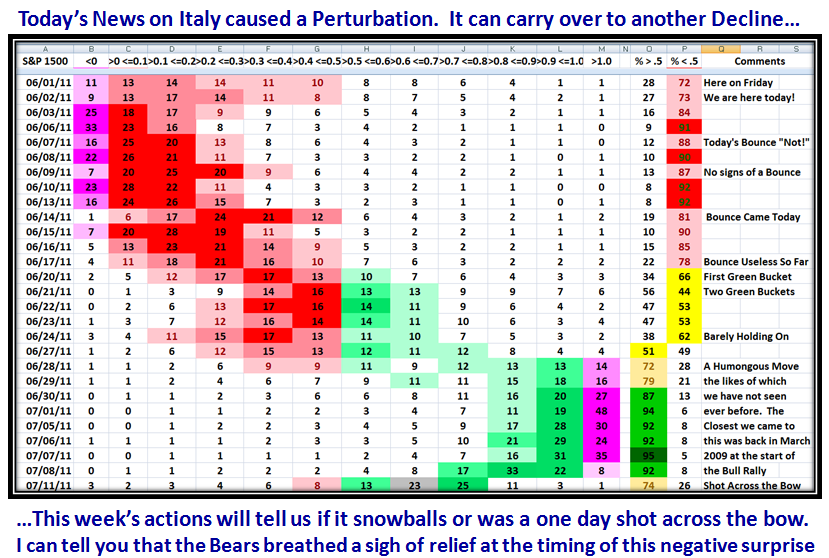
A shot across the bow, but we still have a decent cushion…a bit of luck for the Bears for such a turn of events, who were biting their finger nails:

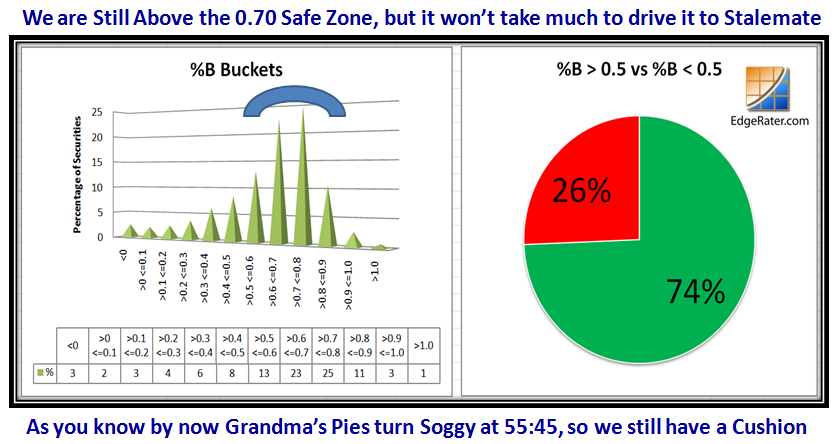
Grandma’s Pies are still in the Safe Zone, but one more day like today can turn them pretty soggy:

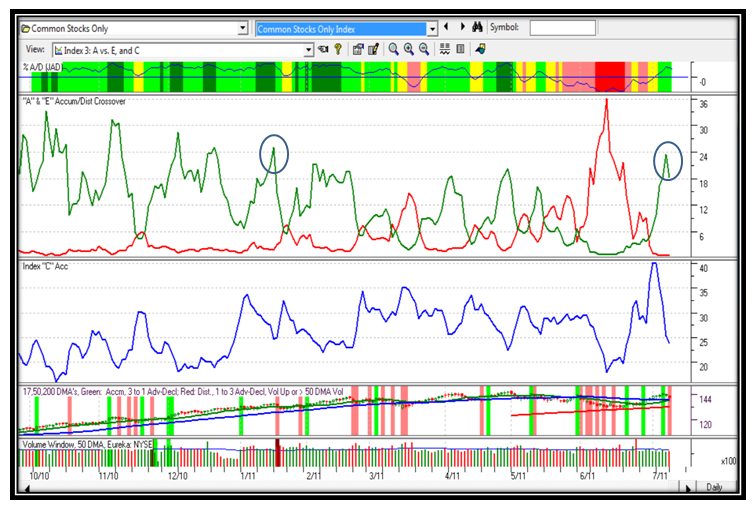
“A” Accumulation has turned back as expected, but not enough to be alarming at this stage:

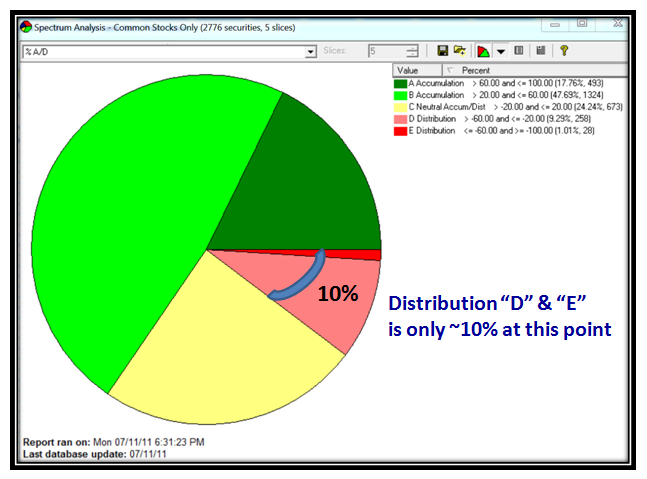
This Pie Chart shows more clearly that Accumulation is still strong with only 10% in “D” and “E”:

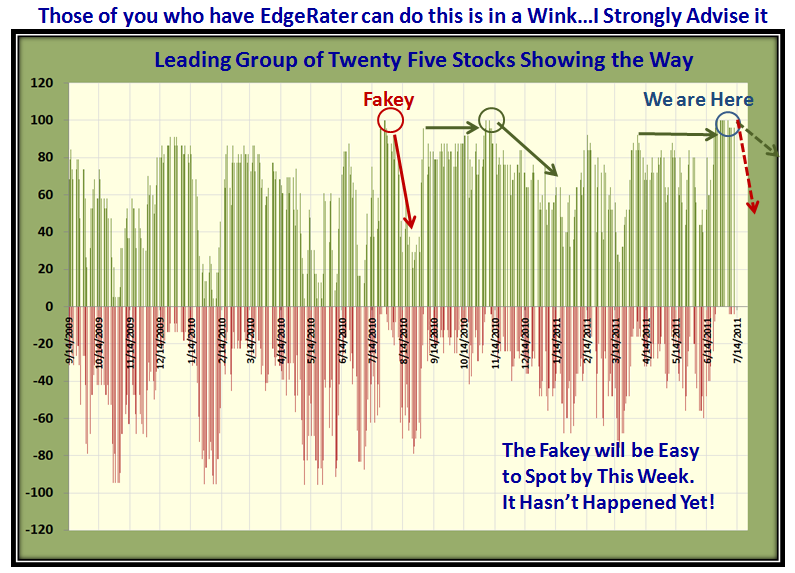
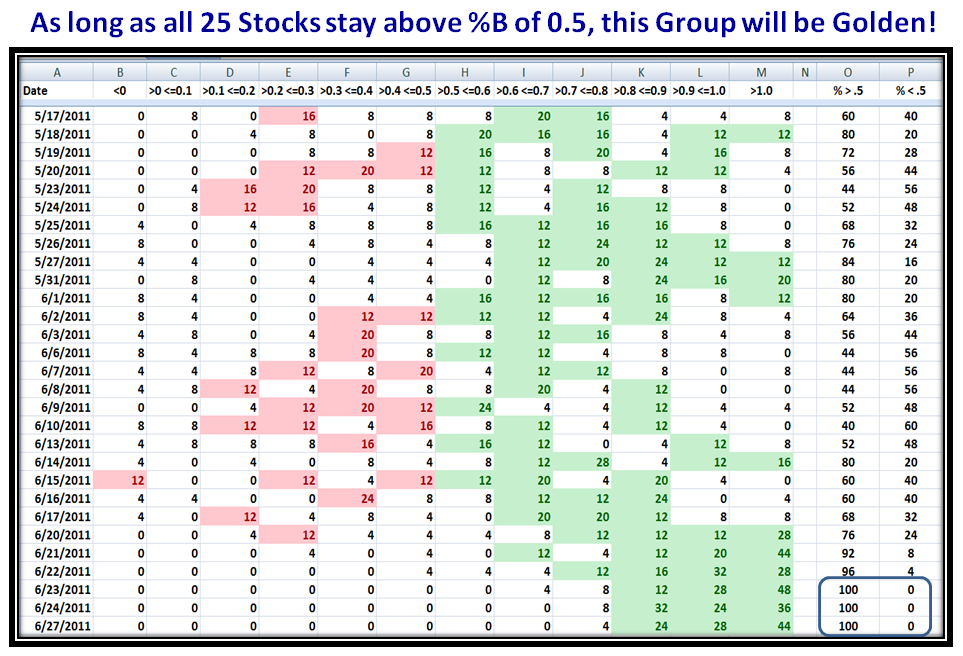
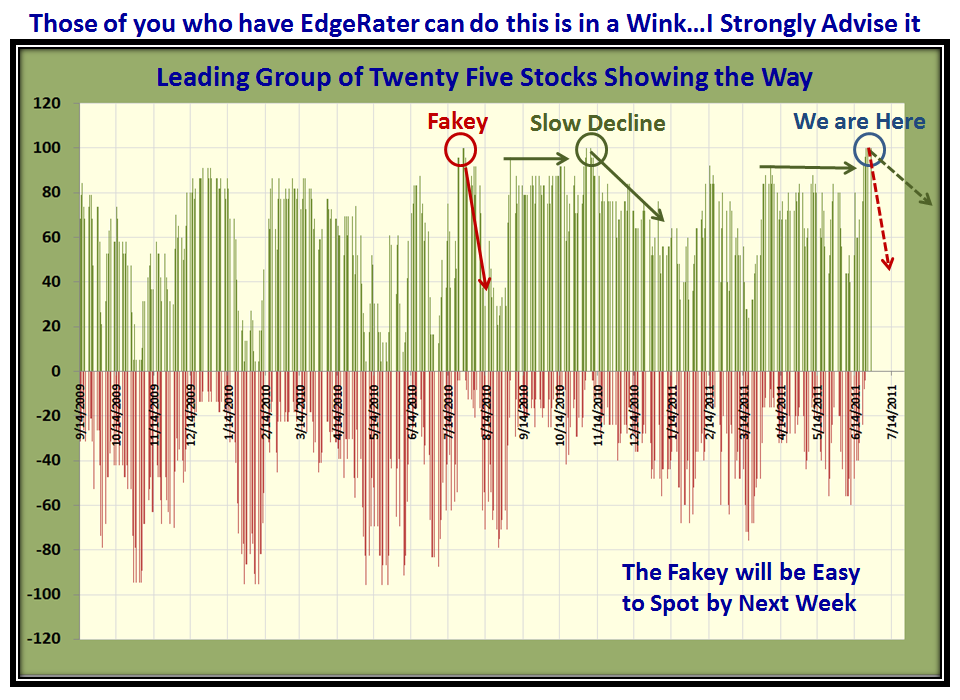
The strong group of 25 stocks I featured a couple of blog notes ago are still holding up, but has slid down a bucket or two though still above 0.5:

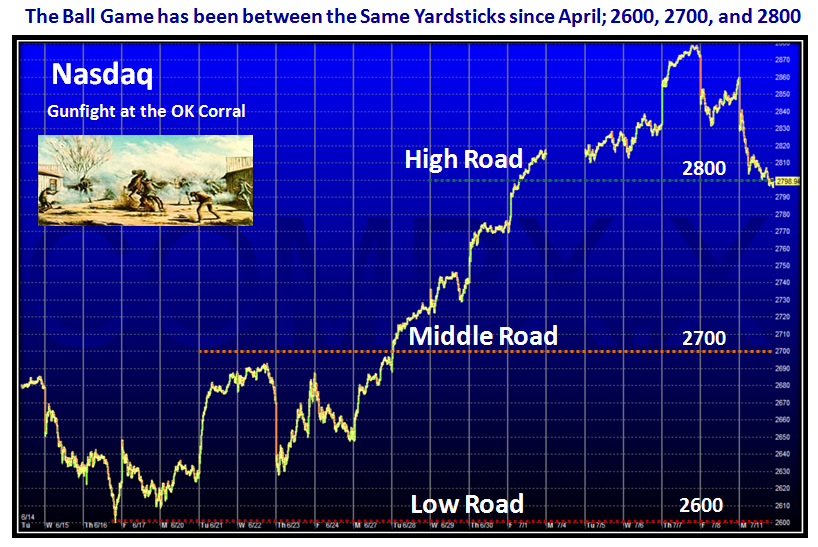
The Ball Game for the overall market hasn’t changed in several months and stays between 2600 and 2900 as I have shown before:

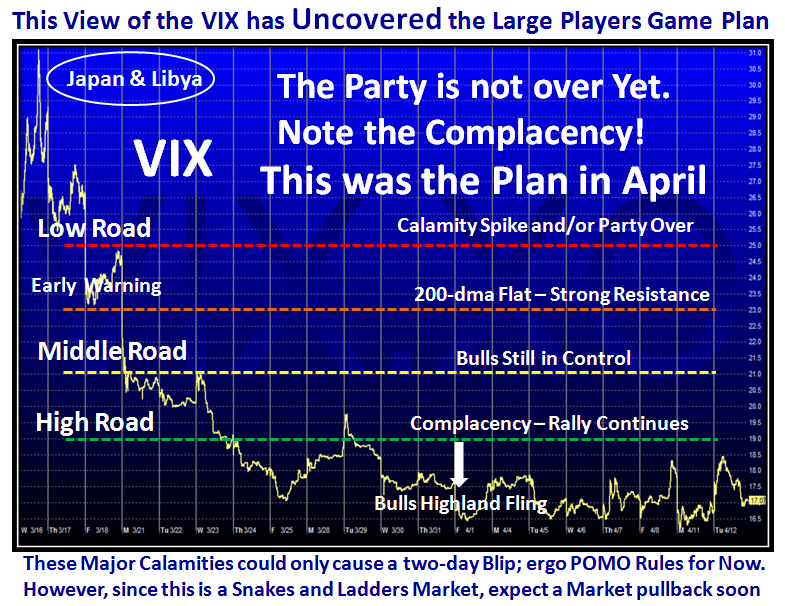
The Bears are now focusing on the VIX and similar instruments…this is good for Type 1 and 2 traders.  I gave you the Game Plan Moons ago:

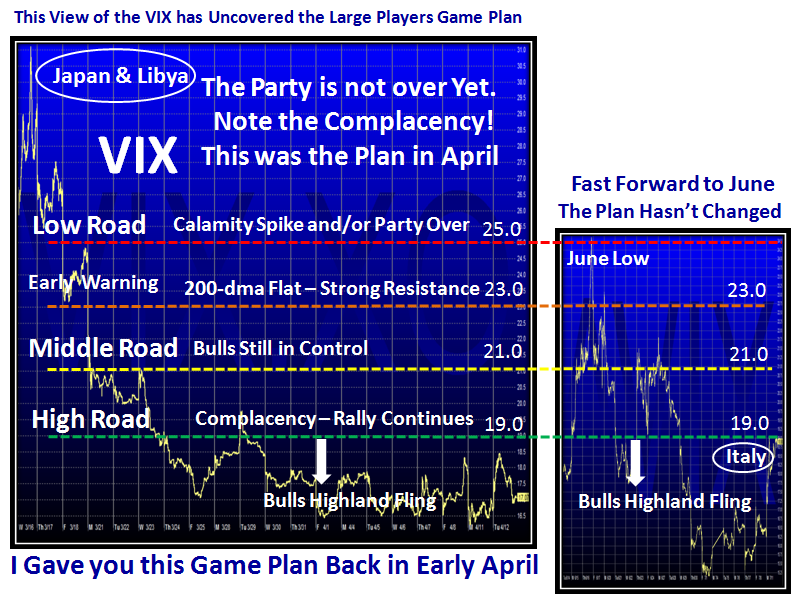
…And here is where we sit today with a fast forward to June:

…And there you have the picture to help you plan for the week ahead.

Best Regards, Ian


Stock market: Three Road Scenarios

Tuesday, July 5th, 2011

At this stage of events, it seems easier to hypothesize the three Main Road Scenarios.  The Stock Market has played into our hands and here is what may unfold in the next week or so.

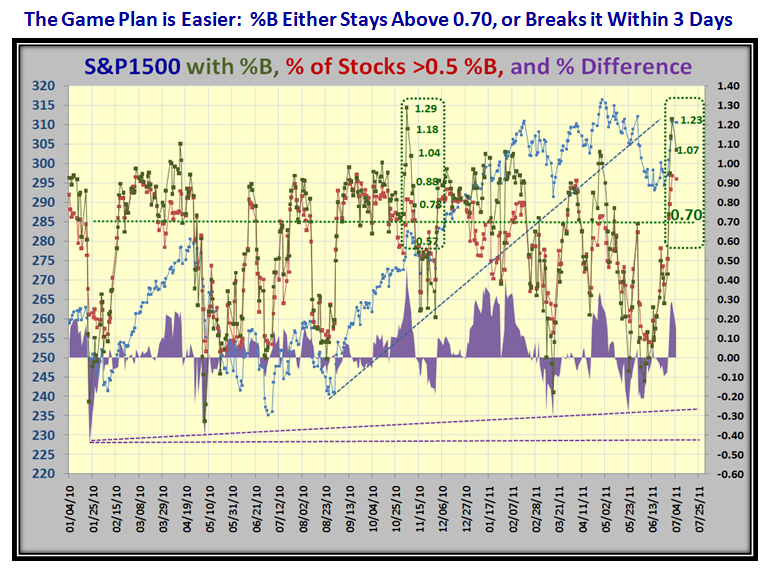
You have seen the chart below when I coined it as the Purple Chart, which helps when a Market is either Overbought or Oversold:

Please compare the current stage with that around mid November last year to identify what “MIGHT HAPPEN”:

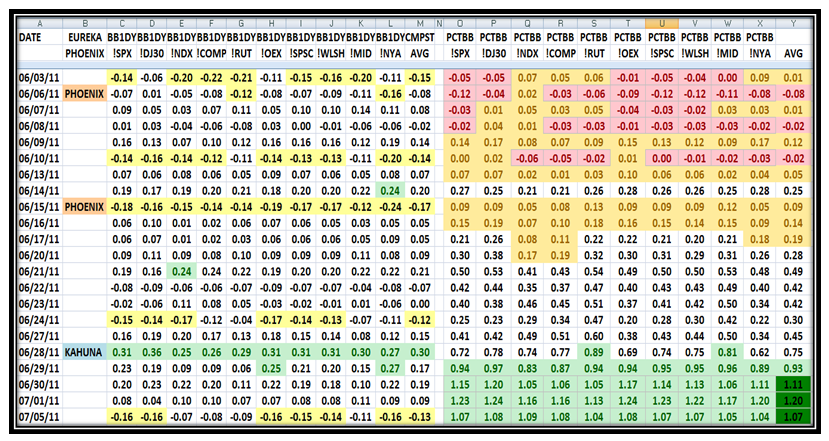
1.  The Middle Road Scenario: The S&P 1500 will fall to below 0.70 for %B within the next week
a.  We should expect at least a Kahuna to the downside…that implies a one-day skip of two buckets down
b.  It also suggests a Price drop of >1.5% in the S&P 1500 or about $4 in one day
c.  %B for the S&P 1500 will drop BELOW the reading of the % of stocks in the S&P 1500 >0.5 %B
d.  Subsequently in the ensuing week %B MUST not fall below 0.25, and then must rebound
e.  The Price of the S&P 1500 will HOLD above its current low of ~ 294 at or near a triple bottom
f.  The Canaries give up their significant recent gains and again will be testing their lows

2.  The Low Road Scenario: Given the Middle Road Scenario to 0.2, %B falls further below the Bandwidth
a.  Invariably this requires at least a 2% Price Drop and one can expect repeated one day Bucket Skips
b.  At this stage, the Bears will have control and the Floodgates can open on full throttle
c.  The S&P 1500 can suffer several 1-Day Price drops of 2% or more
d.  %B (green line) will drop faster than the % of Stocks above 0.5% (red line)
e.  The Purple Area Chart will once again go negative to around -0.2 or lower

3.  The High Road Scenario: Given the Middle Road Scenario to 0.2
a.  %B RISES and recoups to 0.9 or higher
b.  The S&P 1500 quickly rebounds and attempts a double top, either blowing through or being rebuffed
c.   We review the bidding at that stage, but it will certainly require good news on the Debt Ceiling Fru-frau
d.  There is no further unrest or negative surprises on the PIIGS front
e.  Volume picks up to give conviction that the Bulls are ready to flex their muscles

Always let the Market tell you which Scenario it is on.  At least we now have a cushion from the Strong Bounce Play of last week to give breathing room to the downside.

Best Regards, Ian.


Stock Market: A Fork in the Road at the Crossroads

Sunday, July 3rd, 2011

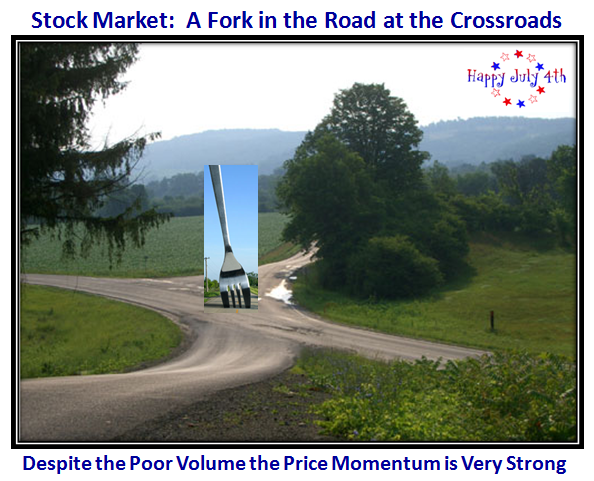
A Happy 4th of July to you all as we ponder where this market goes next week.  Those who have followed my blog these last few weeks got the Game Plan alternatives over a week ago with the last two blog notes.  So now we come to the Fork in the Road at the Crossroads:

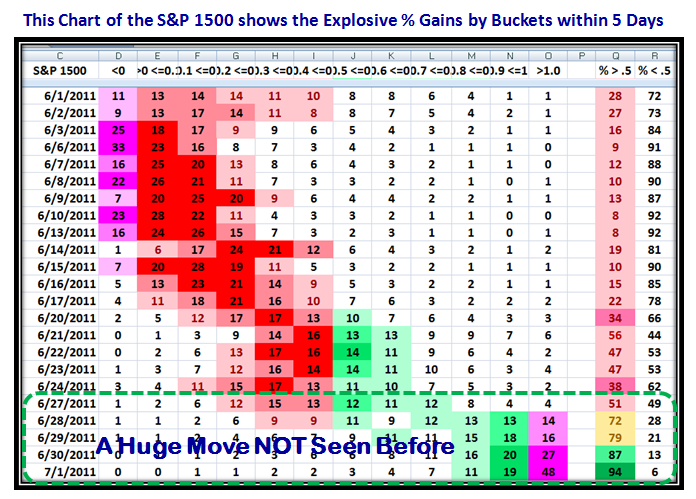
This past week was a Blockbuster in terms of Price Gain from an Oversold situation, the likes of which broke all records in its momentum.

The $64 Question is whether this is the start of a decent Summer Rally or just a Flash in the Pan due to a confluence of three forces that came together  simultaneously to cause the explosive move this past week: Window Dressing, the End of the Quarter and Half Year, and a Market that was so Oversold that at least a Bounce Play seemed certain to be on the cards, especially as two previous attempts fizzled before they hardly started.

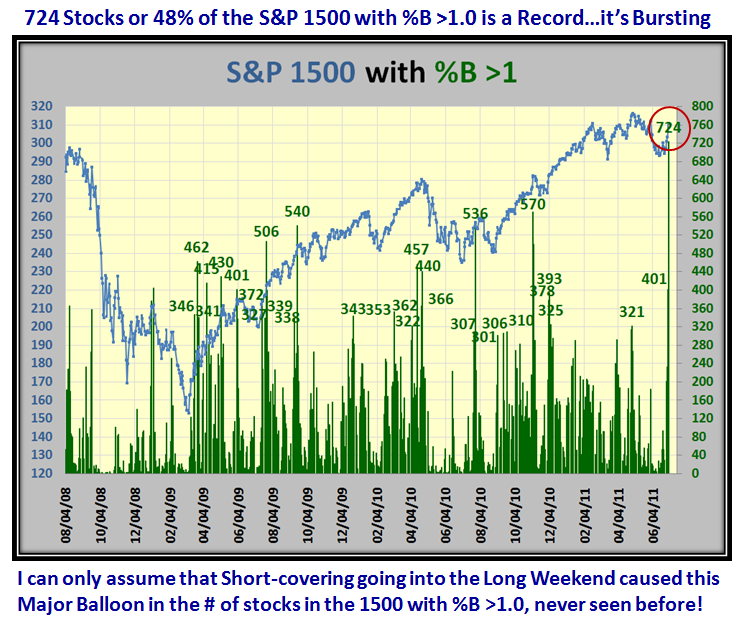
Just look at the results of the Buckets and especially the 48% of S&P 1500 stocks sitting above the Upper Bollinger Band in Bucket >1.0

That 48% or 724 stocks is the highest on record, so this again was no ordinary move:

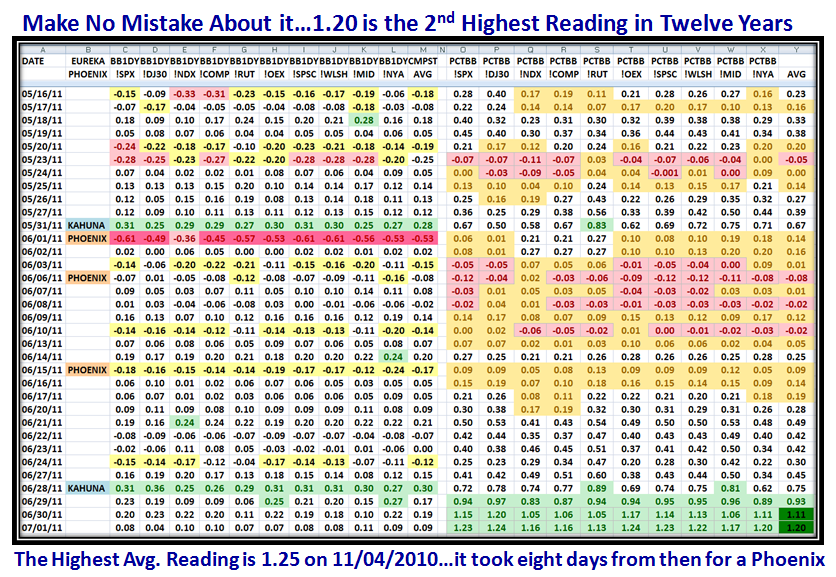
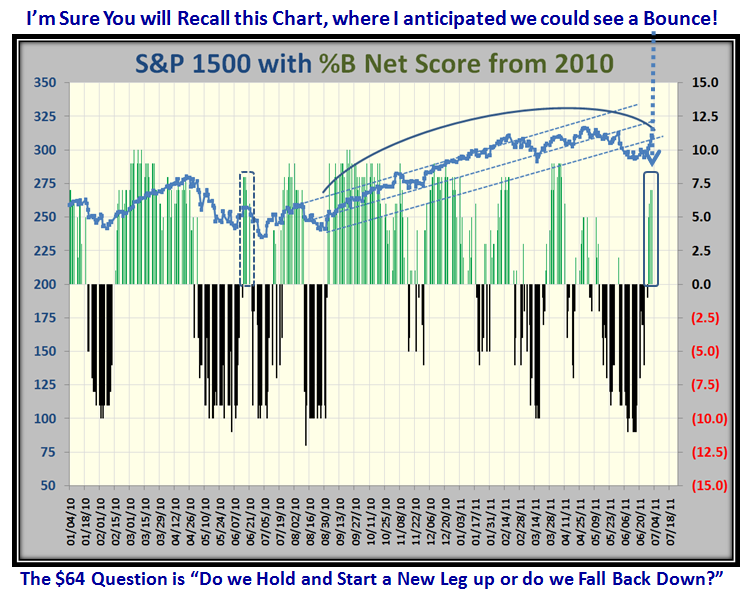
…And if that is not enough, here is the result of that Bounce Play which has materialized as I hypothesized last week:

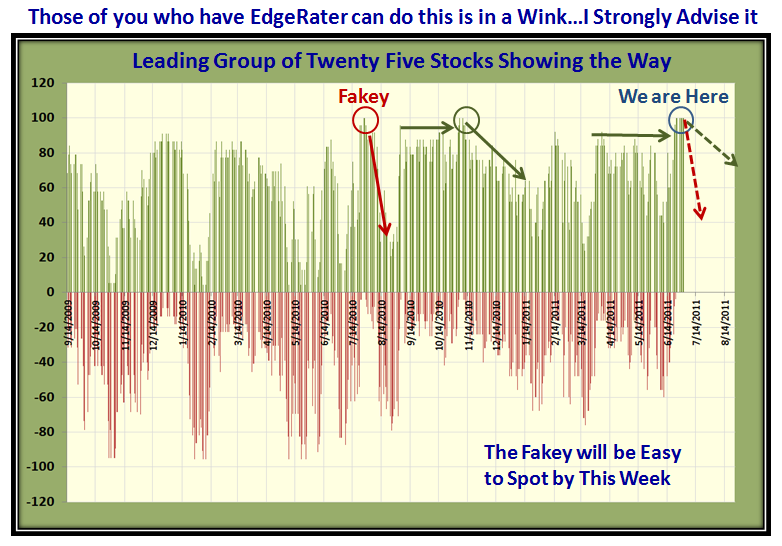
Here is an update to the picture I gave you last week showing two alternative Scenarios for this coming week…The Fakey will be easy to spot:

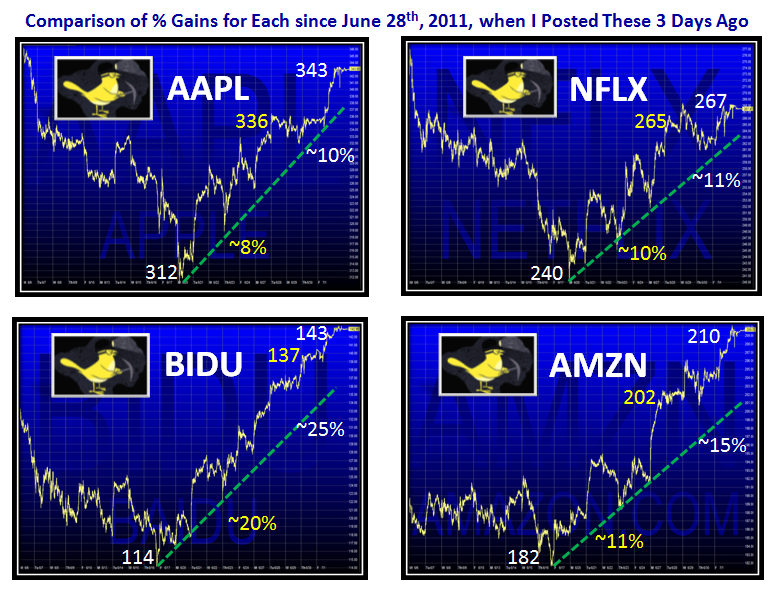
…And here is how the Canaries performed this past three days since the previous one with the improvements in % Price Gain (shown in white):

So there you have it, and again a Happy July 4th to you and yours.

Best Regards, Ian.


Stock Market: it Pays to Watch the Canaries!

Tuesday, June 28th, 2011

The Canaries I gave you last Weekend are Flying High and although the Volume is sub par, who cares when they are going like gangbusters if you are short term oriented and want to make a quick buck.

…And here is their recent performance in the last seven to nine days:

There is always a “Market of Stocks”, but the time to keep an eye out is when the Market is badly oversold.  I gave you the ponies to watch and their performance is covered in the next several slides:

…And here, hot off the press are the results for the last two days:

One of the Two Tiddlers I gave you is flying high.  They are all sitting with %B above 0.7, so these stocks have been on fire for the past five days:

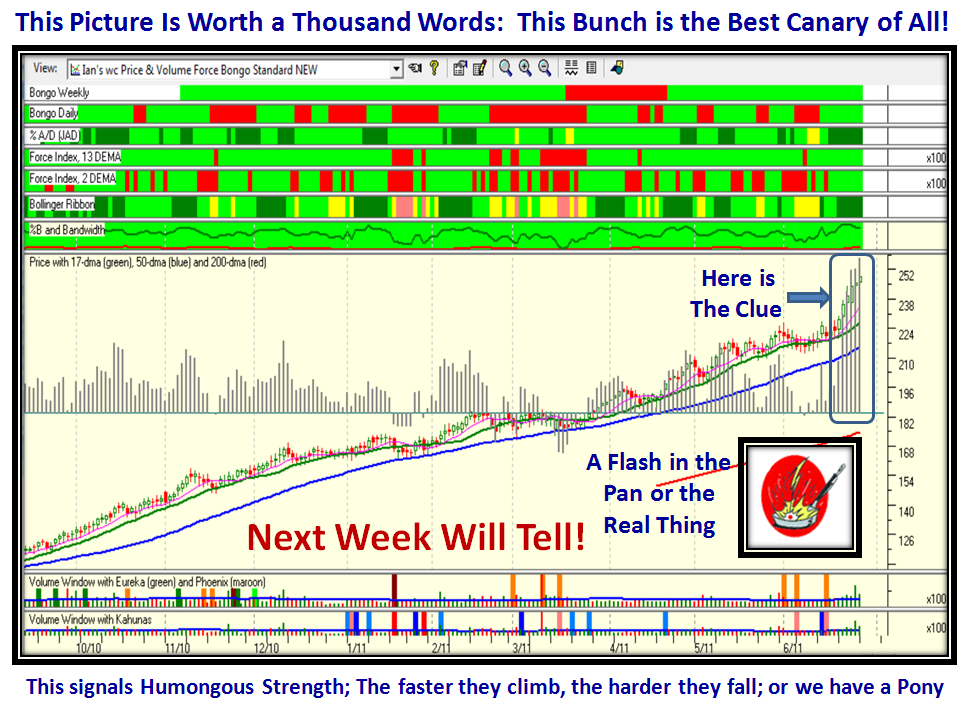
The Group Index for these 25 Stocks is very strong as shown by the Chart Below:

It will not be difficult to establish that this group and the move so far was just a Flash in the Pan or the Real Thing…you wo’nt have long to wait:

I can’t leave you without a view of Grandma’s Pies which are tasty and delicious so far:

So far, so good…at least the Bulls have some breathing room.  Unfortuntely this market is so news driven that we can suffer a surprise downward spike at any time…and the PIIGS seem to be the place to keep a beady eye on:

Stay light on your feet; you roll the dices and take your chances!

Best Regards, Ian.


When the Bough Breaks the Canaries Will Fall!

Saturday, June 25th, 2011

June has invariably been a volatile Month over the past six years, but the week going into the July 4th Holiday should give us a “Kicker” to the upside.

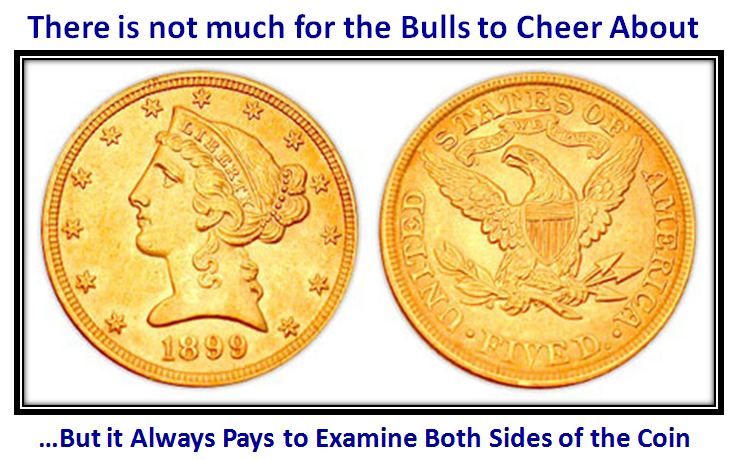
At times like these where the Market is Oversold but has failed twice in recent weeks to achieve any reasonable Bounce Play, it pays to evaluate both sides of the coin.
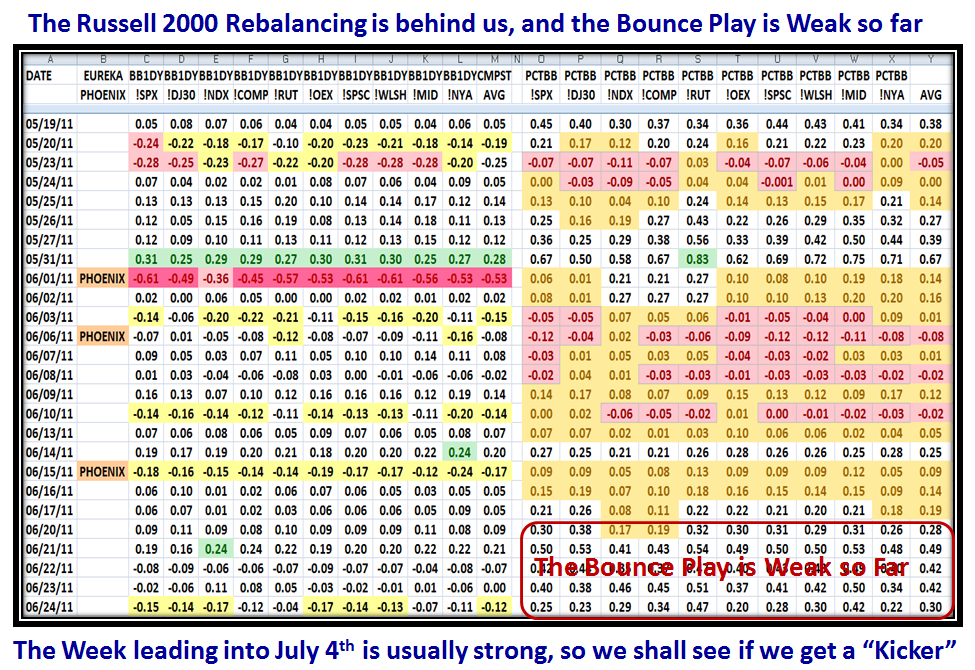
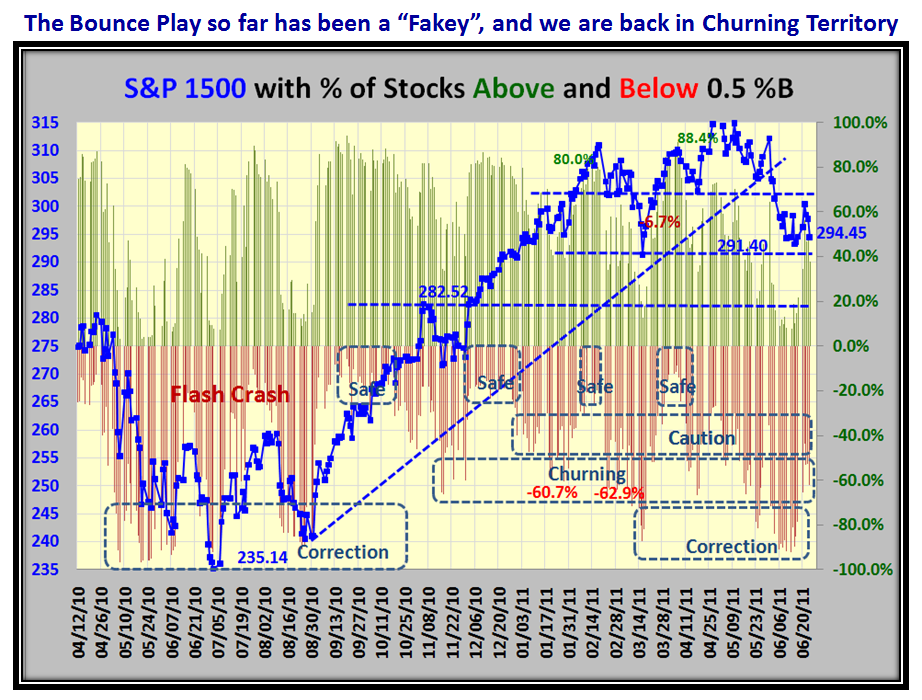
Maybe it is the time of the season when Graduations, Weddings and Vacations are affecting the results as usual, but the Bounce Plays these past ten days have been putrid to say the least and given that, the natural bias is that the Market is headed down further.  However, as I constantly remind you it is a quirk of History that 70% to 77% of the time for the Nasdaq and S&P 500, respectively, the Markets turn back UP from this level.  We are now at that crucial point, so we shall see if the floodgates open and we head down or we hold here and at least have a decent bounce play going into July 4th:
…And for those who prefer to see the various levels of Correction, here is that view.  it is not surprising we are “Churning”:
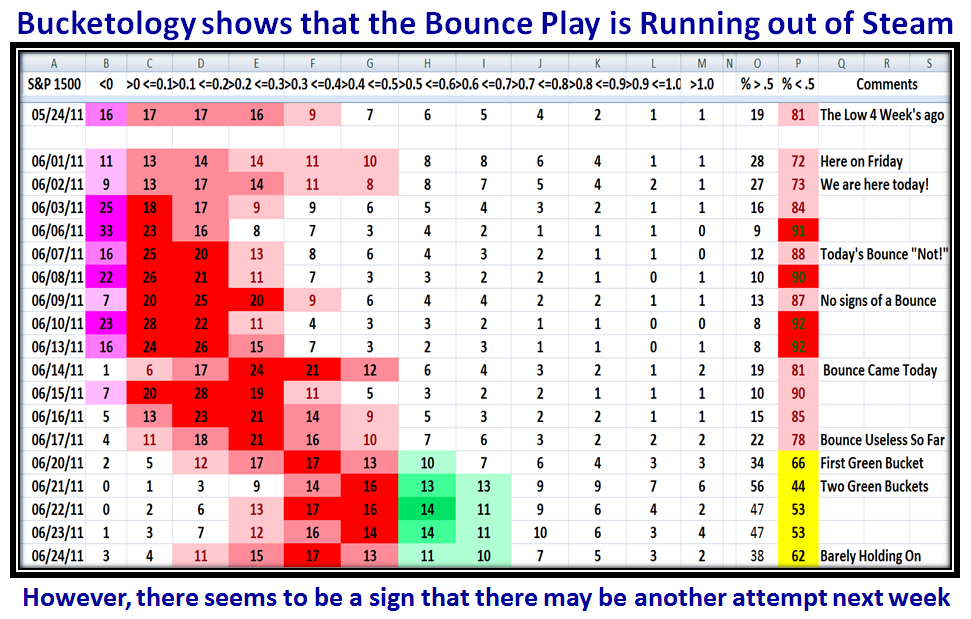
For those who avidly follow the Bucketology, the picture is no better and on Friday we headed down one more time:
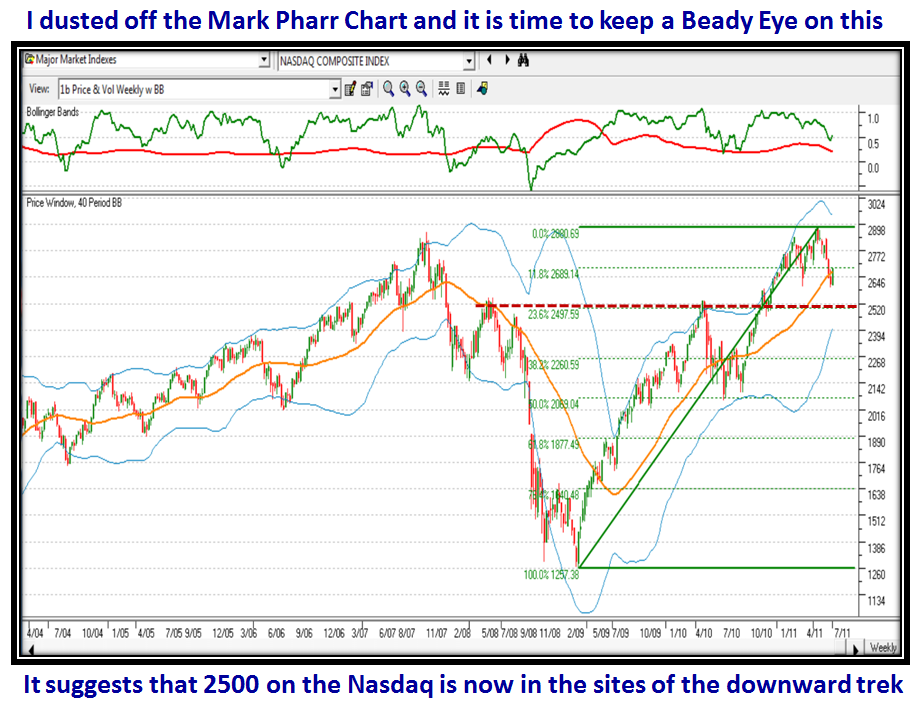
Given where we are at this stage of events, I dusted off what I affectionately call the “Mark Pharr Chart” named after one of our faithful followers who was interested in the long term buy and hold picture, which I conjured up for him several moons ago:
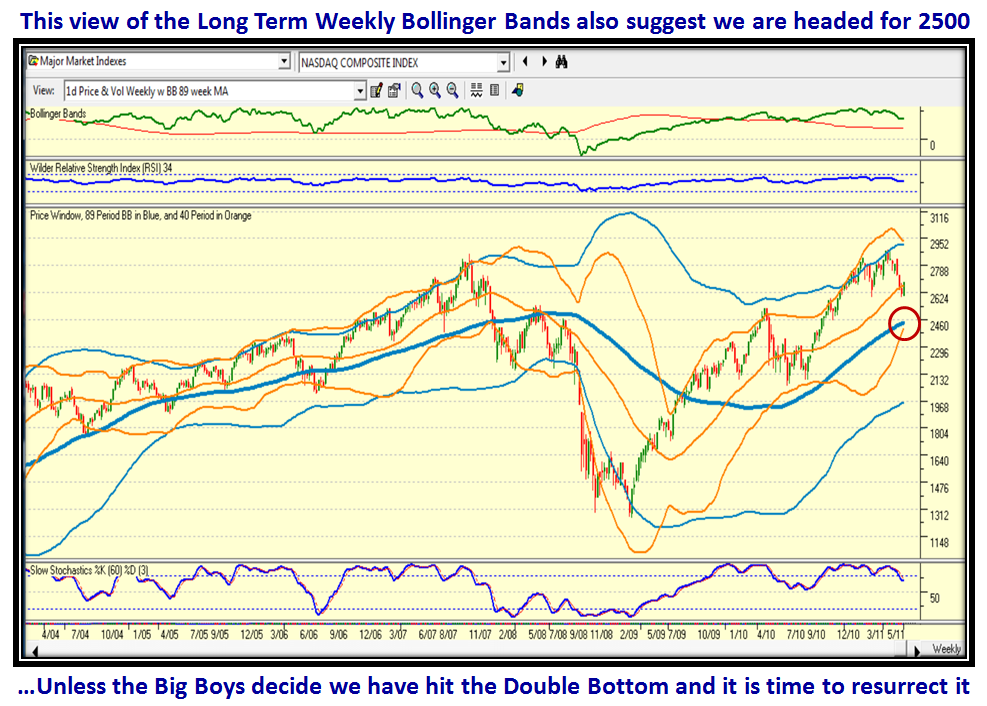
For good measure, here is another one I conjured up a while back on the same theme using Bollinger Bands of 89 and 40 Periods with Weekly Charts:
History never repeats itself exactly the same way, but let me compare this year to the Flash Crash of last year, not that I am expecting a Flash Crash, but the similarity was striking and this time last year we had a “Fakey Relief Bounce Play” in the last week of June as shown in the next chart:
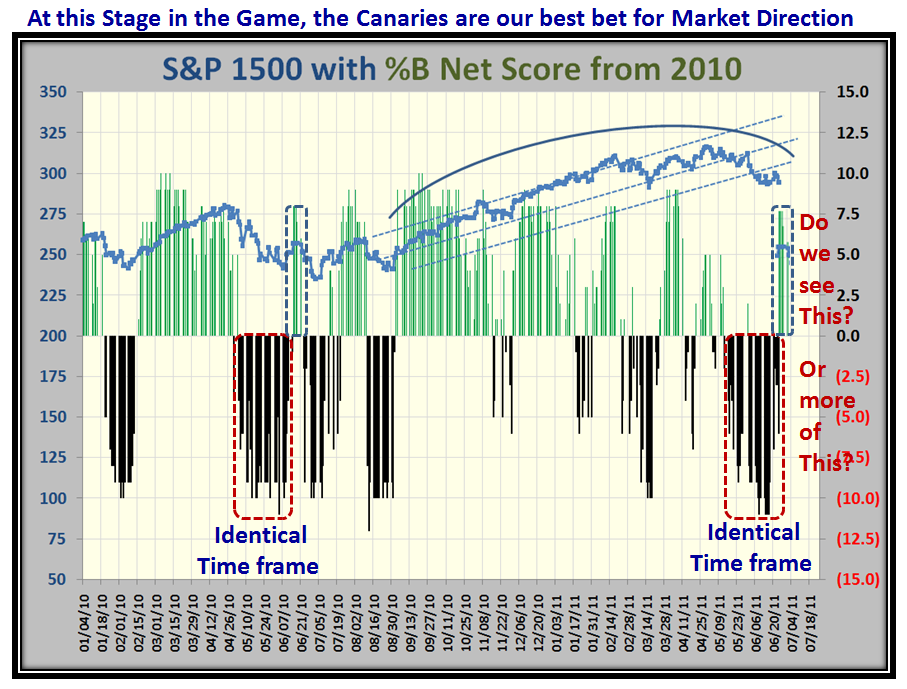
Now let’s turn to where the glimmers of hope may be to give the Bulls some breathing room in the week to come…always keep an eye on the Canaries:
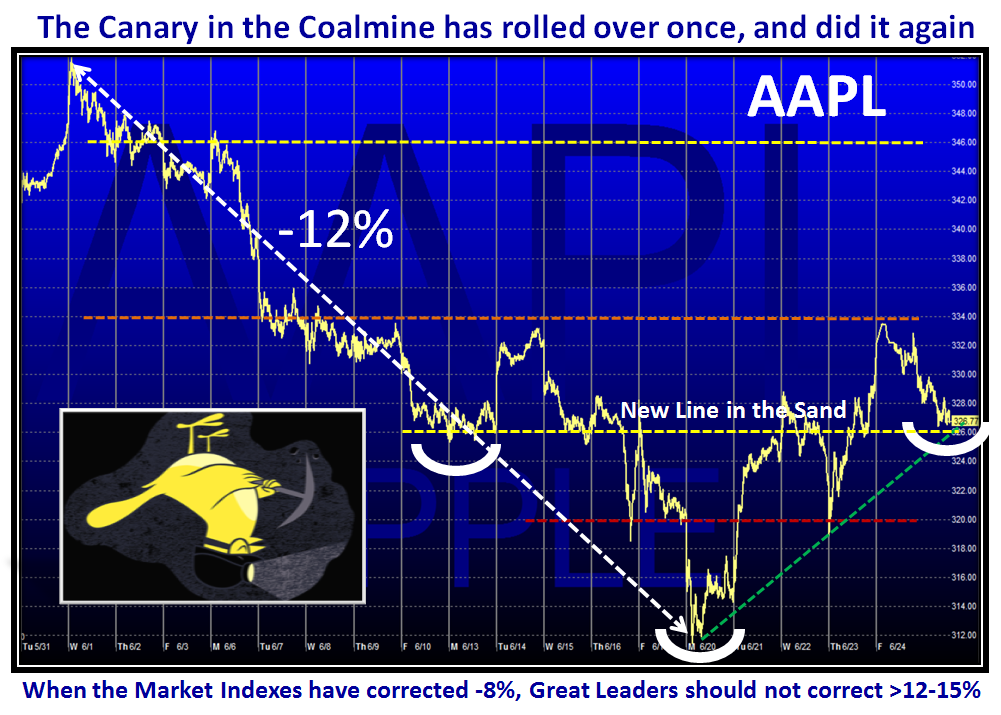
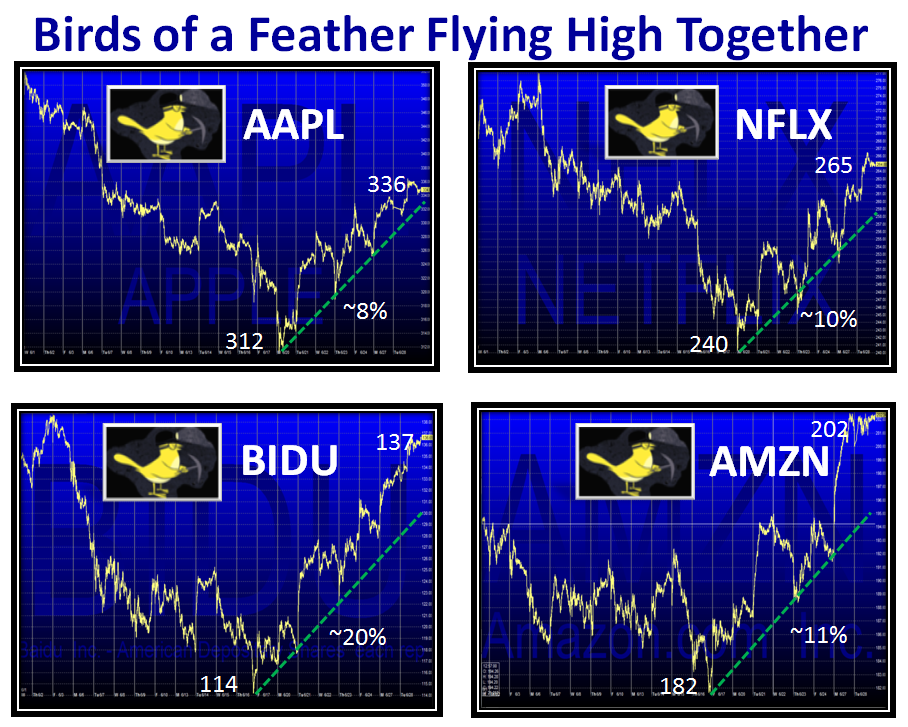
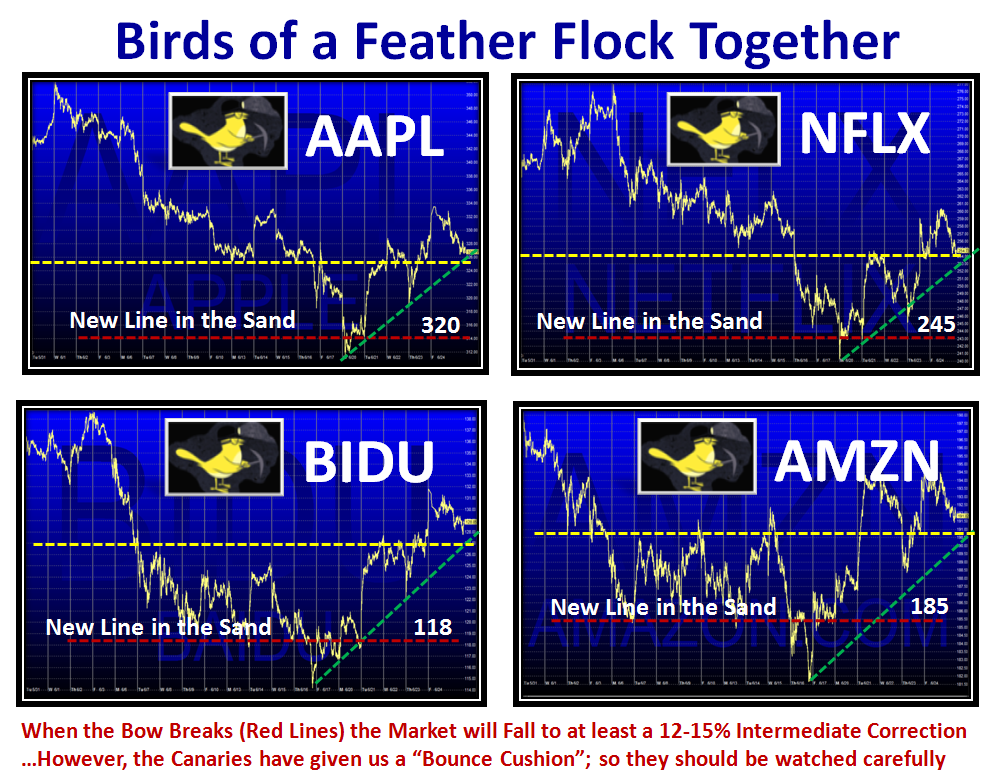
What struck me was the similarity of the Bounce Pattern that each of these four Large Cap leaders produced this past week or so…judge for yourself:
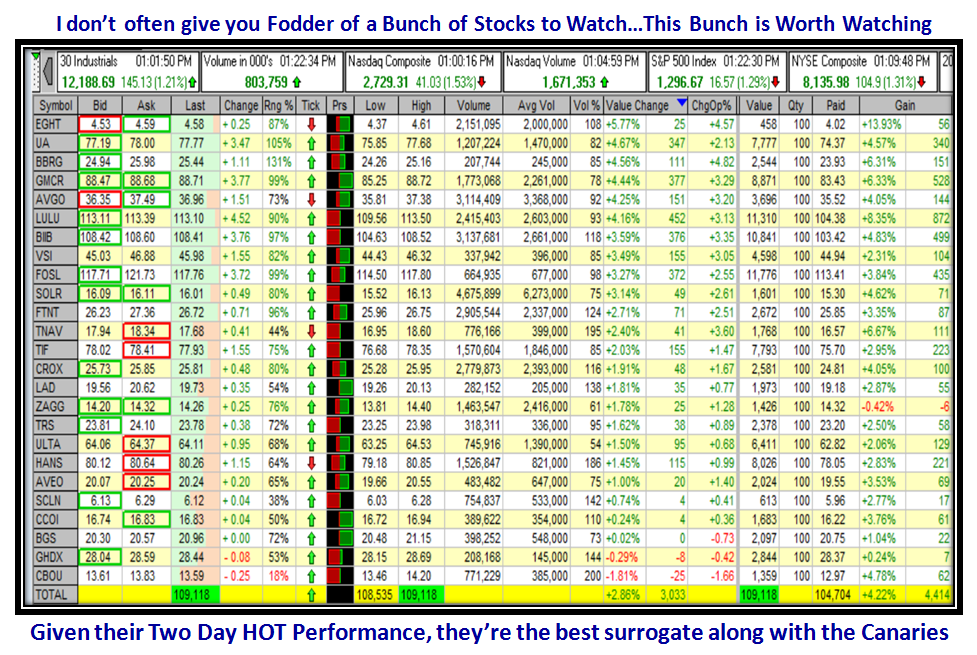
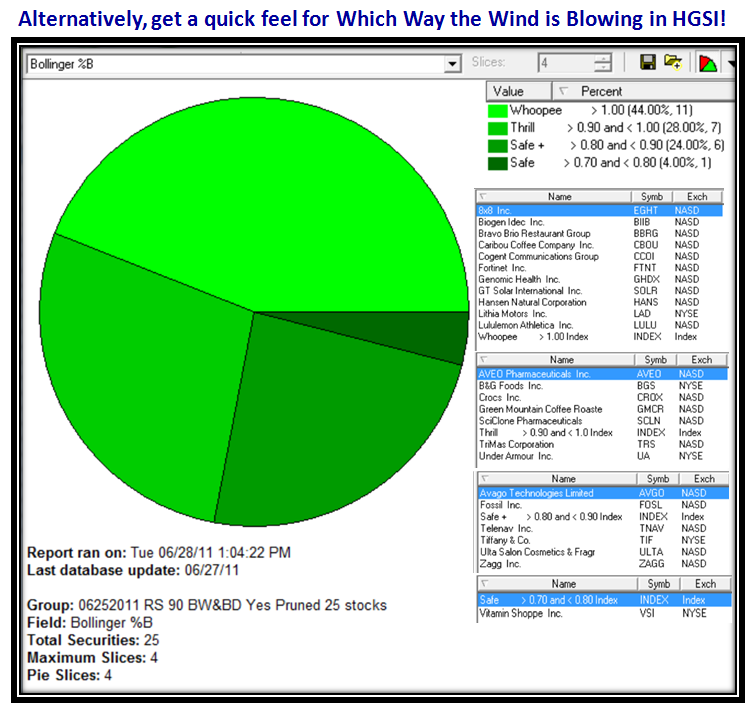
Fast on its heels, my good friend Robert Minkowsky reminded us that there was an unusual bounce in ERG 255 and ERG 270 stocks this week, so I felt it was high time to do my homework and offer you a set of 25 stocks that have shown signs of life this past few weeks that look promising leaders:
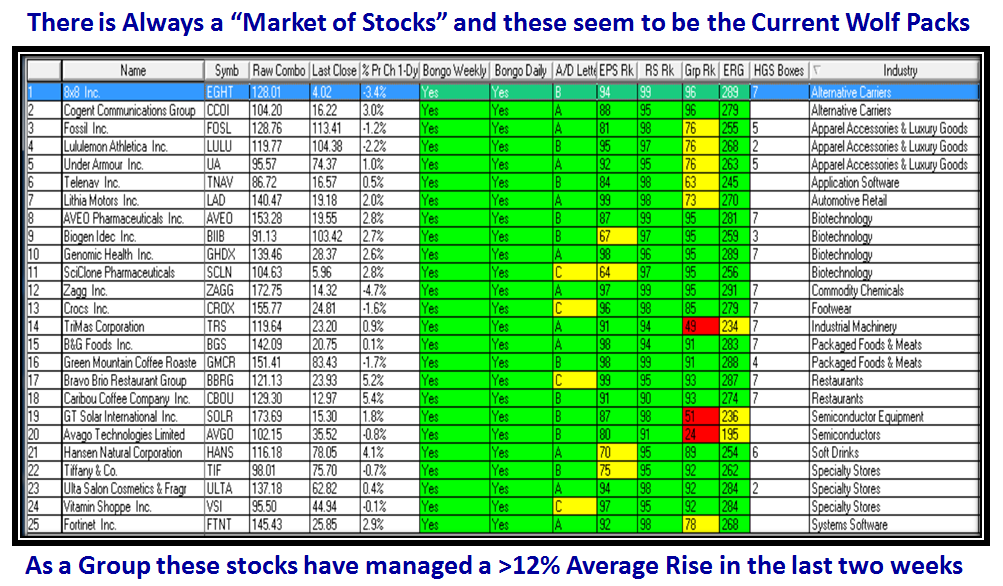
There are a couple of tiddlers in the bunch, but I am not recommending any of these stocks, so you do your own homework.  Obviously seasoned HGSI Software users will immediately take note of the sea of green with both Bongo Weekly and Daily Green along with an RS of over 90, strong ERG and plenty of Box stocks to boot.  Also some wolf packs emerge as seen on the right hand side of the chart.  Here are the results for each stock for the past three weeks:
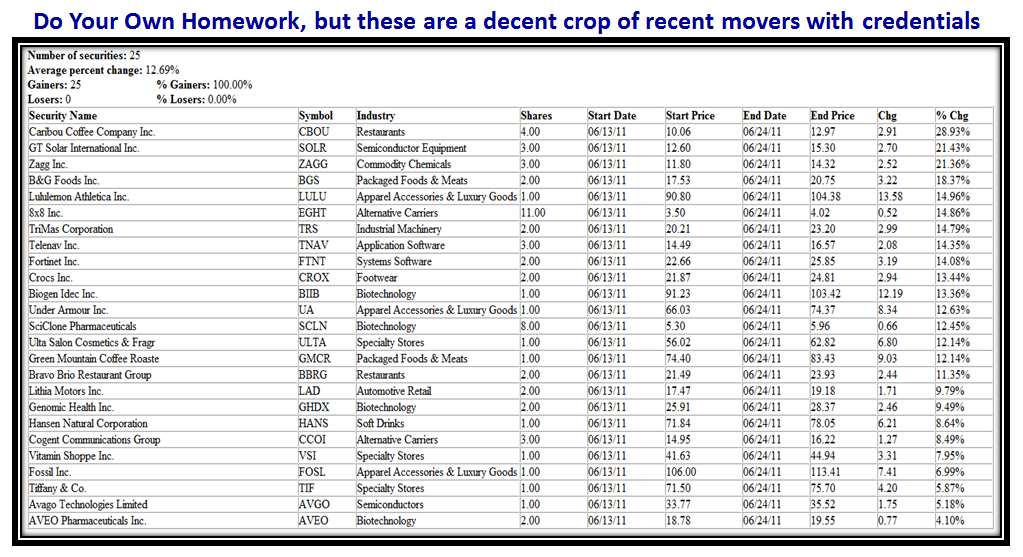
Now you have a Game Plan to go either way depending on what the MARKET Indexes, the Canaries and the Leading stocks tell you next week.  If the market continues down then watch to see if the “Bow Breaks” and the Canaries fall, but if it revives itself going into the July 4th Weekend don’t be surprised if it is just a short term Bounce Play for another Fakey the way it happened this time last year as I showed you above.

Best Regards.  Ian.


Copyright © 2007-2010 Ian Woodward
Disclaimer: Commentaries on this Blog are not to be construed as recommendations to buy or sell the market and/or specific securites. The consumer of the information is responsible for their own investment decisions.