Ian Woodward's Investing Blog

Archive for the ‘HGS Principles’ Category

Stock Market: Santa’s on his Way…And Then What?

Sunday, December 19th, 2010

Time goes by so fast when you are having fun, and another year has rolled around and it is time to dust off my favorite video and wish you all a Merry Christmas and a Happy New Year from the HGSI Team:   

As most of you know, my life revolves around threes:  This time not only is the Market under the Weather; California is likewise with rain pouring down as we speak; and sad to say that my Wife, Pat, is also under the weather having caught a mild dose of flu from me which I had earlier in the week. 

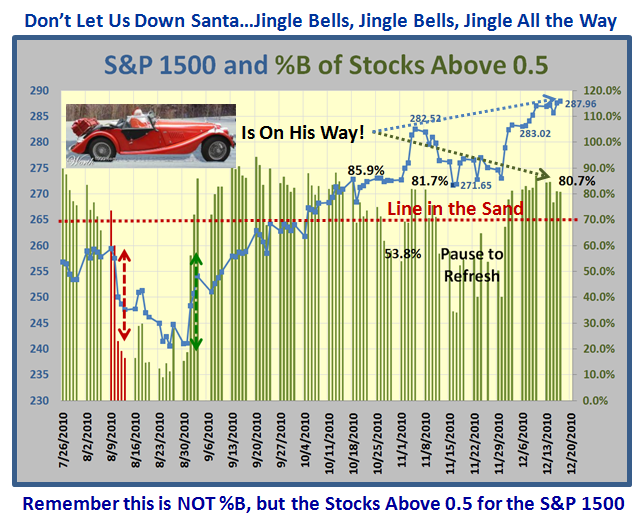
But what of Santa?…Glad to say he is still on his way:

It seems the Moose Droppings are in his way as those pundits who avidly follow the Hindenburg Omen (HO) mumbo jumbo will tell you we had two signals this past week PROVIDED you use Wall Street Journal Data.  Skeptics will warn you that the last warning in mid and late August fizzled into a “nothing”.  The avid followers will come back with the fact that the VIX showing complacency is also a good sign and this time we may have the real thing…just watch for the next 4 months!  The only real point to remember is that one can have these signals and 75% of the time they fizzle into a minor correction, but a Major Bear Market Correction has never happened without being preceded by a Hindenburg Omen.  It’s all part of the folklore, depending on how you want to present it. 

Meanwhile, we have our own bag of tricks to keep us on the right side of the market, and given that we have now had 16 weeks of a rally with only a couple of weeks Pause to Refresh, it will be no surprise to anyone if we have a correction in the New Year with the market so long in the tooth:

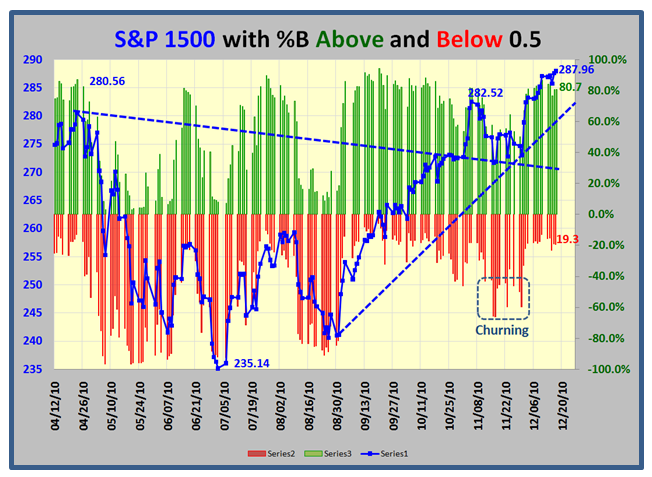
…And let me give you its twin picture for those who like to see both the red and green bars to get the full picture.  We are a long way from the churning area, but that is what to look for FIRST, if and when this market decides to correct:


I make no apology for the pun since I feel part of my job is to drum home the key messages of my findings…I tell you 12 Drummers Drumming is working:


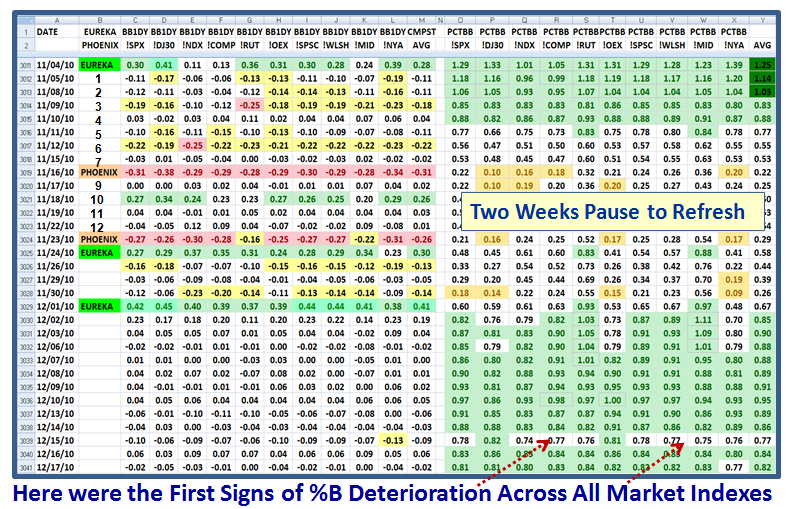
Just judge for yourself – we started the last correction WITHIN the last twelve days from the obvious warning sign of the 570 stocks for the S&P 1500 with %B >1.0 as shown before in a previous blog note.  It hit on the eight and the 13th day with two Phoenix signals to take the market down as shown:

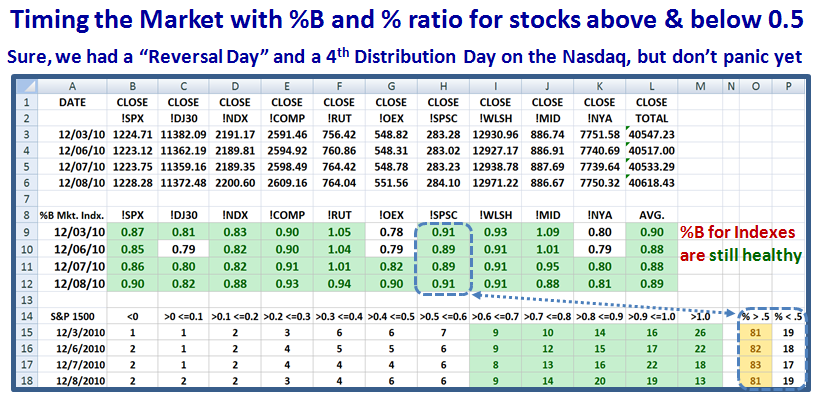
    On December 15th, we saw the first signs of the market deteoriating, but it has snapped back, so the only conclusion at this time is to confirm that Santa is on his way next week unless we have a Flash-Crash-like correction.  Understand that this picture shows the %B itself for each of ten Indexes on the right hand side with the Average in the last column.  0.82 is still healthy, but for a decent Santa Claus Rally we want to see this number rise to above 0.95 to show real strength compared to the high on 12/09/10, or else we remain skeptical. 

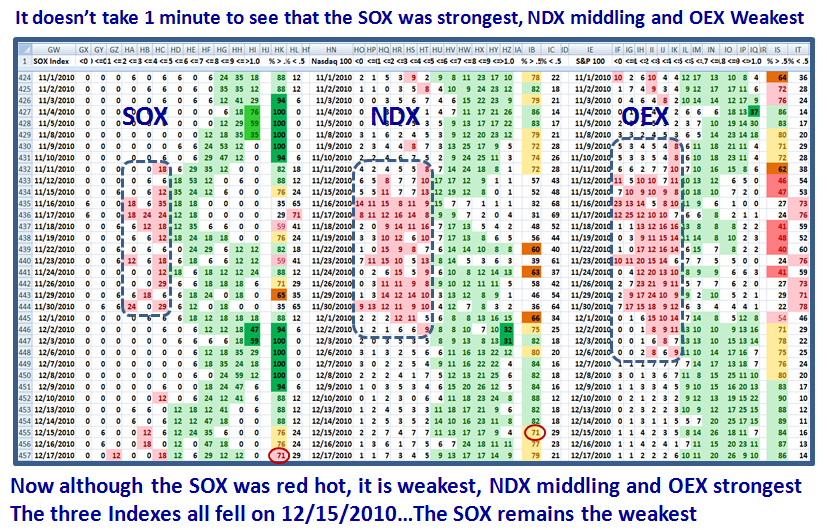
Why Skeptical…because we have observed a “biforcated Market” with all this HO stuff of simultaneous numbers above 79 for New Highs and New Lows.  Let’s face it the Semiconductor Index (SOX) got a trifle overheated, and it didn’t take long to see that some of the true leaders we follow in the NDX were also struck down, but would you believe that there has been a strengthening in the OEX!  Net-net, this market is sloshing around:

Of course I have taught you moons ago to watch the action of the Fed and you should know by now that Uncle Ben is distributing his POMO to the tune of 6 to 9 Billion dollars a day…yes a day for the next couple of weeks.  You also know that this is a two edged sword that one of these days will bite us good and hard, so there is major skittishness as we approach the year-end. 

Let me leave you with one more chart that is a Major Shot across the Bow of a warning sign that my group of friends and I have spotted between us.  As you well know, we keep a beady eye on knowing your ABCDE’s and at times like these, especially our E’s.  Well, we have spotted that the %E’s are rising in concert with the Nasdaq.  Big deal, more fly specking you say!  Well, the last time this happpened was in 2007 on two occasions, in July when Uncle Ben waved leaflets around and again at the top in October.  It’s trotting up as shown:

Look over to the left when this happened in 2007 and as circled on the right for now.  Bottom line, all things are showing a caution flag as the market is long in the tooth.

Best Regards, Ian.

Q&A on “Under the Weather”

Thursday, December 9th, 2010

I felt this note from Akiva was worth sharing with you as he figured out any possible confusion in the numbers for himself.  The first two notes are from him and the last one with the diagram is from me, which confirms his findings.  We are here to learn from each other:

Hi Ian,

Happy Christmas and a happy New Year to you and your family.

Thanks again for your continuous guidance and assistance.

 Trying to follow your calculation on the first chart:

 For the !SPC on the 12/08/10 it shows : 0.91    However from the lower chart: 81/ (81+19=100) = 0.81 As such the 0.91 should be 0.81?

 Am I doing something wrong in my calculation?   Thank you for your clarification.

Akiva

Hi Ian

Disregard please my previous message.

 The confusion came that when speaking about %B for the S&P 1500: one is related to the Index itself position (Bollinger Bands % change) and the other is related to the HGSI calculation of “buckets” (> 0.5%)

 Your “yardsticks” I assume relate all the time to the HGSI calculation only ( Disregarding what !SPSC index shows).  I assume they are related somehow.

Thank you again.

Akiva

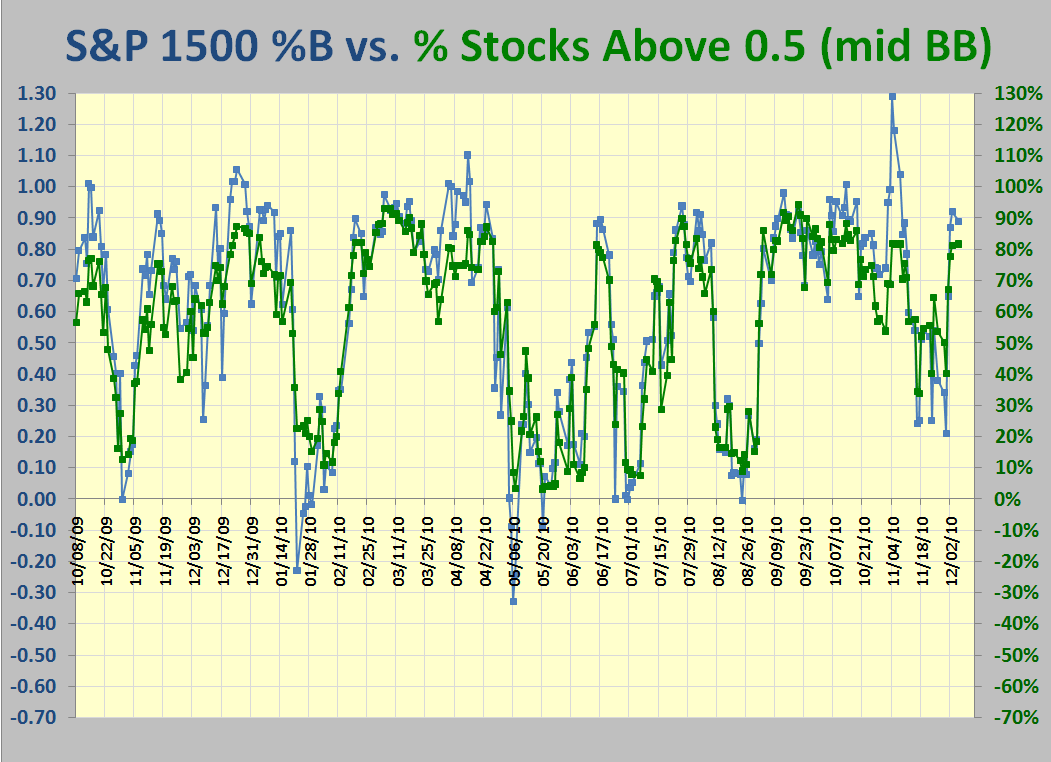
Ahhh Akiva!  You figured it out for yourself…that is the best way to learn.  As you have worked it out they are two separate factors.  Invariably %B itself is a higher number at the peaks and valleys (above 1.0 and <0), since the other formula for % of STOCKS above or below 0.5 can ONLY go between 0% and 100%.  Therefore one can watch for spikes at either end of the scale to establish when we are very overbought!  See the chart below.  You will also note that the “Natural” break in the chart is around 0.65…where have you heard that song before?  Grandma’s Pies.  Best Regards, Ian.

The Stock Market is Under the Weather

Wednesday, December 8th, 2010

We have Reversal Days and Distribution Days, but the Stock Market Indexes keep climbing up a Wall of Fear:


So let’s see if we can disect which way the wind is blowing by using John Bollinger’s %B and also the excellent insight we can get using HGSI and Edgerater for the Internals of the Market with the % Ratio of Stocks in the S&P 1500 above and below %B of 0.5, the Middle Bollinger Band:

The Simple Steps in the Process are:

1.  When the Ratio falls below 70:30 “Get Ready” and

2.  When it goes to 65:35 “Get Set” and if

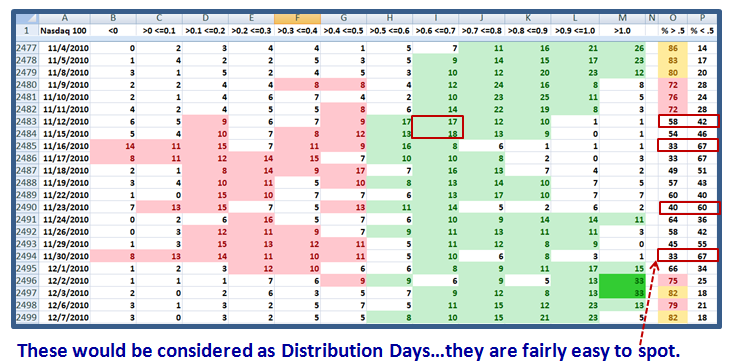
3.  It skips buckets with a Phoenix and a Kahuna to the Downside with a 45:55 ratio “you’re outta here, but too late!” 

However, %B for the Indexes themselves have a big cushion now, ranging from .82 to .94.  Watch out as they lose strength to 0.7, and then below 0.5.

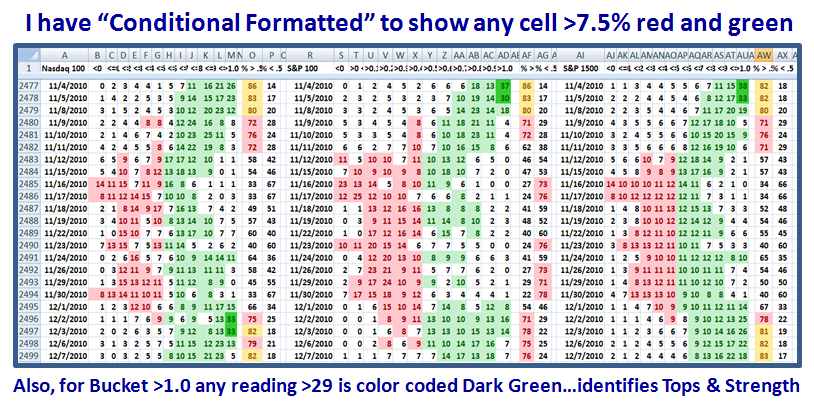
You have seen past examples of the following chart, which show a “scrunched view” for the %B Buckets for the Nasdaq 100, the S&P 100 and the S&P 1500:

Back on 11/04, the ones to watch were the S&P 100 & S&P 1500;  Note that on 11/11/2007 the S&P 100 gave the early warning sign and had reversed the next day…eight days from Top.  Note how 11/12 saw the tide turn and you had at least two days to be “outta here”!

Now it is the Nasdaq 100’s turn. We are in Day 4.  Note the readings of 82, 76 and 83 on 12/7 says the Market Indexes are in the Safe Zone.  Begin to worry when they come down to 70:30, and for sure when you see it at 65:35.

The Nasdaq 100 Index is the current leader and naturally fat with profits:

Start Counting “Twelve Drummer’s Drumming” from the day after 12/2/2010.  We are currently in day 4, and have eight more days of cloth.

One of two Scenarios will tell us what’s happening:

1.   Column M rises again to solid “green numbers” of 12 or higher…All’s well, or

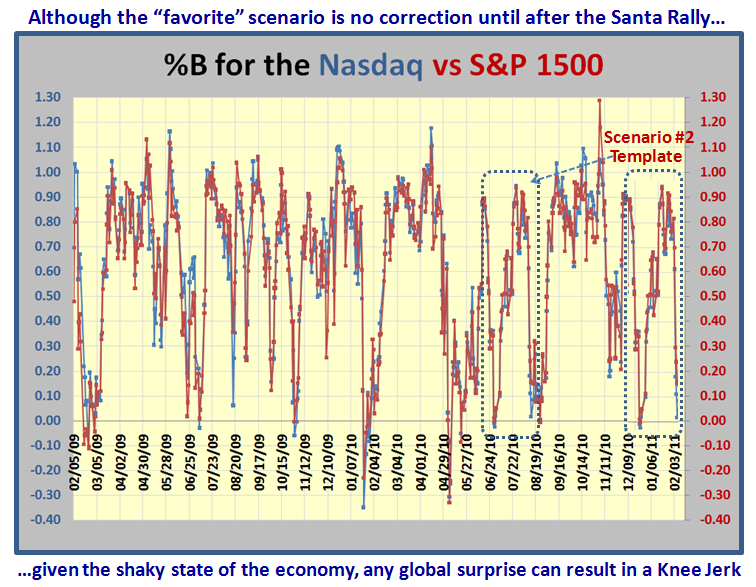
2.   Column “I” moves up to >17 and “O” and “P” move down to < 65:35 and we are about to cave in, or will have done so already.  It’s not difficult to follow.

With the first Scenario, if we get above 30 again, the rally is confirmed as still very strong and we start a fresh count as explained above.

With the second Scenario, here is a template of what one might expect and still have time for a Santa Claus Rally, though the Moose Dropping will be very apparent:

There you have it.  Best Regards, Ian.

Santa Claus Rally is out of the Fog with Rudolf!

Saturday, December 4th, 2010

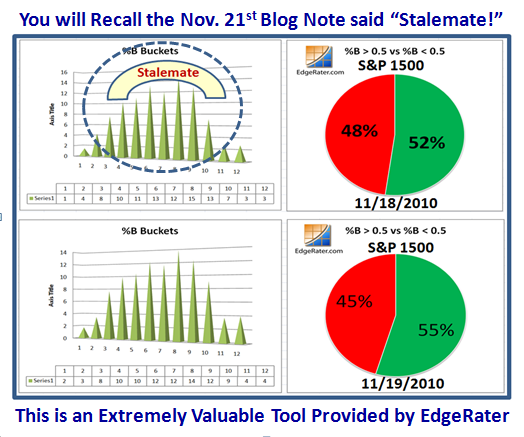
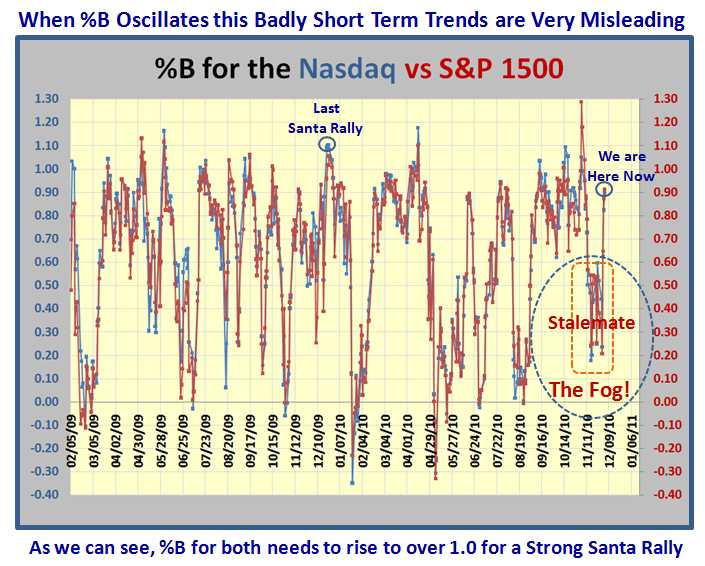
We have had two weeks of Stalemate as I mentioned in my blog of November 21st, but the last three days Rudolf has led Santa out of the Fog…for now!

Here is the Stalemate I showed you as we “Paused to Refresh” these last two weeks:

However, we have broken out of the Fog these last three days and are cranking up:

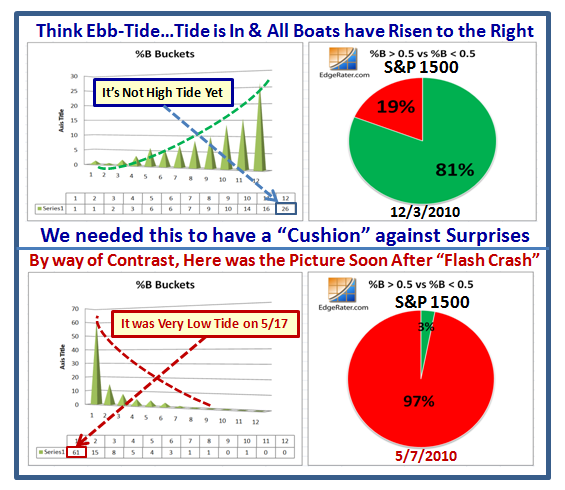
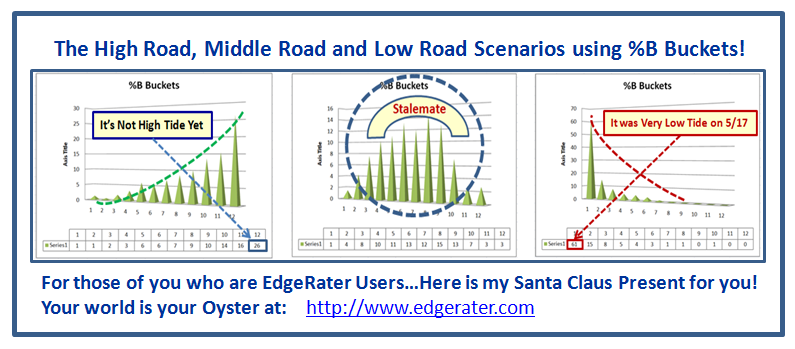
The new lesson is to understand “Ebb-Tide” for the to and fro of the Market:

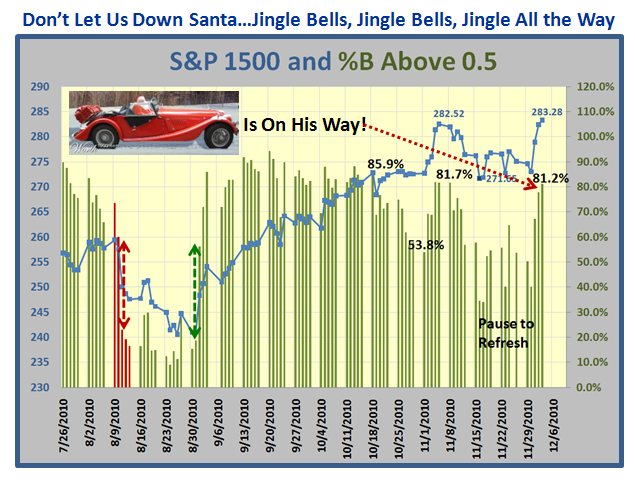
Here is the usual chart which shows the progress in the last 14 Weeks:

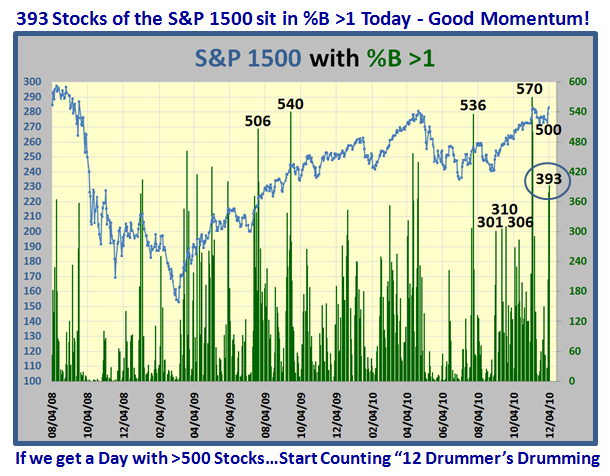
This next slide should stiffen up your backbone that two Eurekas this week always help to drive the momentum with 393 stocks in the top bucket >1.0 for the S&P 1500:

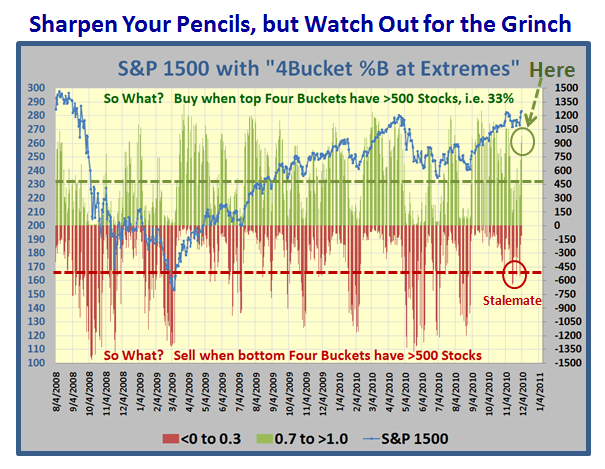
…And this should confirm that you should sharpen your pencil for the upside:

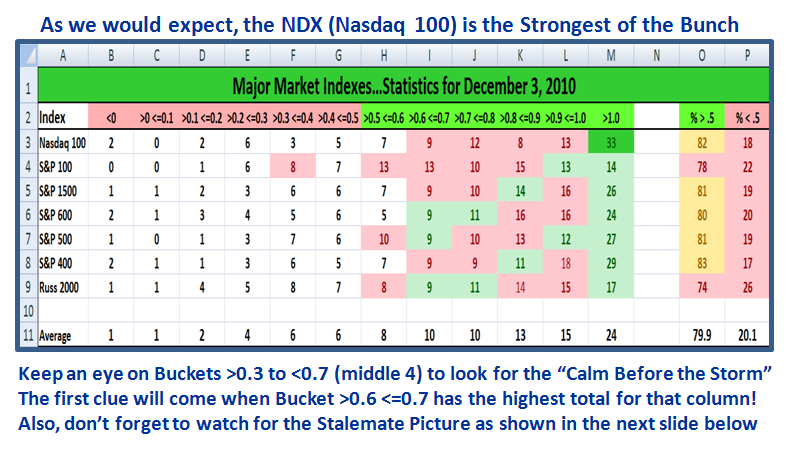
Here are the Market Index Stats for %B in buckets as of yesterday, December 3rd:

For you lucky people who have Edgerater, here is my Santa Claus Present for you:

Let’s try again outside the picture: http://www.edgerater.com     When you are done here…you won’t regret it.

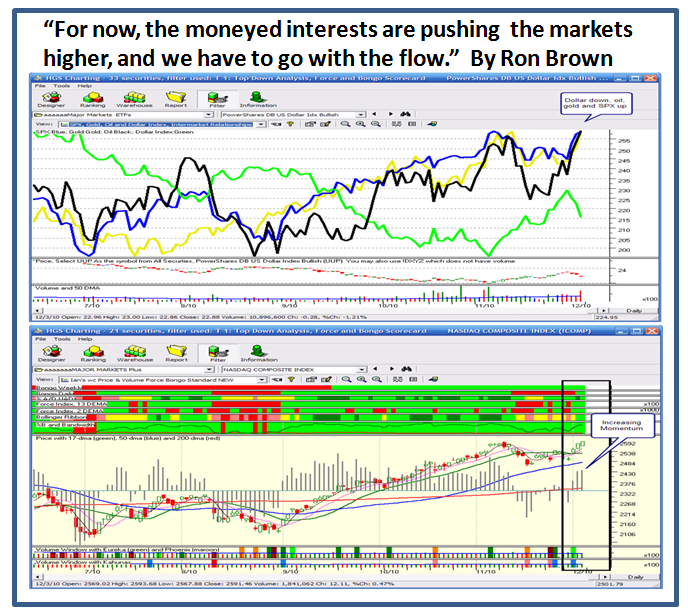
And Finally, here is a snippet from Ron Brown’s musings which sums up the whole picture for why we are at where we are.  Please get his weekly movie at the highgrowthstock.com website for a detailed review using HGSI software:

You can tell the holiday spirit is already at this house.  Have fun, Ian.

Santa Rally, Grinch & Moose Droppings

Sunday, November 28th, 2010

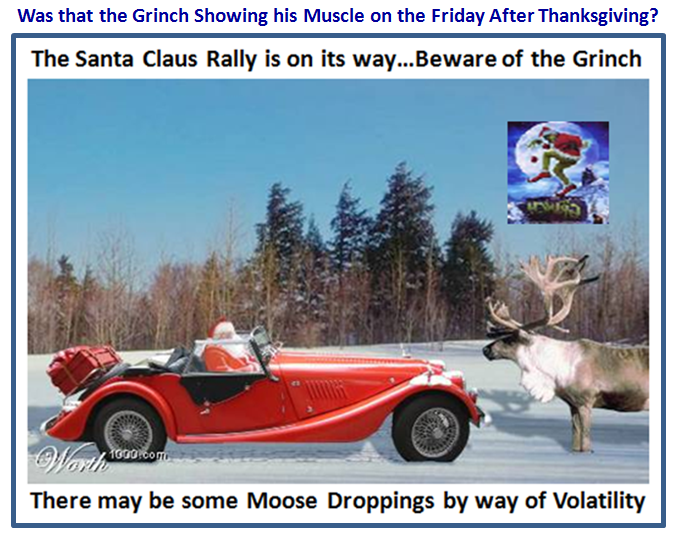
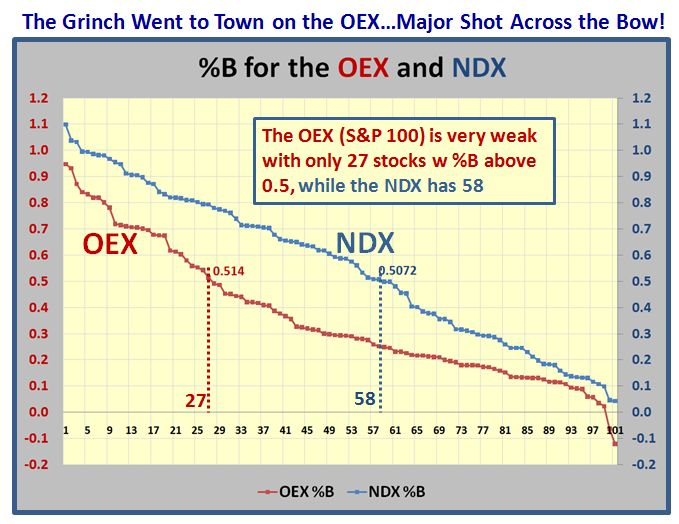
The Stock Market had a great day before Thanksgiving, but then the expected follow through fizzled badly on the day after, so we are still stuck in no man’s land with a slight bias in favor of the Bears.  The Grinch hit hard on Friday and hammered the OEX, the S&P 100, as I will show you later.

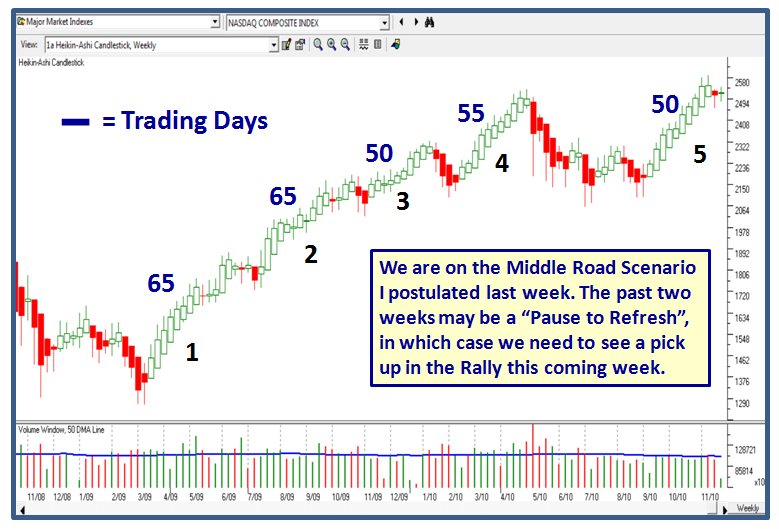
We have tracked this strong rally ever since the Hindenburg Omen scare back in mid and late August, and now that all of the kerfuffle is behind us I showed you three possible scanarios last week.  We sit 50 trading days up from the low with a couple of weeks “Pause to Refresh”:

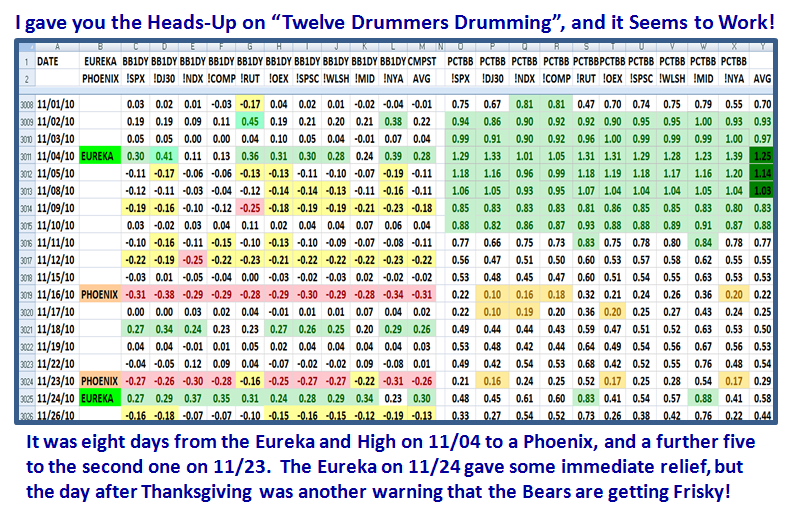
When we had that extraordinary jump in %B >1.0 for the S&P 1500 where we clocked up 1.25 with 570 stocks, I suggested that we had within 12 Days to see a turn down and I am glad to say that yardstick seems to work quite well:

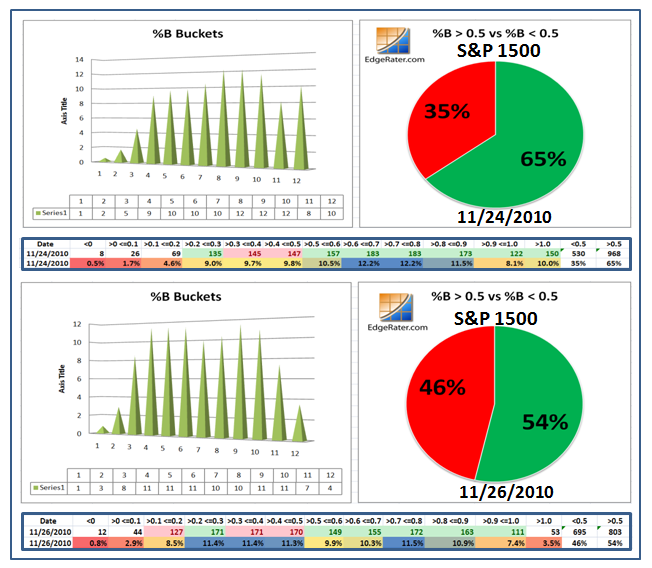
Grandma’s Pies are sitting at almost equilibrium and we really need a strong push this coming week to drive the market into a strong rally.  The Bulls are hoping that the Black Friday results for Retail Shopping will give the market the thrust it needs, but the dark clouds from the North and South Korea skirmish is hanging over the market’s head:

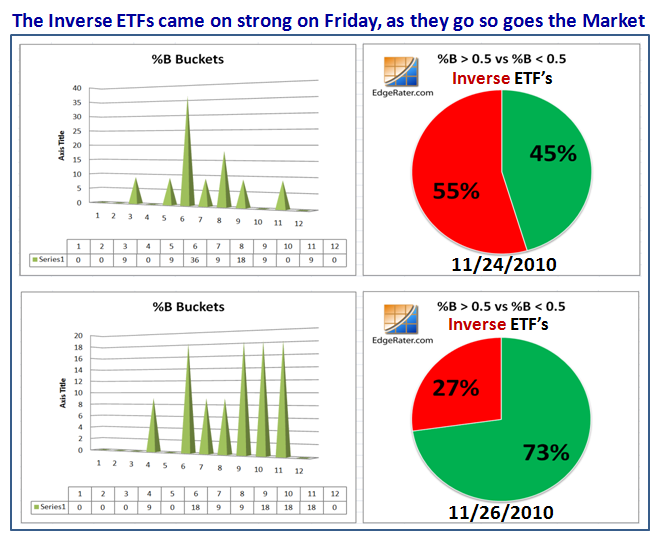
…And the Inverse ETFs also show that the Bears have the upper hand at the moment:

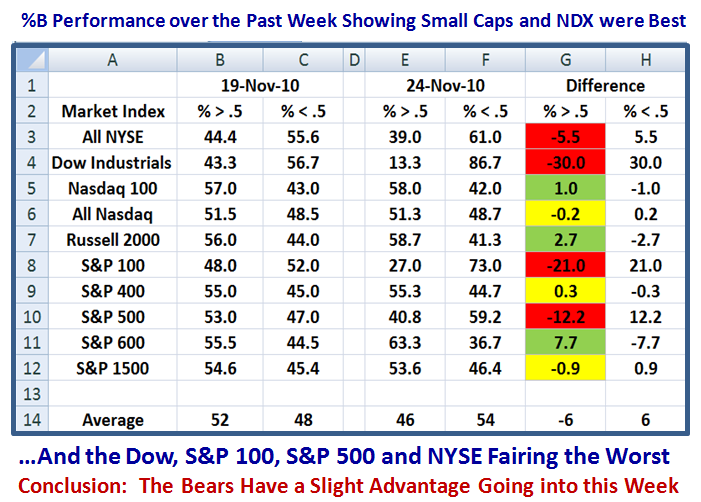
The S&P 100 (OEX) was hammered last week and is the weakest of all the Major Market Indexes except for the Dow Industrials as you will see below:

Here is the overall performance for the ten Market Indexes shown and one can immediately see that the Small Caps led the way:

So there you have it.  We should soon see if we have a Santa Rally or continue down before we have a move to the upside.

Best Regards, Ian.

Copyright © 2007-2010 Ian Woodward
Disclaimer: Commentaries on this Blog are not to be construed as recommendations to buy or sell the market and/or specific securites. The consumer of the information is responsible for their own investment decisions.