Ian Woodward's Investing Blog

Archive for the ‘HGS Principles’ Category

Stock Market – Bears are Hungry and Prowling

Sunday, February 21st, 2010

This last couple of weeks has been a “turn-up for the books” in that the Bears had the Stock Market in its teeth when the Greek Economy situation blew up in the Euro’s face and the Dollar has been gushing forth in no uncertain terms.  Likewise the Fed raised the discount rate to everybody’s surprise but the Stock Market brushed that aside, and we have recovered 61% of the drop we had a few weeks ago.  Net-net, we have a Fledgling, albeit shaky White Swan but make no mistake the Bears are Hungry and Prowling.

prowling

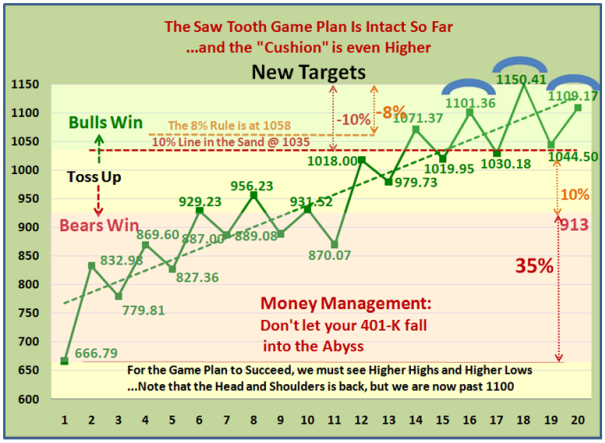
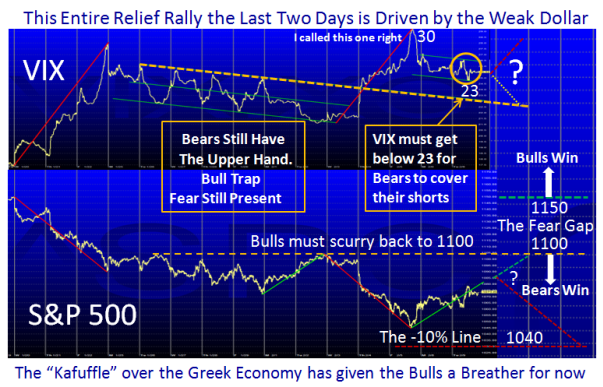
The net result is that we have had a little over a -9% Correction in the S&P 500, but have recovered to the 1109 mark and is now sitting with a Head and Shoulders pattern.  The Saw Tooth Game Plan which has served us royally for these past 11 months is back in full swing so the bottom line is that we either drive back up to the high at 1150 or fall back to re-test the low at 1040 for a double bottom to start with.

saw

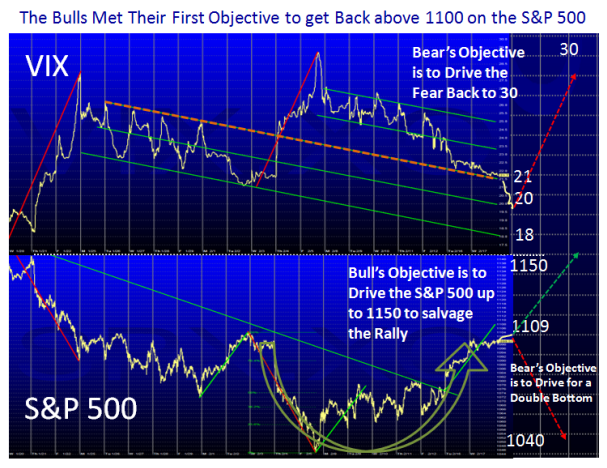
Continuing the theme of the VIX vs the S&P 500 which you seem to enjoy, the Bears had driven the fear factor back up to its customary 30 level with a 10 point swing up in two days for two separate occasions, but could not drive the nail in the coffin of the rally when it was on the ropes.  The Bulls have trundled back in a tepid sort of way, but when all is said and done the Market seems to have weathered the storm for now and they are intent on driving back to the recent high at 1150.  We shall see what transpires in the coming weeks.

vix

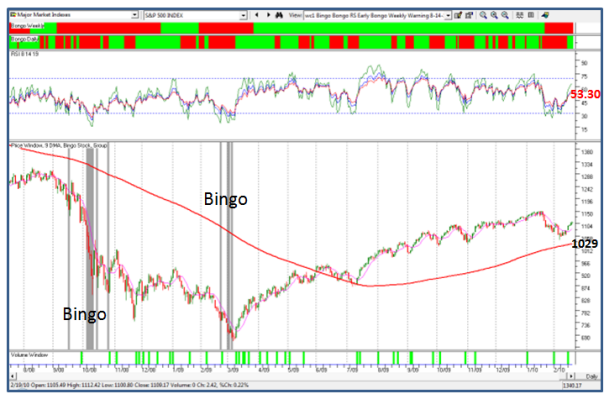
We came within a hair’s breadth of a Bingo signal…Oh! so you have forgotten about the Bingo!  A Bingo is an RSI 19 with a reading of 33.50 on the NYSE, which can signify one of two conditions:

1. It either signifies that we have reached an oversold situation in the course of a correction particularly if it is followed by the ever faithful Eureka which says the Bulls are buying with some exuberance, and better yet when we have two Eurekas within a week which says “Loud Cheers, we have irrational exuberance to the upside”, or

2.  It signifies the first of many more Bingo signals and therefore corrections to come which kills the rally, and drives the Market into a deeper Intermediate Correction; certainly at least to retest the recent low for a double bottom, or worse yet to finish up with a sizable correction of 12% or more.

bingo

You will note that the 200-dma is conveniently providing support at 1029 on the S&P 500 at this time so should there be more trouble to come, that is the last vestige of support for the Bulls before the rot sets in.  You can also see that the current reading of the RSI-19 Period is at 53.30 so we have a cushion with ample warning before we hit a Bingo at 33.50.

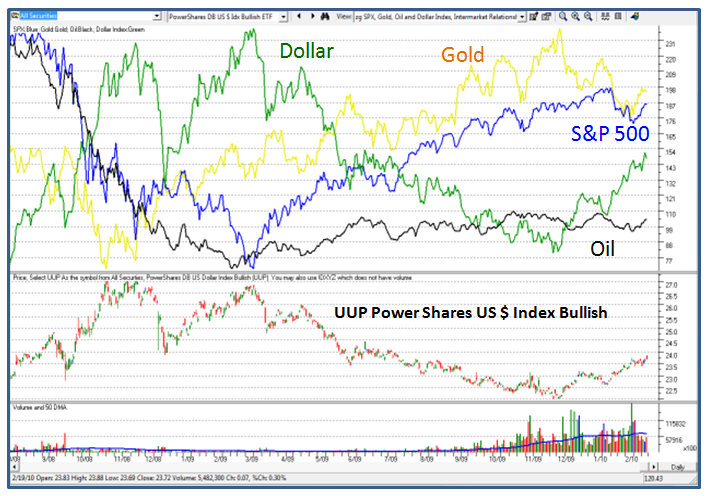
As I mentioned earlier the problems with the so-called PIIGS Economies (Portugal, Ireland, Italy, Greece and Spain) threw a monkey wrench into the equation and as you can see the Dollar which had been weak for so long throughout the Stock Market rally, bottomed, and took off these last several weeks as shown below:

dollar

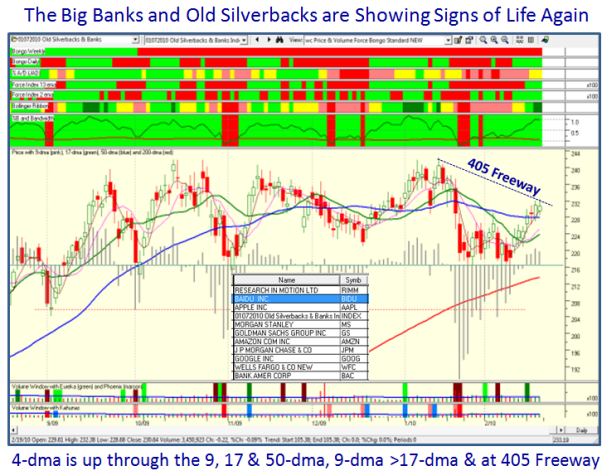
Meanwhile back at the Ranch, the bulk of the earnings reports are out and despite the decent Quarterly Gains in most of the stocks, the likes of the Technolgies and the Big Banks were hit severely.  I gave you a worthwhile Surrogate for the market a few blogs ago with the five old Silverbacks of AAPL, AMZN, BIDU, GOOG and RIMM, and the five Big Banks of BAC, GS, JPM, MS, and WFC, and I show below the composite picture of these ten stocks which like the stock market have done nothing since mid-September.

silver

Looking at the ugliness of that chart pattern would scare the pants off any Bull, but take heart, beauty is in the eyes of the beholder.  It is essential for me to give a balanced view so there are two obvious scenarios if you stare at the chart:

1.  The Index has retraced 61% back up and will turn down again to re-test its lows yet again.  The disappointment is that there has not been sufficient strength shown by way of the so-called Follow Through Day (FTD).  It is at the Upper Bollinger Band and must hold there or it is vulnerable to breaking down through the 50-dma one more time, therefore killing any of the promising fledgling rally.

2.  The Chart shows that this Index has Double Bottomed, the 4-dma is up through the 9, the 17 and 50-dma showing strength; more importantly, the 9-dma is up through the 17-dma and the Index itself is above the 50-dma.  Also note that all of this has happened because of the recent Eureka which fired four days ago.  It is poised at the down-trend-line from its highs, aka the famous 405 Freeway, and with one more Eureka it could drive up at least to reach the old high.  As my good friend Dave Baratto has reminded me recently, we need to think of the basics we learned so well in the Days of Wine and Roses, and this paragraph and picture says it all.  But then again, as my other good friend Aloha Mike Scott also attests to the Saturday Meeting findings where we concluded that there was mighty slim pickings of decent stocks, other than “Junk off the Bottom” (JOB) with great last two quarter earnings credentials, and beaten down recent warriors echoing the likes of the senior beasts I show you above.  You might take a leaf out of the White Goose’s book and watch AFLAC!  Good credentials.

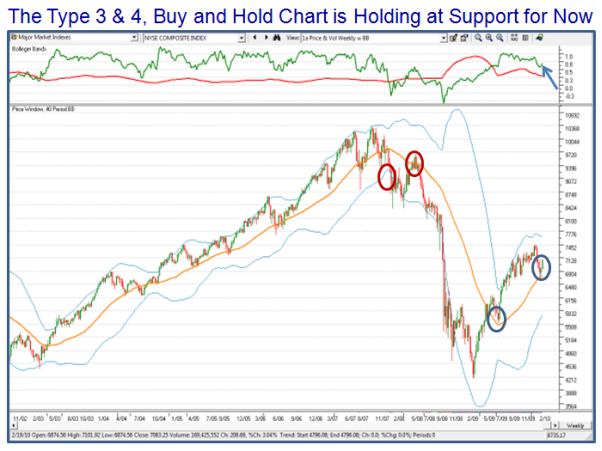
So it is a puzzlement and we shall see what we shall see this coming week.  In any event, the Long Term Buy and Hold Type 4 Investors can take comfort from the fact that the Long-Term chart has held and turned up from the support area that I have preached should be watched intently:

type 4

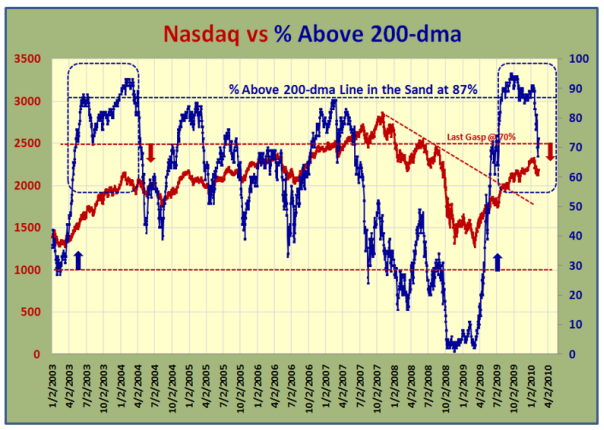
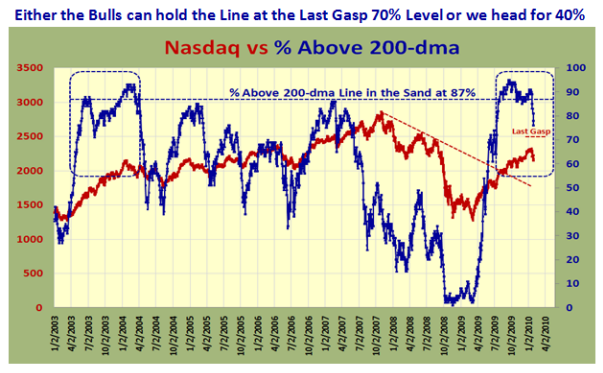
Last but by no means least, the one internal that was hanging on by a thread was the % of stocks above the 200-dma which had fallen below 70%, but has recently risen back to a respectable 80%.

200

These are difficult times to invest with the INTRA-DAY skittishness that abounds with all the indexes.  Keep your powder dry and come to the seminar in 5 weeks time where you learn a whole new set of good stuff to keep you on the right side of the market, both short and long term!

Best regards, Ian.

The Greek Gods are Smiling on the Bulls!

Tuesday, February 9th, 2010

Just when the Bears had the Bulls on the ropes, up pop the Greek Gods to smile down on the Bulls and stop the rot that could have set in.  That does not mean that the danger of a further drop has evaporated, but until the problems with the various Eureopean Economies are settled including Portugal, Italy, Ireland, Greece and Spain there will be unsettled markets across the globe.

     picture

The Bull and Bear fight for turf can be summarized as follows:

1.  After a downturn from the high of close to 8%, the Market bounced for two days with a very tepid dead-cat bounce as I described in my last blog.

2.  This gave the Bears confidence that the 11 month rally had stalled and it was time to look to the short side and nibble at the QID, SDS, and other similar ETF’s.

3.  Having shot the VIX upto the famous 30 mark where we reached recent crossroads, low and behold the Euro/Dollar situation turned around with rumors that the Germans would bailout or at any rate assist the Greek Government with its Economic woes. 

4.  This led to a strong bounce today at the onset, with a precipitous drop in the dollar and resulted in a new relief rally for the Bulls who were literally on the ropes.

5.  As I show in the attached chart, the Bears still have the upper hand and we must wait to see what transpires these next three days with the long weekend ahead of us. 

vix

6.  Despite the decent rebound today, the Bulls must show courage to drive the S&P 500 Index to at least the 1100 mark, and that is only the beginning in trying to recover the internals of the Market which are now badly oversold on most fronts.

7.  The gauge of the Fear Factor would seem to be that the VIX must subside to below 23 before there would be short covering by the Bears, who have the ball at present. 

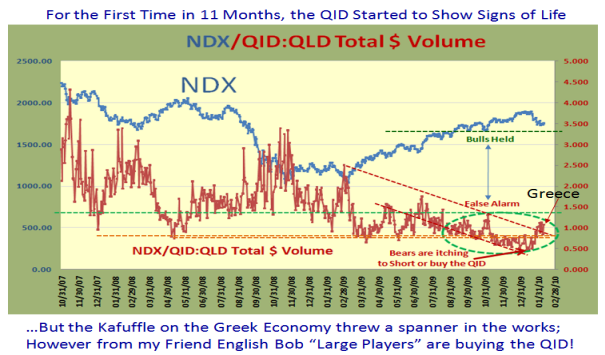
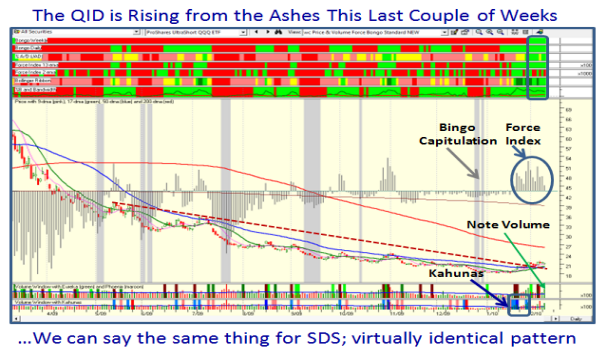
8.  The QID has risen from the ashes and is stirring slowly; it had a set back today:

qid

I trust you are all using the wc chart to spy the rotation that is taking place and what better way to see it than to look at the QID (and SDS, which have identical patterns):

hgsi

If the market continues to go down, the winky winky is not to forget to watch out for a Bingo to see some form of Capitulation.  In a Market Rally with a Minor Correction you will watch for a single Bingo followed very quickly by an Eureka (or the more the merrier) for a renewal of the rally.  However, in an Intermediate or Major Correction, expect several Bingos and Phoenix before there is exhaustion to the downside.  We came within a hair’s breadth of a Bingo yesterday on the NYSE, until the RSI 19 was driven back to over 40.5 today…so no cigar. 

Remember that the -8% mark is at 1058 & -10% is at 1040 for the S&P 500. 

Now you all know what to look for until I write the Newsletter this weekend!

Best Regards, Ian.

Bears Opened the VIX Floodgates above 25

Thursday, February 4th, 2010

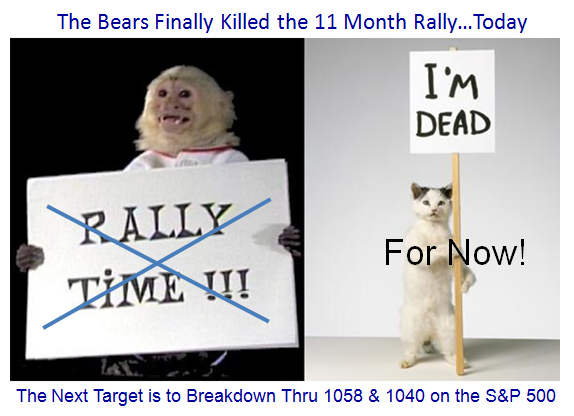
It had to happen sooner or later – the Bears had a field day today and clobbered the Market Indexes.  This could well be the end of the 11 month rally, but we will have to see what tomorrow brings. 

   cat

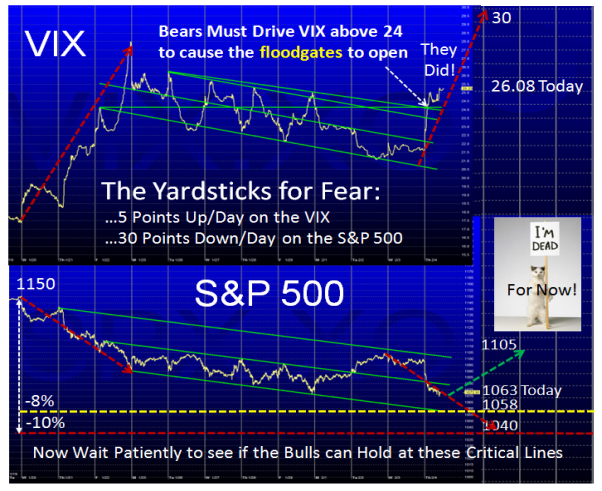
 The S&P 500 finished at 1063.11 and is only a meager 5 points away from an 8% Correction.  Assuming we drop below that tomorrow, the next target is 10% which would take us down to 1040.  A decent clean out has been expected for months, and the Bears have waited patiently for the true signs that they have the upper hand. 

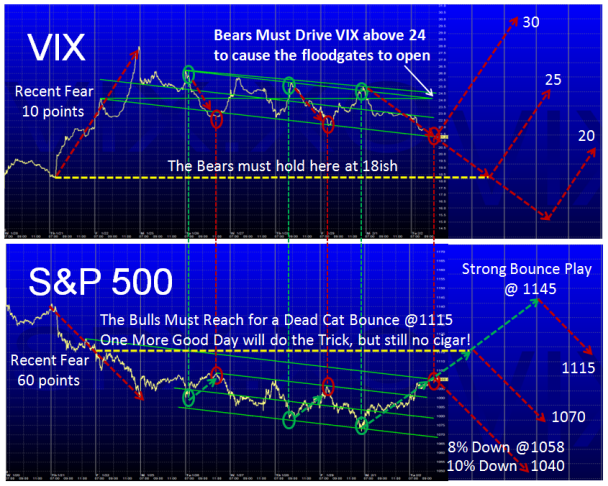
We have gained a lot of useful information regarding the behavior of the VIX and the S&P 500.  A simple rule of thumb is a “VIX Fear” factor of 5 points up/day, with 30 points down/Day on the S&P 500…between friends.  Here is the follow-up picture to the one I posted yesterday, and those yardsticks were confirmed again today:

chart 

It goes without saying that with the expectation of a poor jobs report tomorrow that the market should drop even further, and tomorrow’s action could speak volumes of what to expect in the immediate future. 

1.  The Bulls hold the line at somewhere between 1040 and 1058, or

2.  There is a rout by the Bears to drive the floodgates to a deluge of 30 or so on the VIX

In which case we can expect a further 30 point drop if these benchmarks are to confirm their value. This would imply that both lines in the sand shown above are broken for the weekend and next week’s action will prove crucial for the Stock Market. 

Shorts have at it with much fun, and Longs wait patiently to see how deep the carnage is or whether this was a decent clean out and a revival of the rally.  All the measuring rods will be out in full force this weekend by the various gurus of Elliott Wave, Fibonacci, etc, but keep your powder dry until the dust settles.  I feel sure the internals of the Market which I faithfully give you are all broken, so take your cue from that fact as there will be much repair needed after today’s numbers are digested.  Just look back a few blog notes to refresh your memory, and you will see the warning signs I gave you.

Best Regards, Ian.

Bounce Play or Dead Cat Bounce?

Tuesday, February 2nd, 2010

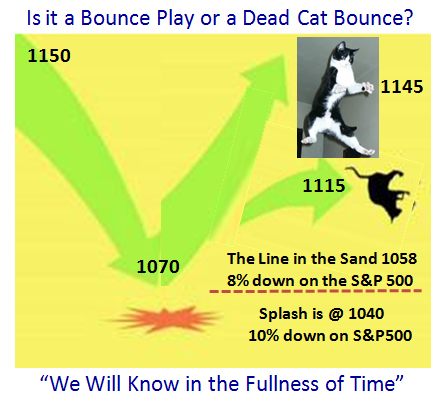
Here is a sequel to the last blog where I discussed Bounce Plays.  The thought struck me that I should show you the relationship of the VIX to the S&P 500 over the last ten days or so.  My new good friend Billy from Belgium planted the idea in my mind with his recent work, and I felt I might build on that to harness the near term parameters for defining a Dead Cat Bounce vs. a fully fledged Bounce Play.  As my other good friend Dave Steckler said “we will know in the fullness of time”, but I hope you will enjoy this short note, with no offense intended for Cat Lovers:

                      cat 

 The next chart needs no explanation, but as you can see there is tremendous symmetry in the relationship between the VIX and the S&P 500, so it seems to me that it is an easy call to make on the demarcation of where the Bulls and Bears are winning the tug-o-war.  We are sitting at around 1103 at the moment and with any luck another 12 points are on the cards to get to that stubborn line @1115. 

chart 

I suspect that given the general mood and bias to the downside that a Dead-Cat Bounce will peter out at 1115 and produces no Cigar!  The Bears are itching to short, but waiting patiently for the first sign of weakness after this two day rally. 

The Bull’s Challenge:

1.  Drive the short-term rally as far as they can towards 1145, and anything short of close to that will be the signal for the Bears to have at it.

2.  On the downside they must hold 1070…the recent low, or we will see the famous 8% down where 77% of all S&P 500 corrections turn back, or we head on down to 1040 which is 10% down.  After that it is anyone’s guess.

The Bear’s Challenge:

1.  Hold the fort at above 18 on the VIX and I would be surprised if it will get much below 20 even with a move to S&P 500 of 1115.

2.  Drive with “Bear fear” of 5 or more points per day on the VIX and break above 24ish for the real floodgates to open. That could take the VIX to 30 which is where most recent moves are turned back unless the floodgates turn into a deluge.

So now you have the simple game plan for the foreseeable future.  The March Seminar is now less than eight weeks away and it is time you signed up to get a seat.  We will be back at the Library, so as usual we can take 55 people with first come first served. 

Best Regards, Ian.

Bounce Play or Plunge into the Abyss?

Sunday, January 31st, 2010

As my good friend Mike Scott said to me;  “Let you know in a couple of days or a few weeks”.  The supposed bounce this past week never materialized, despite the good news of a 5% growth in GDP, and the relatively good Earnings Reports including the Tech Stocks which took a beating.

fool

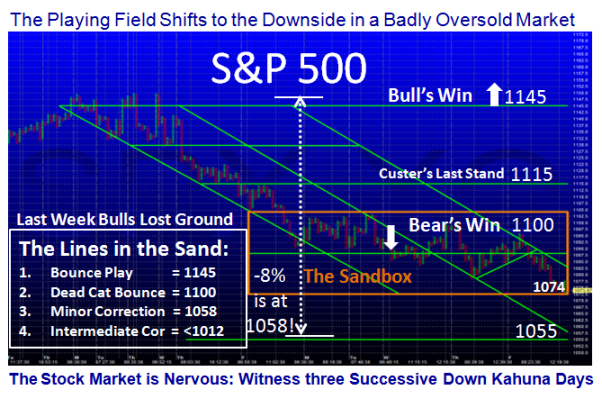
The Sandstorm blew last week in favor of the Bears and the tepid bounce was hardly even a Dead Cat Bounce.  So you will notice that I have lowered the target for a deadcat bounce to 1100.  Note that drops of 15 points per day on the S&P 500 have taken us down to 1074 and we are but another 16 points away from the Big Line in the Sand of 8% down, i.e., 1058.  So we could see that this coming week.

sandbox

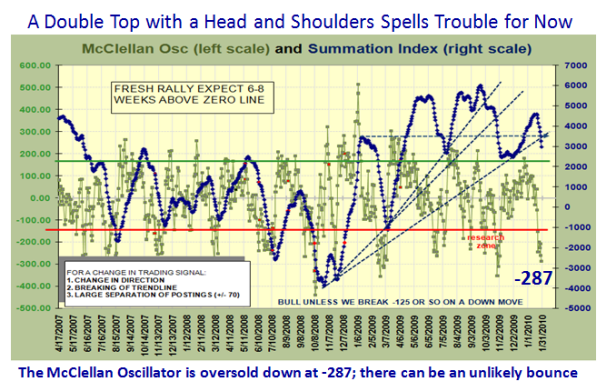
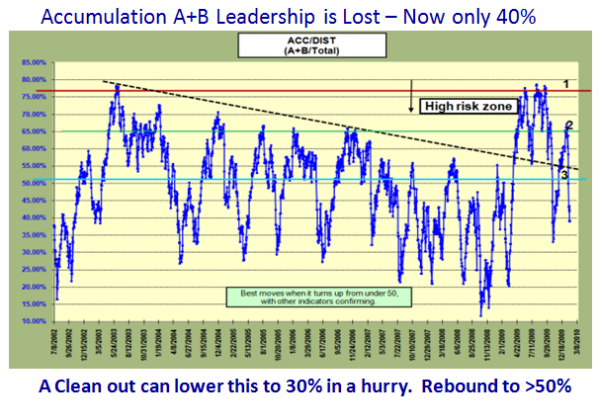
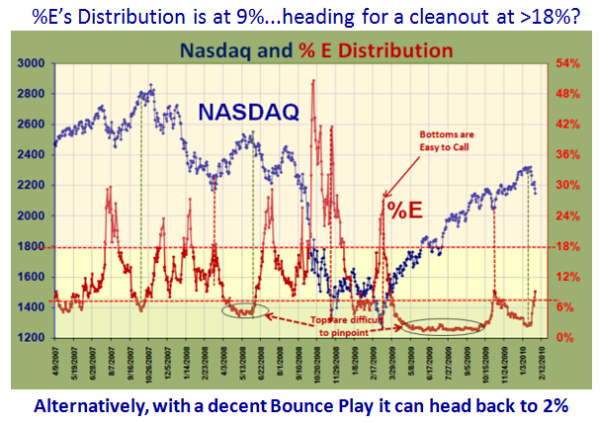
More importantly the mood is now somber all around.  I’m not telling you anything you don’t know already, but it will take a major turnaround of events to instill some life back into this rally.  We have only to look at the key internals we watch to see that a lot of damage has been done since the S&P 500 reached its peak of 1150 just 9 trading days ago.  The next four slides are well known to you so here they are in quick succession:

mc

200

a

e

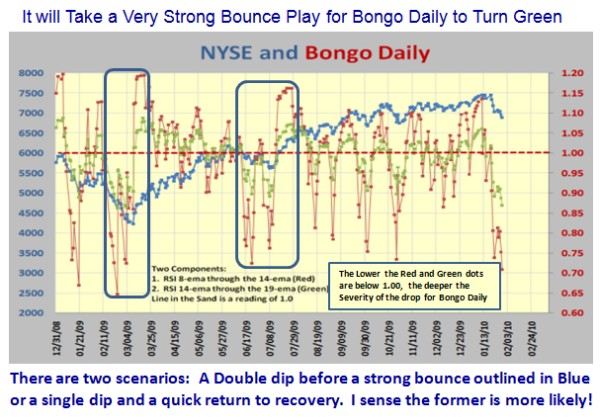
Now I come to a new beast, which my good friend Bill Roberts and I are working on.  The challenge was to see if we could give insight into how red was red and how green was green on Bongo Daily and Bongo Weekly.  This is work in progress but it might open your eyes that we are onto something. 

I will show you a snapshot of Bongo Daily to whet your appetite.  As you well know we use RSI 8, 14 and 19 ema as the basic crossovers to establish a trigger of Bongo Up or Down, and we struck on the idea of looking at the actual components of 8 up or down through the 14, and 14 up or down through the 19.  These are depicted by red and green, respectively in the chart below.  The demarcation line is “1.00” as shown by the dotted horizontal red line.  The higher the two lines are up from the dotted line at 1.00, the stronger is Bongo Daily and vice versa.  So we are in the dumpster at the moment!

bongo

So I summarize again by saying there are two scenarios:  A Double Dip before a strong bounce outlined in Blue or a single dip and a quick return to recovery.  I sense the former is more likely!  I don’t think I am mistaken that there is a change in psychology that has taken place these last couple of weeks as good news is being ignored and negative news carries more weight.

Best Regards, Ian.

Copyright © 2007-2010 Ian Woodward
Disclaimer: Commentaries on this Blog are not to be construed as recommendations to buy or sell the market and/or specific securites. The consumer of the information is responsible for their own investment decisions.