Ian Woodward's Investing Blog

Archive for the ‘HGS Principles’ Category

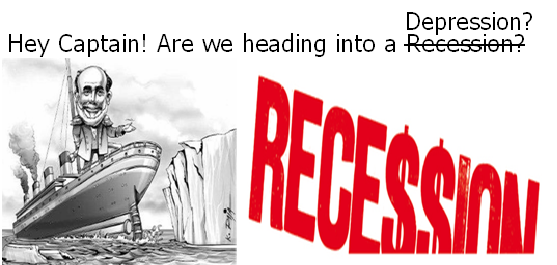
Hey Captain! Are we headed into a Depression?

Monday, September 22nd, 2008

I have updated this Blog Caption since I wrote the March 9th blog over six months ago and that time I did full treatment to using the Limbo Bar (the reverse of the High Jump) to take stock of where we stood relative to 2001.  I’m sorry to express gloom and doom, but if today’s discussions between the Administration and the pussy-footing Congress are anything to go by, that is precisely where we are headed.

Hey

As I showed in the March 9th Blog which asks “Where are we Headed #2?” , I gave full treatment to how I use the High Jump and Limbo Bar to take stock of where we are and where we might be headed.  It’s sad to say that History does repeat itself and what I said might happen has come to pass six months later when I felt we could be headed for a Recession.  Today’s action by the Stock Market is a warning sign that if the talking heads in Congress don’t stop yapping and do something quickly, we will all be up the creek without a paddle, including them.

Forget Bounce Plays and Follow Through Days (FTD’s) for a moment until we see some action from Congress.  What is important now is for me to remind you in four simple pictures of the Value I place on the High Jump and Limbo Bar at times like these to anticipate where we could be headed. 

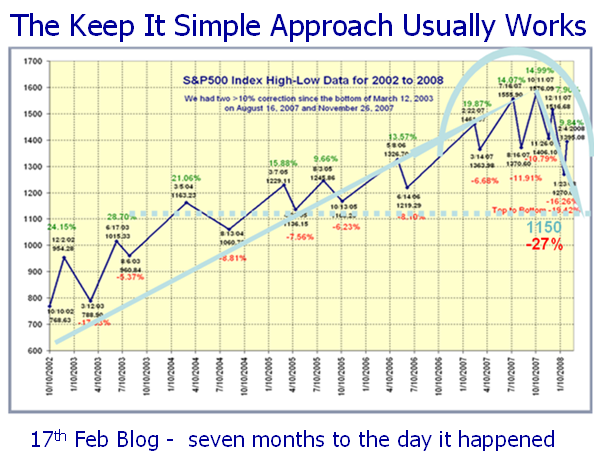
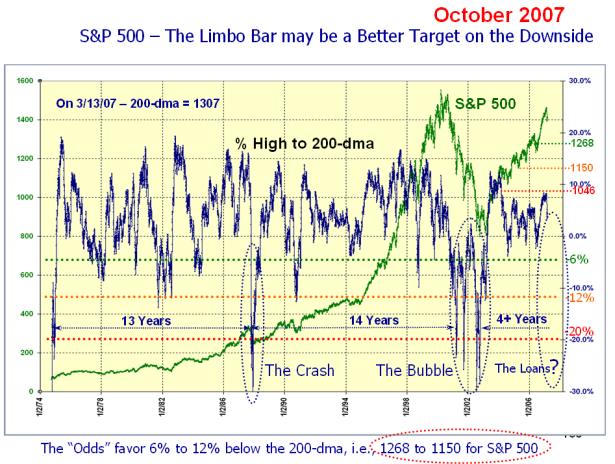
  1. It starts with a slide I used in the October 2007 Seminar where I first posed the thought that we could be headed down to 1150 on the S&P 500. I have shown that several times before in other discussions and in my most recent blog of a few days ago.
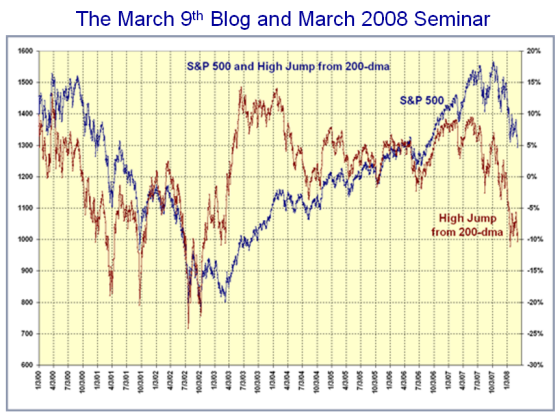
  2. We then fast forward six months to the March 9 Blog and the March 2008 Seminar to see the status then and the potential place we could end up in two slides from that blog.
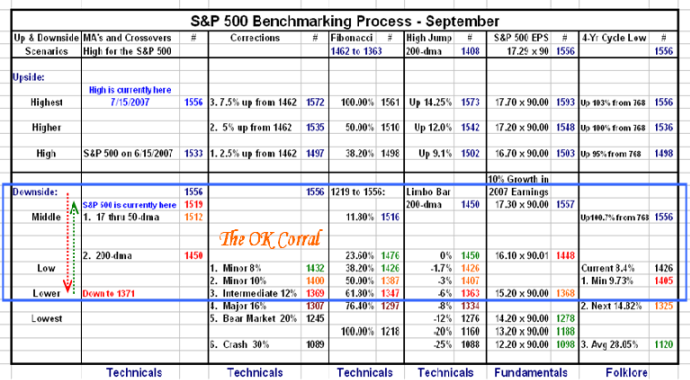
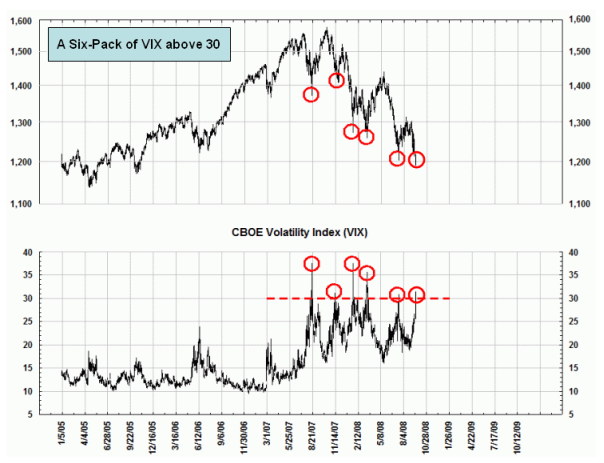
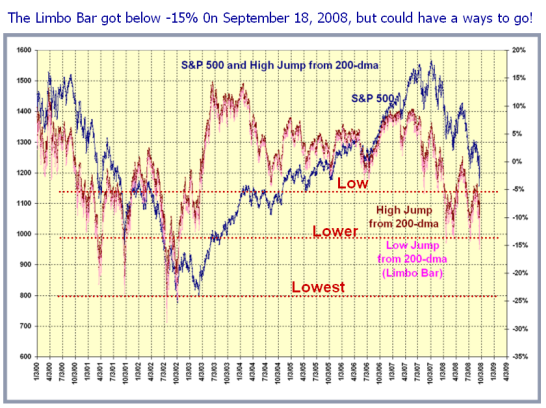
  3. Now we can take note of the critical Line in the Sand we are at with the Limbo Bar having crossed the “Lower” Target of -15% down from the S&P 500 Index, and where we could end up at -25% down if the flood gates should open due to dilly-dallying by the powers that be.

Of course, if they save the day, we only breathe for a while longer before the next debacle in the Financial System unfolds.  We will be reviewing these charts at the Seminar in October:

2007

mar 2008

$64

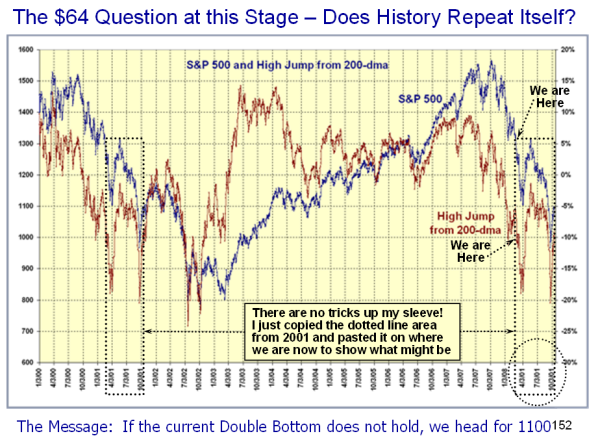
The above chart was in the March 9th, 2008 Blog…Sad to say we are at 1208 right now.

sep

I’m not suggesting that we head down to 800 on the S&P 500 any time soon, but the odds of 1150 is now almost a certainty and again, if we see any signs of bickering in Congress we are headed for 1000 and possibly lower.

Best Regards, Ian.

The FOMC is “Up the Creek without a Paddle”

Wednesday, September 17th, 2008

This is a “You Will Recall” blog that summarizes one year of History:

It finally happened and it isn’t over yet…Capitulation big time!

creek

indexes

I’m sure you recall the Thick Blue Pencil Line Chart…it was posted exactly seven months ago as a possible worst case scenario at that time.

1150


That didn’t come out of thin air – there was a Plan set a year ago:

ss

Read the September 20th Blog – Ignore the Fog and Follow the Signposts

I said at the time “Here is a one page plan that slices and dices the market six different ways, four of which are Technical, one Fundamental and one Folklore, all of which are self evident to the reader.  It is in essence a ready-reckoner that gives you insight to the different Road Scenarios, and shows where the recent Gun Fight between the Bulls and the Bears took place.  Your job is to know which side is winning and act accordingly.  Enjoy!”

hindy Now the only thing to do is stay in your Foxhole:

fox

…And that is the heart of HGS Investing in four quick snapshots.

logo In Good times and in Bad, “Try it you’ll like it; otherwise take two Alka Selsa”   

Best Regards, Ian.


Stock Market – There Goes the Neighborhood!

Monday, September 15th, 2008

I had a nasty feeling when I wrote my last blog of making a silk purse out of a sow’s ear that we were headed for more gloom and doom, and it hardly took a week before it happened.

d

  1. I am sure that after the hubbub has subsided with today’s downdraft on the stock market, there will be ample opportunity for Dredging, Bottom Fishing and Bounce Plays galore for those who haven’t thrown in the towel and given up in utter disgust at the undercurrents that pull one under.
  2. This on top of the dreadful damage that Hurricane IKE has caused in the gulf leaves most of the country with a sense of forlorn that will take some time to weather, but then out of misery and disaster comes hope.
  3. Sad to say it starts with hope and then turns to greed and ultimately to fear and we have come full circle.
  4. The gurus of VIX are dancing since they would not be satisfied until the VIX hit above 30 to make it a six-pack of super-fear, and they got their wish today with a spike to 31 and a pullback to 28.32 as I write this blog.

vix

You will pardon me for allowing my personal feelings to creep into this sad state of affairs with regard to the utter debacle that has unfolded and the serious consequences to decent folks who make an honest living and try to leave their children on a higher rung than they and their ancestors left them in turn.  There is a saying used in England to describe the mentality of those who could care less about anyone but themselves.  That feeling seems to have permeated throughout the world, where decency and honesty have given way to selfishness and greed with “Blow you Jack, I’m all right!”

vultures

Now the vultures will make hay and ultimately this too will pass but not before the turmoil around the world finds most of it suffering from a deep recession and many in sheer misery.

For those who still wish to dabble in this market, I feel that Ron and I have given you all the tools both in this month’s High Growth Stock Newsletter which was out yesterday and in the Seminar to come.  Here is a way of how to find the opportunities both on the long and short side using a Decision Tree:

tree

Best Regards, Ian.

Beware of the Market Gloom in September!

Thursday, September 4th, 2008

It’s funny how History repeats itself; we all know that historically September is the worst month for the stock market and here we are only three trading days into September and all have been down and certainly distribution days.

beware

The Bounce Play since mid-July is curtains for now, and once again we might soon be staring at the lows of this Bear Market, with the distinct possibility if the lows are broken the market trots on down to the next level of 1150 on the S&P 500.

For the record, it is a sinister sign that we had no Eureka signal, despite the Follow Through Days (FTD) we experienced on July 29, Aug 5 and Aug 8 were healthy moves of 2.4%, 2.8% and 2.5% in quick succession, we soon fell back into the doldrums.  At the time I discussed at length that we could excuse the lack of Eureka signals which to those who know show some signs of irrational exuberance by the Bulls.  The reasoning was that the market was so heavily oversold that it was unlikely at that time.  However, that was a month ago, and it was easy to see that the entire rally had stalled and at best was going sideways and at worst setting up for a fall.  The evidence is in the chart below:

gloom

I showed you a similar picture just eight trading days ago, two blog notes earlier, so I hope that if you did nothing else you kept an eye on the # of stock market Industry Groups that had “A” Accumulation.  It takes less than one minute on High Growth Stock Investor:  Select IM Industry Groups in the Warehouse and then select the Filter Named Accumulation “A”.  Read the # of Groups in the Warehouse.  You’re done.

After a -3.2% distribution day today on top of the three previous days totting up to a further -3.3%, the Bears are dancing and we cannot make a silk purse out of a Sow’s ear.  Now one waits for fresh signs of the “same mumbo jumbo” (good stuff) for a rally.  Qid’s win over Qld’s at the moment in the ETF department, so short till the picture reverses.

In my opinion, it confirms that the FTD concept alone is lacking and not to be trusted without additional evidence that a fresh rally is underway.  Meanwhile the mountain of fresh new lows is starting to increase as we have 160 today.  Also the number of Declines to Advances on the NYSE was over 5:1 and so were the Dec to Adv Volume, so it was a terrible day all around.  All Major Market Indexes are on a Daily Bongo No and all but two are also on Weekly Bongo No, so the Bears have the bit between their teeth.

The lesson learned is to wait for the Irrational Exuberance exemplified by a Eureka signal as this time there is no excuse for the bulls not to step up to the plate in that the market is not as oversold as before and we have the evidence to prove it since at this stage there are no Bingo signals. I hope you see how the logic and the stock market tools we have given you are working hand-in-glove and keeping you on the right side of the market.   Should it break down below the current recent lows, then that is a different matter and we will need to review the bidding at that time.

Best regards, Ian.

Buying North of the 405 Freeway with Wolf-Packs!

Monday, August 25th, 2008

logo

High Growth Stock Investors have long since learned the secret of “Buying North of the 405 Freeway”, aka buying breakouts through the declining tops line, rather than at the brim of the cup.  This is especially true when the stock market has been trashed where most potentially new or old warriors have bent out of shape Chart Patterns that hardly resemble the ideal shapes one looks for such as Cups and Handles and Flat Bases.  In a see-saw or yo-yo market, the way to play is to Strike While the Iron is Hot and take short term profits.

hot anvil

In recent weeks we have seen several stocks with good fundamentals fail at or soon after breakout such as AMED, EZPW, MPWR, and VISN compared to those that have given some explosive moves such as CNQR, ILMN, NUVA, PMTC, VAR and WGOV to name a few. Had the recent rally attempt not fizzled, some of these stocks from both lists could have been true leaders.  Now they wait for fresh winds at their backs.

1. Many of these stocks show a similar characteristic of a Breakaway Gap; this usually occurs at the 405 Freeway. It implies a positive earnings surprise.

2. Those that are successful show the gap has NOT been closed, and are hovering to gain a second wind to move higher, again confirming “Wall Street halo”.

3. Only one, ILMN, has a Lower Left to Upper Right (LLUR) chart pattern and is an undisputed BIG Stock for this phase of the Market if it can hold at $87.

At times like these where we have seen some decent Earnings Reports and the market is trying to find a bottom, there are some old warriors and new candidates that are delivering false breakouts. This is much to the consternation of those dyed-in-the-wool investors who haven’t stopped to think that the so-called “standard approach to buying breakouts at the brim of the cup” is a toss of the coin and in Bear Market rallies the odds are even worse.  Here are some statistics from the past that will make my point:

stats

I grant you that this in an excerpt derived back in the 2003-04 timeframe, but if anything, the results would be expected to be worse now given a vastly oversold market.  Short of bottom fishing or dredging which has a better pay off these days for “Value” stocks, it seems to me that commonsense suggests that given there is new news both in terms of a good Earnings Report as well as some new product or service, it pays to look for such opportunities after they have shown they have turned the corner by displaying a double bottom and have started to head up the right hand side of the “cup”.  Amazon, (AMZN) is an old warrior that is turning the corner, and is a great example to buy at the 405 Freeway than waiting for the brim of the cup.  The 405 Freeway in Los Angeles goes from North-West to South East, hence the analogy:

AMZN

In the above chart, I have shown the overlay of the Fibonacci Lines and as you can see AMZN is between the 50% and 61.8% retracement level.  Stocks that are below the old high are vulnerable to providing a Head and Shoulders pattern for shorting should the Market not follow through and the initial breakout fizzles.  However, the counter to that is the reception by the Street to the recent positive Earnings Report as well as the current hype on their new product relating to “Kindle” new models of its e-book reader.  In the chart below, I give you my opinion on where to enter after the stock has risen off the bottom to be at least the 38.2% level as an early buy, AFTER the stock has made a handle.  Strike while the iron is hot off breakouts above the 50% mark is safest, and use Fibonacci to help in the buy decision:

 fib

The bottom line message is that one sure way to know if a Market is repairing is to watch the number of breakouts and the number that succeed relative to those that fail.  At the moment this is a shaky market on that score.   I showed you another way in my previous blog note which looks at the Industry Group momentum or lack there-of.  One such group which is hot at the moment is the old Solar Wolf-Pack with six stocks delivering from 23 to 62% gains in ten days!  They are SOLF, STP, LDK, SOL, SPWR, and CSIQ.  Here is another in Enrg-O&G Explor&Prod with a range of 18 to 47% with stocks like PDO, MXC, PETD, ARD and GEOI. 

In tricky markets like this, you need the assurance of safety in numbers, i.e., Wolf-Packs.  Remember that this is the summer season where volume is naturally down due to graduations, weddings, and vacations in the Hamptons, to say nothing of the Olympics these past two weeks.  The way to compensate for the lack of volume is to know which Wolf-Packs are getting the attention.  Use Wolf-Packs to find where the action is, select the stock(s) from the Wolf-Pack, and then Strike While the Iron is Hot for that day or as long as the Wolf-Pack stays hot!  Otherwise stay in your foxhole.  If 1257 on the S&P500 is broken, watch out below. 

Best regards, Ian.


Copyright © 2007-2010 Ian Woodward
Disclaimer: Commentaries on this Blog are not to be construed as recommendations to buy or sell the market and/or specific securites. The consumer of the information is responsible for their own investment decisions.