Ian Woodward's Investing Blog

Archive for the ‘HGS Principles’ Category

The FOMC Grinch that Stole the Santa Claus Rally

Monday, December 17th, 2007

fomc

What goes around comes around.  Several times in October and November the FOMC handed out pre-Thanksgiving gifts when the Bulls were on the ropes in their fight with the Bears, but it seems justice has been served to the Bears this time around.  Helicopter Ben thought he would shave a little off the Fed Funds Rate, but the cut blew up in his face. The Stock Market felt that 25 basis points wasn’t big enough as they were already anticipating 50 basis points, and felt that the bigger problem is that there are a lot more shoes to drop on the sub-prime loans business to say nothing of the other problems of a weak dollar and Inflation/Recession raising their ugly heads. 

Today the Bears hammered all those darling Silverback Gorilla stocks fat with profits, and although the Indexes came down 1.3% to 2.48% for the DOW and Nasdaq 100, respectively, the Market seemed to go down in an orderly fashion with no panic selling evident.  Realize that this is triple witching week for Options Expirations, so we should expect Volatility tomorrow which is usually the most volatile of the week on such occasions, and Wednesday to be quieter and the most positive day for the week based on the past two year’s history.  Monday’s are typically the most negative so it behaved true to form.  

Turning our attention to the New Highs and New Lows the beat goes on to confirm that we are headed down as shown with a very low reading of 19 New Highs and a reasonably big reading of 359 New Lows.  Not panic stations as yet when one expects several readings at this level with some as high as 600 to 1000…then we might expect a bottom to set in.  Also Decliners and Declining Volume outpaced Advances by a ratio of about 4.5 to 1, also weak readings.

        new highs

Sure, we can always have a bounce play off a very oversold situation, and certainly with the two pictures I showed in yesterday’s blog on the weakness of the leaders as measured by the “A” accumulation stocks being 5%, and the less than 35% of stocks above their 200-dma, we are due for a bounce.  However, I would expect that except for the day-traders and moment-traders will be playing for very short-term gains, longer term holders will take the opportunity of selling into any reasonable rally, since they have been caught on the wrong side of the momentum of the market.   Lastly, the place to make quick and big money is in the Ultra Short ETF’s with the biggest winner being the FXP…Ultra Short on the Chinese Silverbacks! 

Be careful in this market and settle back with an EGG NOG or two to enjoy the holiday spirit.  Best Regards, Ian.

Is Santa Coming to Town or Will the Grinch Steal Christmas?

Sunday, December 16th, 2007

santa

I send Seasons Greetings to all my new found friends in various blogs around the world and especially my followers in Greece led by Thrassos who first found me with the mention of the Hindenburg Omen, and for his encouragement in the various Comments he makes from time to time.  Since he said they like the pictures I give them supporting my statements here are a couple of statistics which they would not normally see to show how poor the underlying internals of the market are at this juncture when the Grinch seems to be winning over Santa!

It goes without saying that after this past week’s roller coaster market the Grinch is winning so far.  The leadership of “A” Accumulation stocks has narrowed to a paltry 5%, with an alarming drop in the last three days from 7.5%.  As we can see from the diagram below:

a accum

  1. We are heading for the 2.5% level if this current trend keeps up, and that will be the time to sharpen our pencils.  We are just over 100 stocks at present and when this shrinks below this level we will have some clue of where to find the survivors.  The place to look will be the high “B” accumulation stocks that have had less than 15% correction from their highs.
  2. The leadership we used to enjoy back in 2005 and 2006 with peaks of “A” accumulation stocks has dwindled from highs over 15%, have now got lower and lower in 2007 where 10% is all we can expect these days. 
  3. This suggests that the nifty-fifty phenomenon I mentioned all of two months ago will ultimately get cleaned out with a Major Market correction and we will see rotation and a new birth into new Industry Groups and fresh stocks taking over the leadership. 

I am indebted to my good friend Mike Scott for these views and here is another gem from him which shows the weakness in the overall Market as we have deteriorated from a healthy 89% of stocks above the 200-dma back in January this year to just above 30%.  Again we can see that we will soon be testing the recent lows down at 25% we set in mid-year, 2007.

200dma


While the rest of the country is suffering from a terrible snow storm, we are basking in sunshine in our world on the West Coast just 15 miles south of the LAX International Airport.  Unfortunately, Ron is shoveling snow in Nebraska.  Good luck to you all is the sincere wish of your friends, George, Matt, Ron and Ian. 

The HGS Investor December Newsletter Overview

Sunday, December 16th, 2007

Newsletter

Another Year is almost at an end and the HGSI Team of George, Matt, Ron and I send you all our sincerest wishes and Season’s Greetings for this holiday period and may all your trades be winners in the New Year.    

I wish I had cheery news to go along with this time of the year of the festive season, but I will pull no punches and tell you that I feel the Grinch stole Christmas as the saying goes, and we are in for more rough sledding on this roller coaster market.  There is little more by new good news to come unless the FOMC pulls another rabbit out of the hat and conjures other ways to prop up the market that can improve the lack of confidence that is now permeating through the Investment Community.  Expiration week looms directly ahead and often provides some fireworks.  The following week will be the last opportunity to posture for the year-end.  Fasten your seat belts, the roller coaster ride, up and down, could be interesting. 

This month my Case Study has focused on identifying a few benchmarks for unraveling the mystery around the Tops and Bottoms in the Market.  It turns out that of all the parameters that we discuss surrounding the Hindenburg Omen, Eureka and Bingo signals there are three easy levels to remember relating to New Highs on the NYSE.  I hope you enjoy this insight and we will certainly keep an eye on this going forward.    

Ron’s movie and focus this month continues where he left off last month on how to milk the most out of the new Group Inclusion feature.  This month he concentrates on using user groups to prospect for both long and short candidates because after experimenting with the Group Inclusion report it has the potential to help HGSI users find potential winning stocks that do not appear when using filters and combos.  It always amazes me how Ron can conjure up new ways to squeeze the best out of the HGSI software.  It is very versatile as I am sure you will see from Ron’s movie.  The Newsletter will be posted later today.  Best Regards, Ian.

Santa’s Gift from the White House

Thursday, December 6th, 2007

white house

We have had a few visits from Helicopter Ben to save the day in November, and now we have Santa Claus bringing the Bulls a gift on Mortgage Loans from the White House in December.  President Bush outlined a plan to help struggling homeowners avoid losing their properties, including a five year freeze on low and introductory mortgage loans.  Treasury Secretary Paulson said the effort isn’t a “silver bullet”, for the housing crisis but should provide some relief. 

The upshot of all of that is with a proper follow through day yesterday on the Stock market Indexes, we had another rip roaring session today to send the Indexes back up into respectable territories from their recent lows.  Since my last blog on Sunday where I laid out the Game Plan for the recovery from a Base Low in three steps using the 405-Freeway as the lynchpin to success, we trotted down calmly for two days at the start of the week to pause to refresh and yesterday and today have been blockbuster moves in the Stock Market.

freeway 

That was my early Christmas Present to all of you last weekend, and here we are like magic sitting right at the 405-Freeway on all three Major Market Indexes (between friends).  I show the previous move on the S&P 500 so that you can see there can possibly be a slight hesitation similar to the yellow dotted oval last time, before the Indexes can push their way through that overhead supply depicted by the line I show; especially since there have been two powerful moves these last two days.  It goes without saying that the bear’s scenario is “Don’t count your chickens before they hatch” and “There is many a slip twixt cup and lip!”  So let’s review the bidding: 

  1. It all hinges on two important pieces of news starting tomorrow with the Jobs Report and on Dec 11th when the FOMC Meeting delivers their much awaited decision on lowering Fed Funds Rates once again.  Whether it is 25 or 50 basis points or none at all remains to be seen. 
  2. Bad news on either or both of these two items can get the bears dancing and prancing once again, but good news of course will provide the booster rocket to propel the market for a decent Santa Claus Rally.   

In the meantime, the work that my friends have done suggests with a big winky-winky that stocks with ERG 270 is where the action is since the market started its correction on Nov 1, and I will show you that in the Newsletter next week.  When the market is jittery always go for those with the strongest credentials in ERG for the smoothest rides.  For sure you need Stocks with EPS Rank >90 and Rel Str >90 and preferably Group Ranks greater than 70 if not higher.  Some Wolf Packs such as the Transportation – Shipping are a trifle tired, and others trying bottom fishing for the umpteenth time with the Home Builders are still trying to find a bottom.  The Chemicals – Specialty are white hot, the Energy Alternatives run hot and cold and it is good to see that after a shaky week or so in the Technology Stocks they seem to be rebounding nicely with the likes of GOOG, AAPL, GRMN as well as fresher ones such as VIP, SIGM, PTT are worth a look based on their strong Fundamental credentials 

With regard to the Rebound, we can see that there has been substantial repair in the market Indexes this past week as we are essentially only 4 to 5% from the Oct/Nov highs. Notice that these stakes in the ground remain the same, and all one has to do is move up and down the scale as the case may be based on the Markets action.  Doing it this way gets your stomach in sync with the Fear and Greed Syndrome and which side of the market you should be on. 

  targets 

Net-net, Stakes in the Ground, Frequent Measurements, Base Low, 405-Freeway are all part and parcel of guiding you to victory in mastering the Stock Market during corrections.  Best regards, Ian 

HGS Investing Principles – The 405-Freeway

Sunday, December 2nd, 2007

hgs

I felt it was time for me to write an HGS Investing Solutions Article on the value of the concept I developed called “The 405 Freeway”.  As those who have visited Los Angeles know only too well, the 405 Freeway runs from Santa Monica in the Northwest to San Diego in the Southeast.  It is the biggest parking lot in rush hour traffic you would find in these parts of the woods or for that matter in the world, and in Investing terms that would spell strong resistance to breakouts.   In doing the blog yesterday where I show the value of the 405-Freeway, it struck me that the recent examples we have lived through since the Base Low of August 16th, 2007 give us a classic picture for describing the essential ingredients an investor faces after an Intermediate Correction.  History never repeats itself exactly the same way, but it comes close enough that one can usually identify three alternatives after an Intermediate Correction: 

  1. A “V” bottom is the rarest chart formation and is more likely to occur early in a long bull rally than at the later stages.
  2. A “W” bottom is the more frequent formation where the previous low is retested before the low is confirmed and the new rally is on the way.
  3. An Inverse Head and Shoulders formation as shown on the chart below, which is a hybrid of the other two.

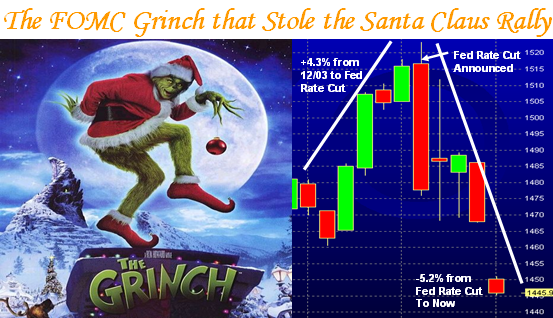
The psychology of the herd before a market bottom is confirmed is naturally one of more fear and less greed.  On August 16th you will recall that we were at panic stations and many were throwing in the towel when the FOMC came to the rescue.  We had experienced two Bingo days in a row at the lows which culminated in a long spidery leg as the market drove back to recover most of the losses on August 16, and then moved up the following day.

405 chart

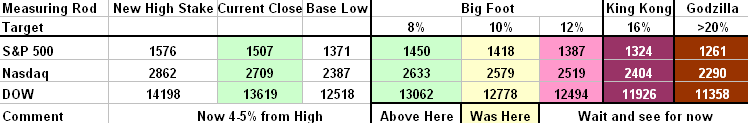
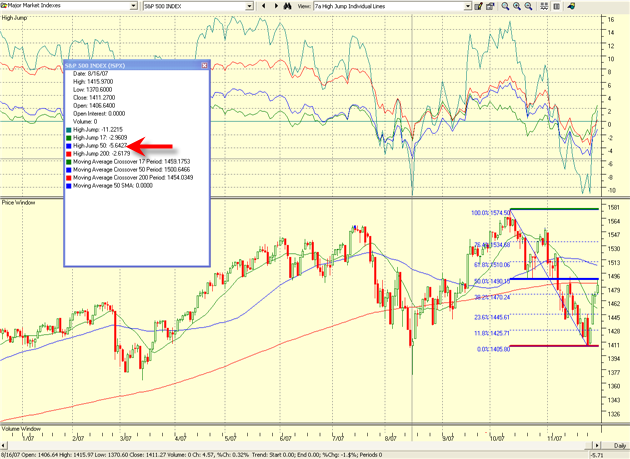
The Best Stakes in the Ground at this stage is the Base Low and the 50-dma, and hence the best measuring tool is the High Jump, or in this case the Limbo Bar or Low jump…since the Index is below the 50-dma.  At its extreme this measured -5.64% and was the lowest it had been since it recorded -4.36% on 6/14/2006.  That in itself should indicate that the Index had a significant challenge to get back above the 50-dma, especially as the Index had also broken the 200-dma by -2.61%.  My point is that even with a powerful move back up it would be too far to come back to break through the 50-dma to produce a “V” bottom from such a low starting point.

high jump

From the first rally attempt off a Base Low to the start of a pullback is for nimble day and swing traders.  It gives the best gains in the shortest timeframe but has the highest risk.  It usually lasts 5 to 8 trading days.  It is when leaders for the anticipated rally to come define themselves.  However, it is also the period when those same leaders will invariably correct, before moving on to become the true Silverback Gorillas for the move.  Stocks like GOOG, AAPL, RIMM, GRMN, FSLR, POT, MOS, BHP, SIGM and BIDU become the stocks with halo.  These are the types of stocks one should find at the onset for the best longer term ride.  Likewise favored Wolf Packs also emerge.  It started with the Energy Alternatives (way earlier), followed by Chemicals – Specialty, Transportation – Shipping, Chinese Silverbacks, and what we dubbed as Gorillas in general as exemplified by the Gorilla RonIandex. Understand that at this stage of events there is a balance between Fear and Greed.  Since this is at the end of a long bull rally that started back in 2003, the likelihood is that the length of the move would not be more than two to four months.  The longer you wait, the less the reward, the quicker you move in the more the risk.  Only your stomach can tell you your risk/reward preference, and you must best decide when to make your move:

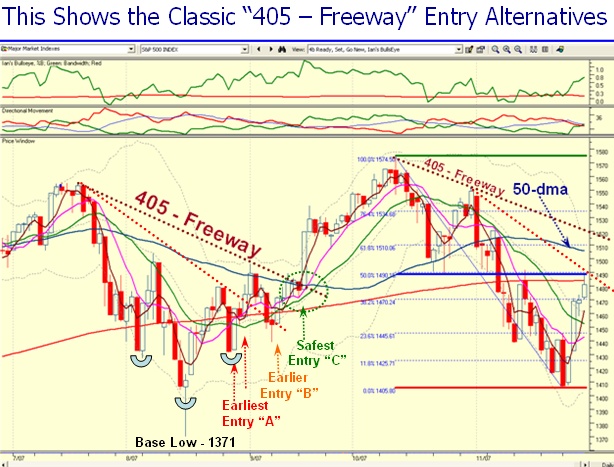
  1. Leg 1. The Earliest Entry off a 405-Freeway is on the “Follow-through Day” ANTICIPATING a breakout above the steepest downtrend line shown in red.  Alternatively wait for the Index to break up through as shown by the second red arrow.  The longer you wait, the more the risk of the next pullback.  By now the Index should be close to the 50-dma, so the expectation is that it will correct due to the resistance at the 50-dma.
  2. Leg 2. The orange arrow shows the next entry point where one is again ANTICIPATING the breakout above the 50-dma and the latest 405-Freeway downtrend line. 
  3. Leg 3. Finally the Safest Entry is the actual breakout above the 50-dma as shown by the green arrow, but if the rally is short half the opportunity is lost – note the distance from the breakout to the top at 1575.  By that stage the leaders are long since gone and one played these and second string up and coming stocks on pullbacks.  Also the Earnings Reports were out in droves by then and there were new stocks making their mark. 

The question now is “How do we apply all these tenets to the current situation?”  We can immediately see that the Limbo Bar results are much the same as before with a reading of -5.25% and -3.65% for the 50-dma and 200-dma readings, respectively.  We have four days up in the rally, and the S&P 500 Index is just below the 200-dma.  The challenge it faces is to break through both 200-dma and 50-dma.  Note also that the 17-dma is still facing downwards and that has to reverse itself if and when the rally continues. 

HJ 2

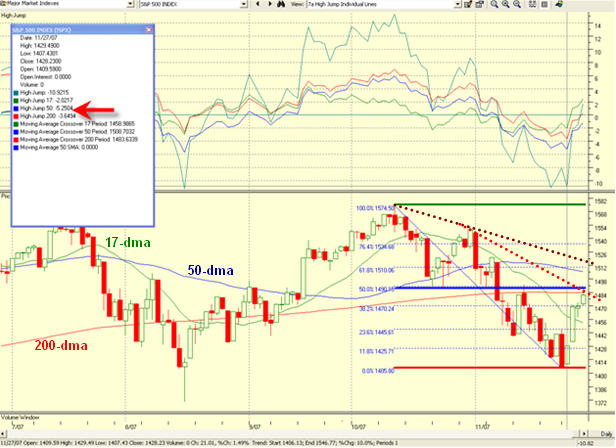
Essentially the first leg is complete and sooner rather than later we should expect a pullback and then comes Legs 2 and 3 through the two dotted lines representing the 405-Freeway downtrend line from the highs as described above for you to decide at what stage you tip-toe back in.  Whether the Index pushes through the dotted red line early this coming week before a correction remains to be seen, but unless there is tremendous new news the odds are that there will be a pullback between the 200-dma and 50-dma, before we push through the top resistance line of the 405 – Freeway. Realize that we have the FOMC on our side, but the Technology stocks and especially the Internets seem to have gone sluggish with more defensive Industry Groups as Healthcare and Utilities showing signs of life.  

In summary, after at least an Intermediate Correction, expect three legs up before the final push through the 405-Freeway, with a “V” bottom, a “W” bottom or an Inverse Head and Shoulders formation.  Look for the follow through day either by way of a Eureka signal and/or the normal strong follow through day once the bounce play is initiated.  Keep an eye on the relationship of the Index relative to the 17-dma, 50-dma and 200-dma and the extent of the Limbo Bar readings to make the call of when to act.    Now let’s hope the fun begins on our way to a Santa Claus Rally…but at least you are prepared for any eventuality north or south of the 405 – Freeway!  Best regards, Ian. 


Copyright © 2007-2010 Ian Woodward
Disclaimer: Commentaries on this Blog are not to be construed as recommendations to buy or sell the market and/or specific securites. The consumer of the information is responsible for their own investment decisions.