Ian Woodward's Investing Blog

Archive for the ‘Market Analysis’ Category

Stock Market: Late Breaking News…Watch QQQs

Tuesday, April 15th, 2014

My good friend, Phil Deane, from across the pond in Jolly Old England sent me this picture of the action in the QQQs today.  Many of you know him as he has attended our seminars and made valuable contributions.  His comment is at the top.  I added the thought at the bottom as this was certainly some reversal day!  I couldn’t help but share it with all of you, but it might just be wishful thinking after all the turmoil these last few weeks:

News Picture

Keep your Powder Dry!  Best Regards,

Ian

Stock Market: Time to Protect Your Nest Egg

Friday, April 11th, 2014

This is just a quick follow up to the previous notes as things are getting a trifle messy now:

Nest Egg Picture

Nest Egg Indexes

Here is a snapshot taken almost five months ago when we were breaking through round numbers:

Nest Egg Indexes2

Well, I called this one right and now we are into Nail-Biting time:

Nest Egg Nasdaq

Best Regards,

Ian

Stock Market: Preparing for Big Shoe to Drop

Wednesday, April 9th, 2014

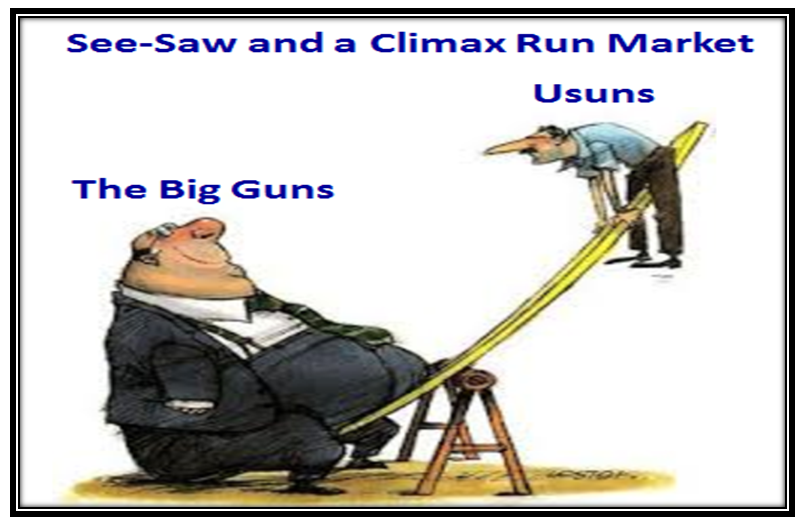
For the past month the Big Guns have yanked our chain with this Wibbly-Wobbly Market, and it is time to at least plan for a sudden Knee Jerk to the Downside to see what are reasonable Targets.

Big Shoe Picture

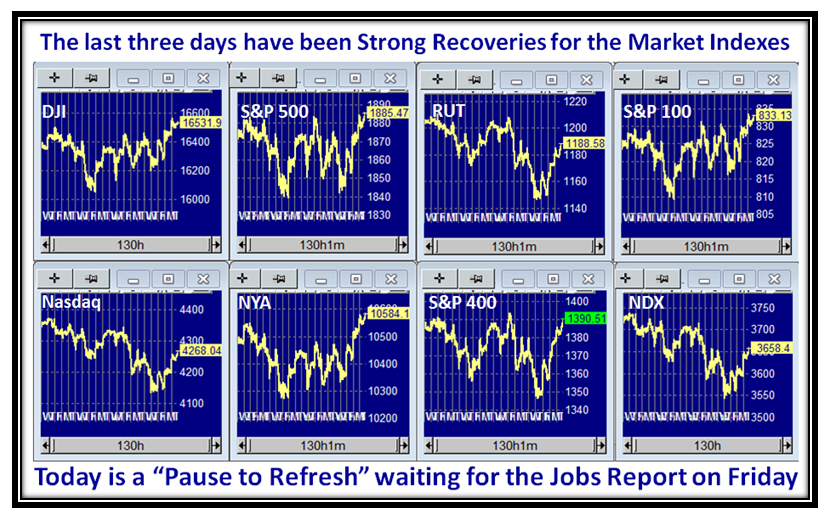
The quality of a Bounce Play after a dip will invariably give us a clue of the shape of things to come, and frankly today’s efforts as I write this before the Market closes has been especially strong in the NASDAQ, the NDX and the RUT which were the weakest of them all.  It pays at times like these to be prepared with some downside Targets so that we are not taken by surprise as it is the Capitulation that invariably does the most damage to our Nest-Eggs:

Big Shoe Emotions

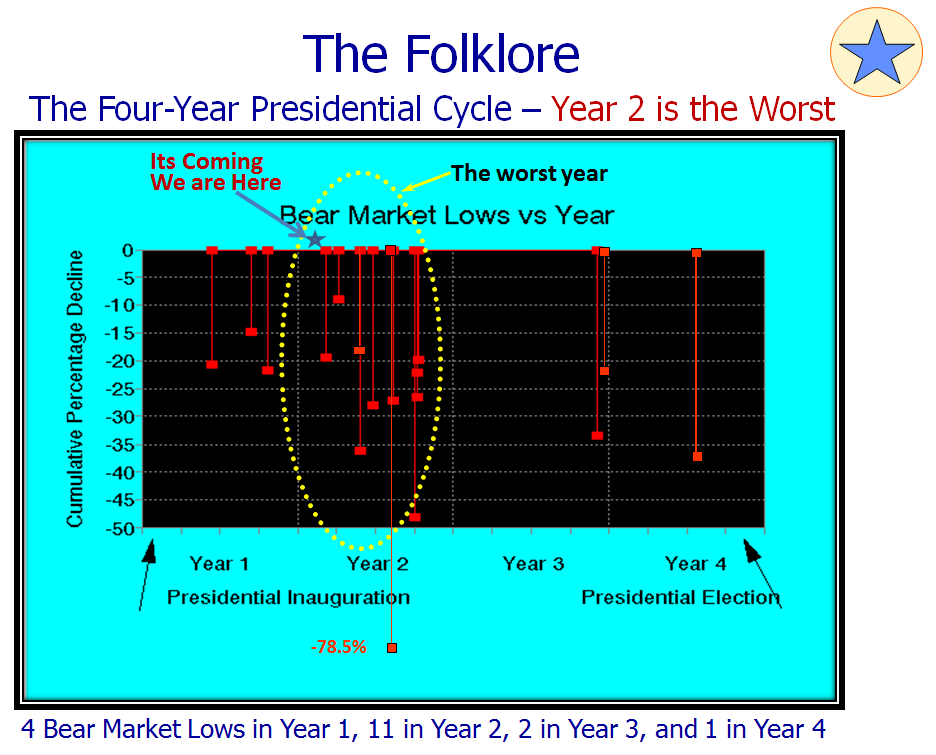
It always pays to understand the Folklore of the Four-Year Presidential Cycle, where Year #2 is invariably the most vulnerable and susceptible to Big Corrections.  There is no knowing when the big drop will come, but we have now been over five years since the big drop in 2008 and we have not had even a 12% intermediate correction these past 15 months, so we are due for one sooner rather than later.  Meanwhile, this has been dubbed a “Fed Cat Bounce” and you know the slogan of “Don’t Fight the FED”, so play along until things peter out once again:

Big Shoe Folklore

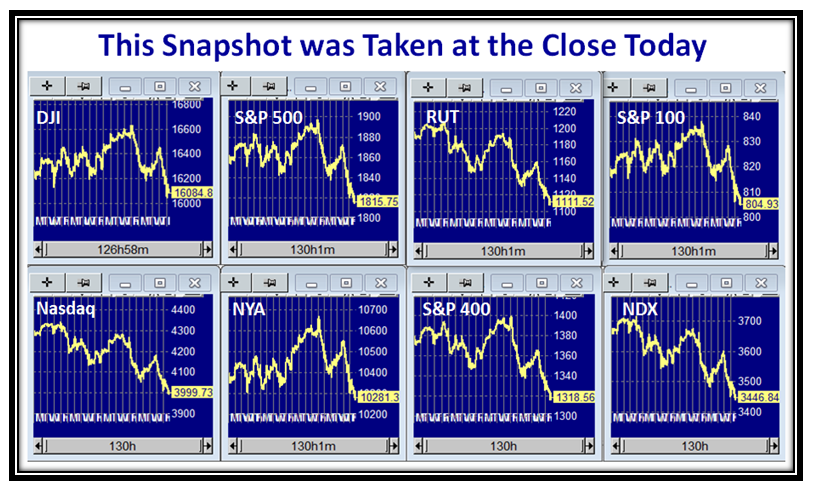
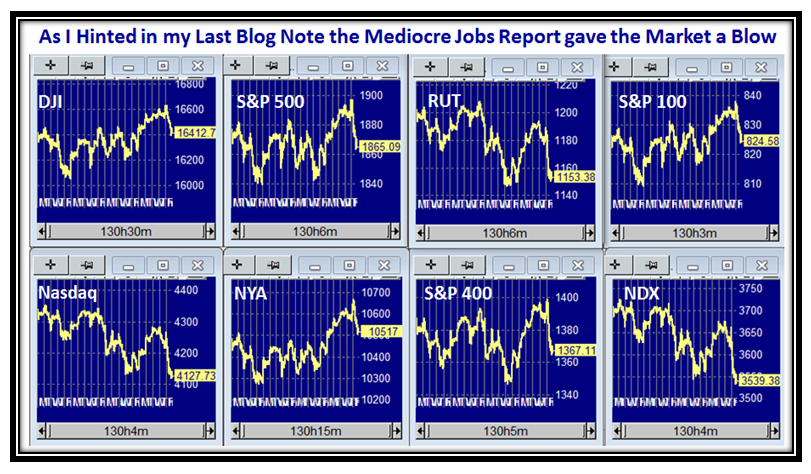
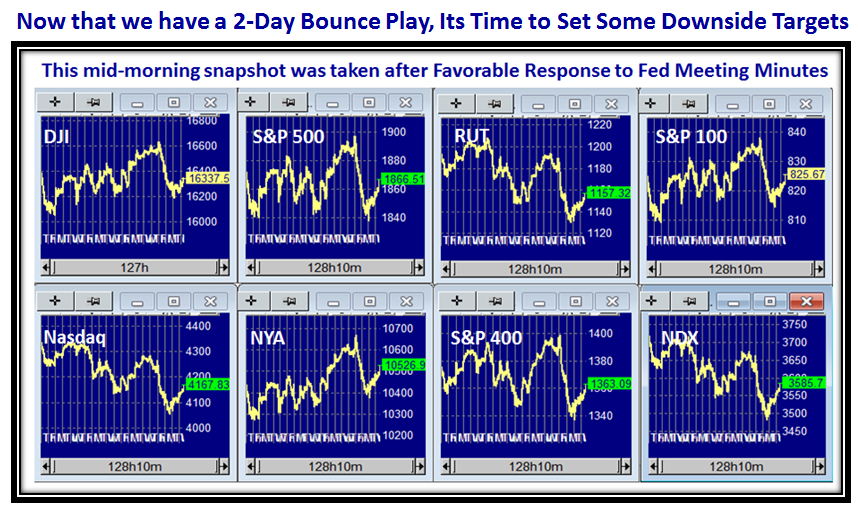
To show you what I mean about the influence of the Fed, here is a snapshot I captured earlier today when the Indexes all started to bounce after the Fed Meeting Minutes were announced, so we have a Fed Cat Bounce:

Big Shoe Indexes

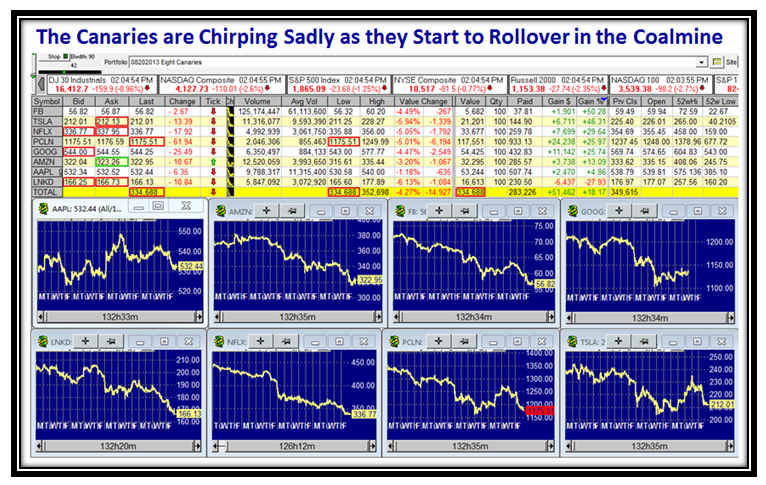
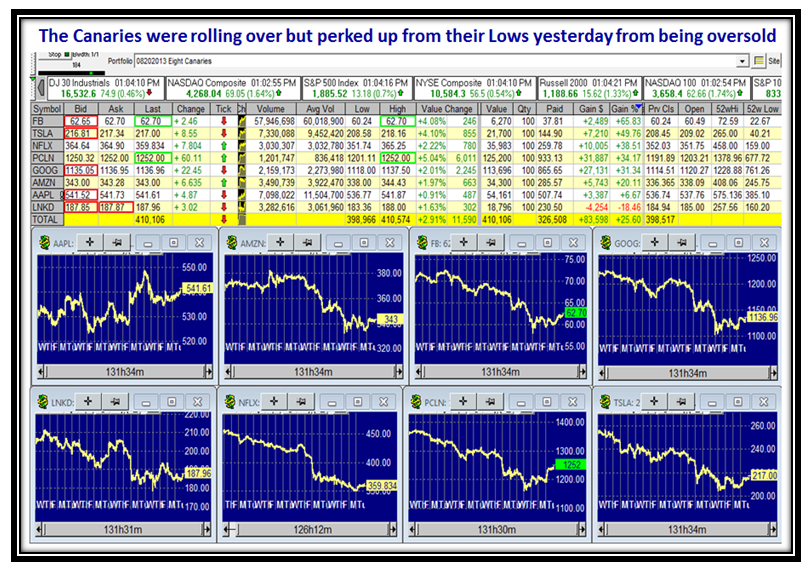
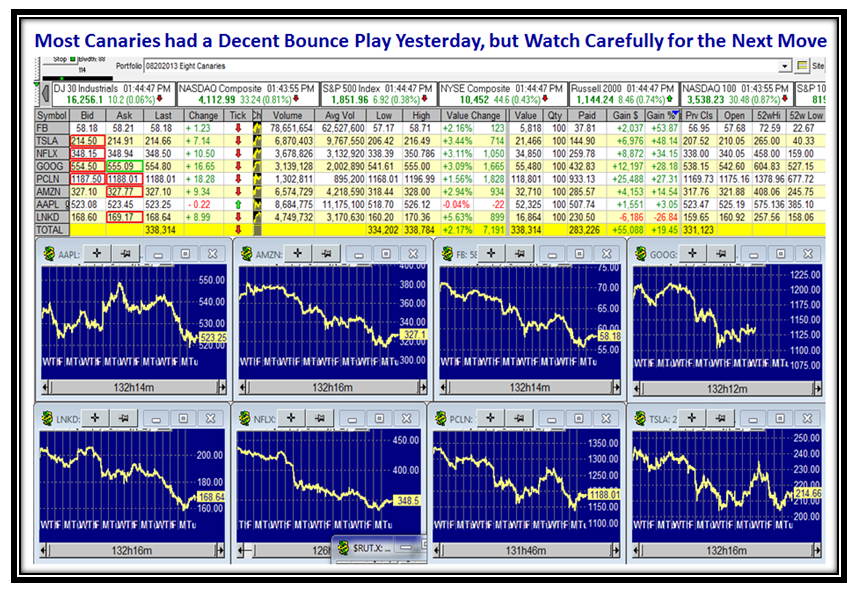
…And here are the Canaries Chirping back again two days ago and again today (not shown), so more things to watch:

Big Shoe Canaries

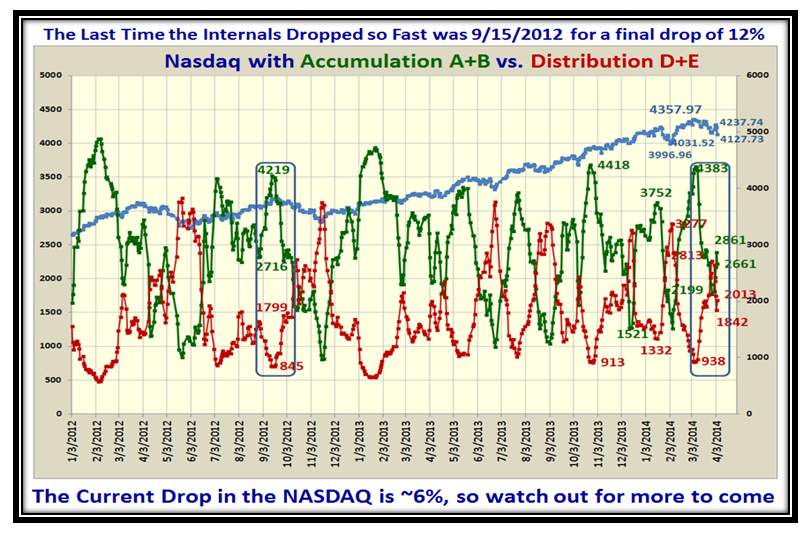
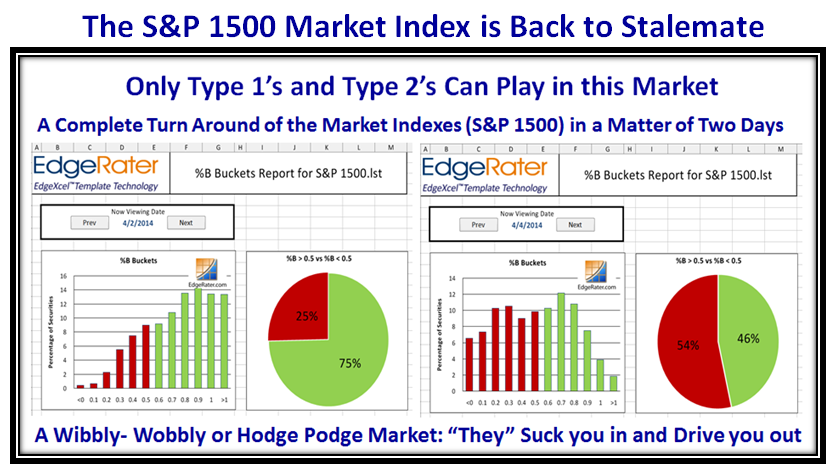
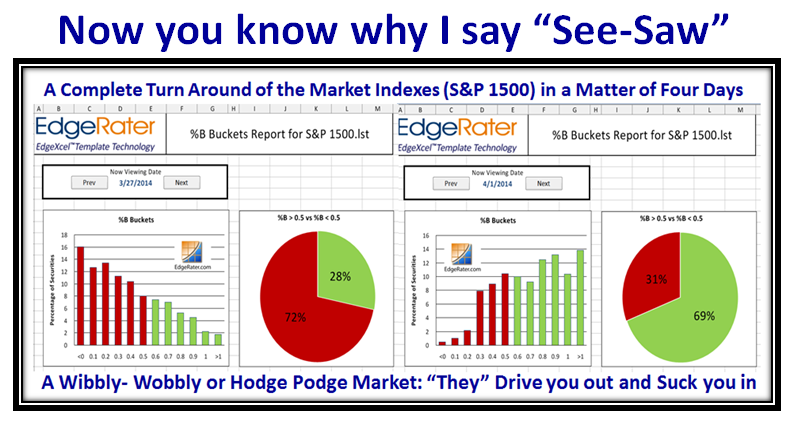
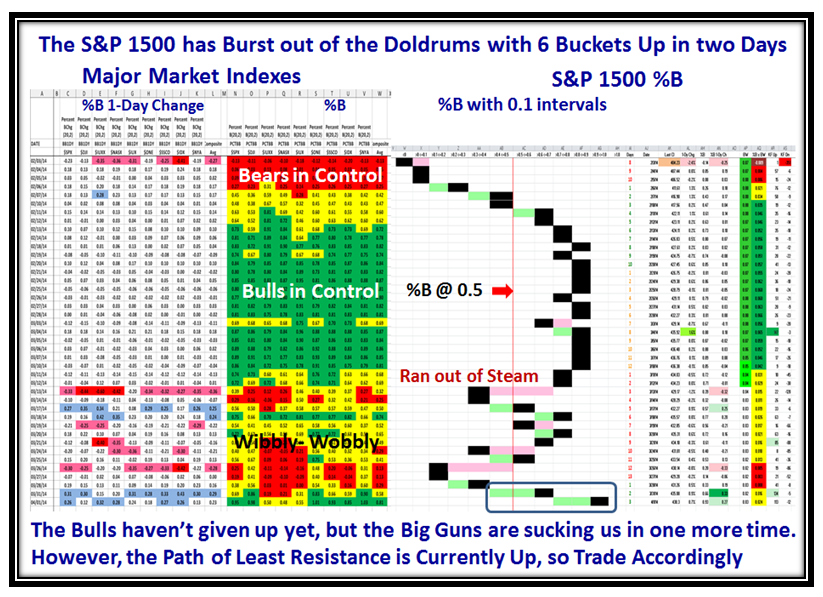
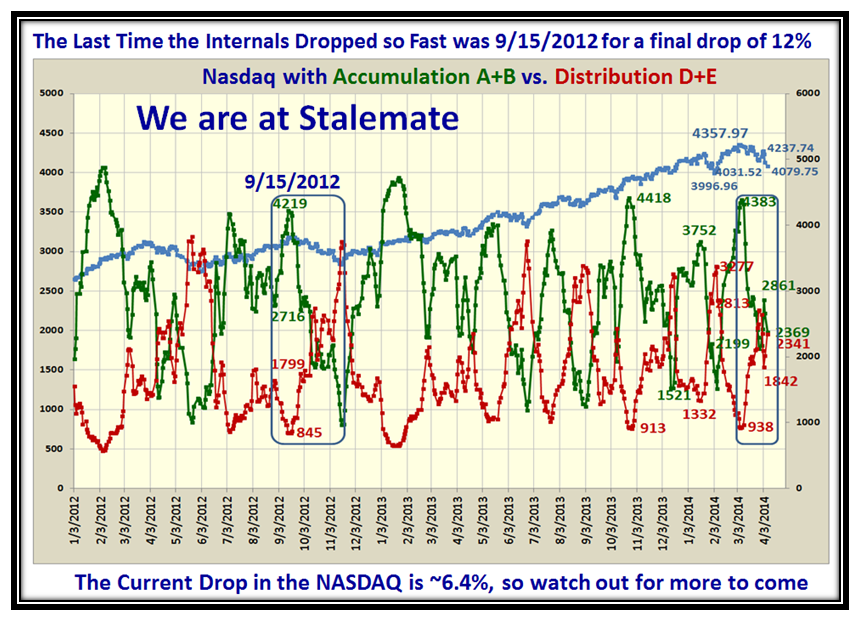
We are back at Stalemate on the Accumulation vs. Distribution Ratio as of last night:

Big Shoe abcde

My job is to stay ahead of the game and at this stage to give you insight of the Targets for the downside, but there is absolutely no panic yet, as with today’s bounce all of the Indexes are back into safe territory from their highs:

Big Shoe No ROT

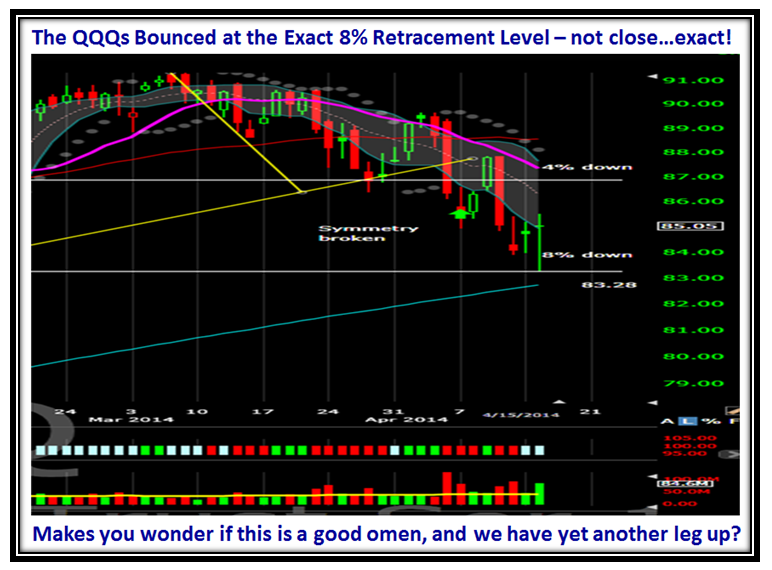
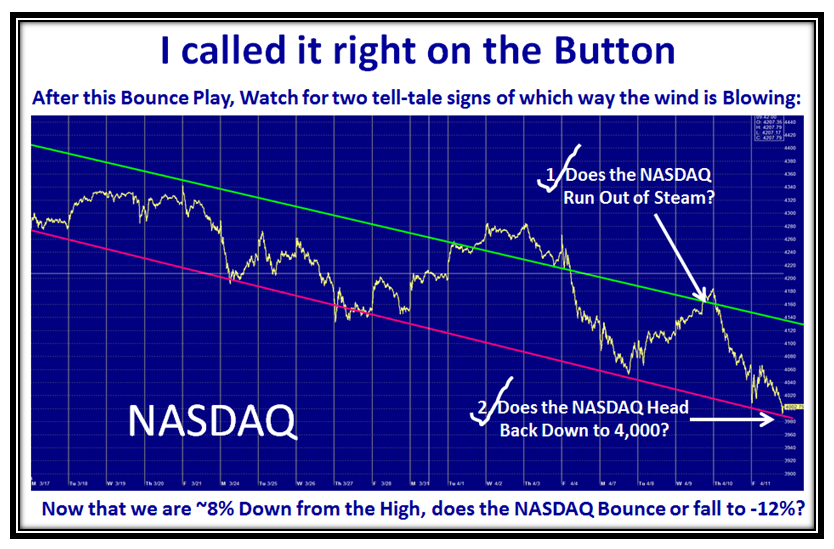
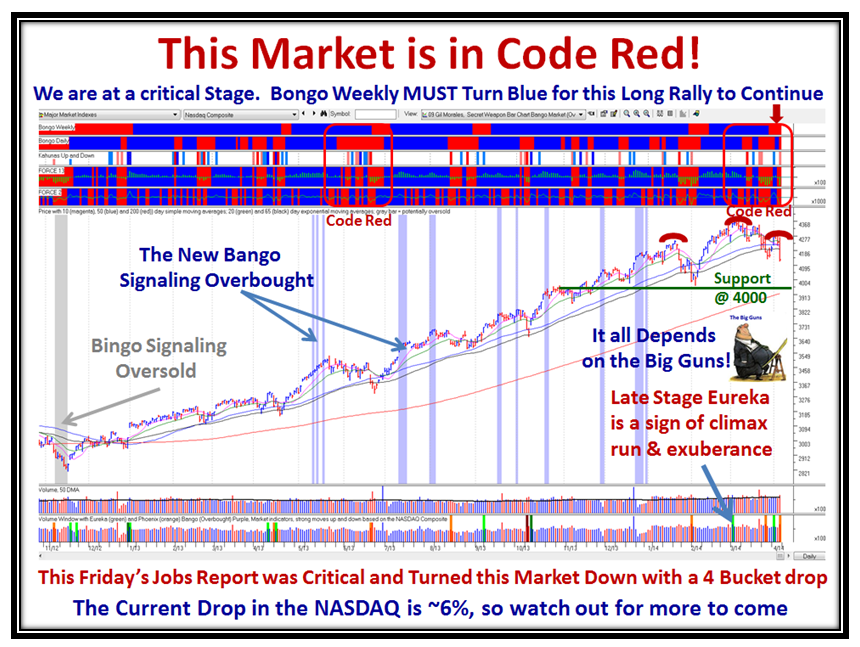
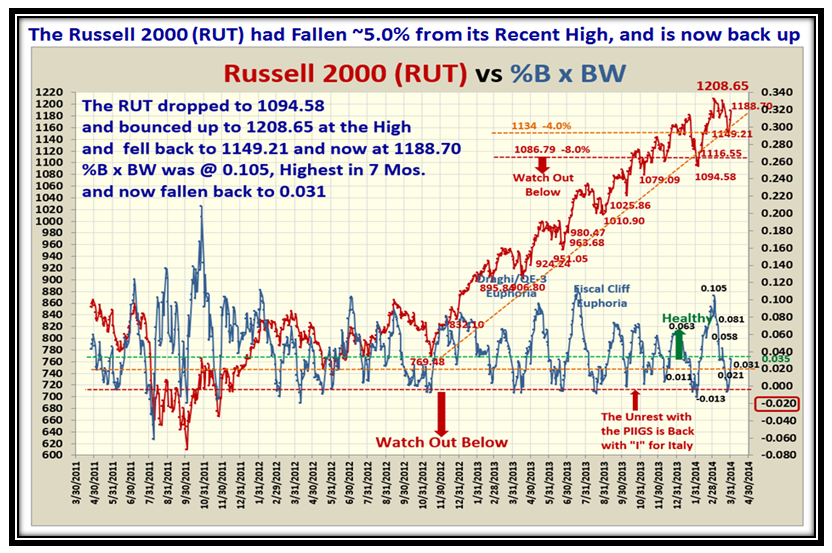
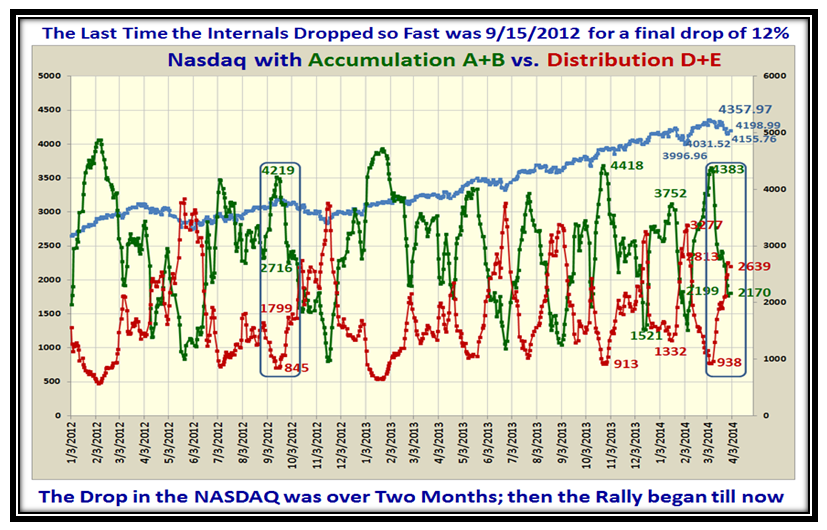
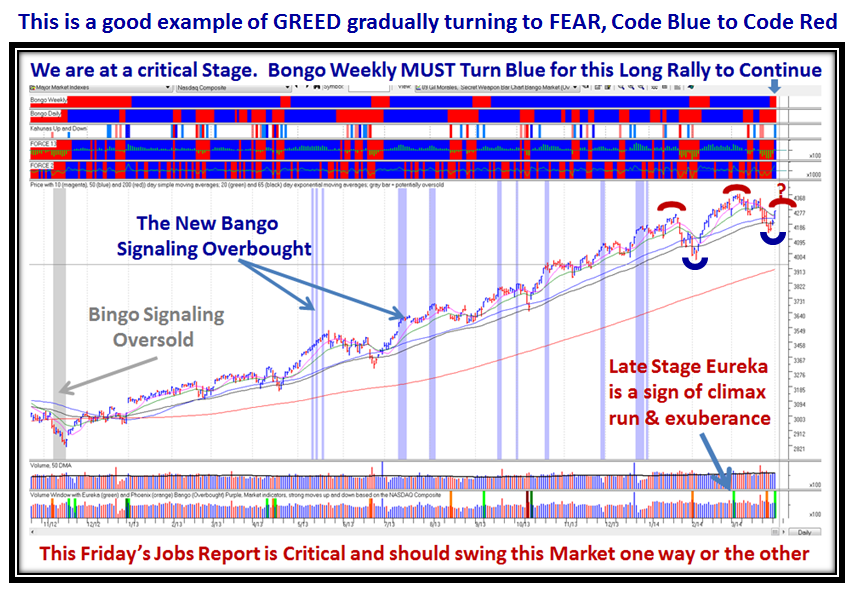
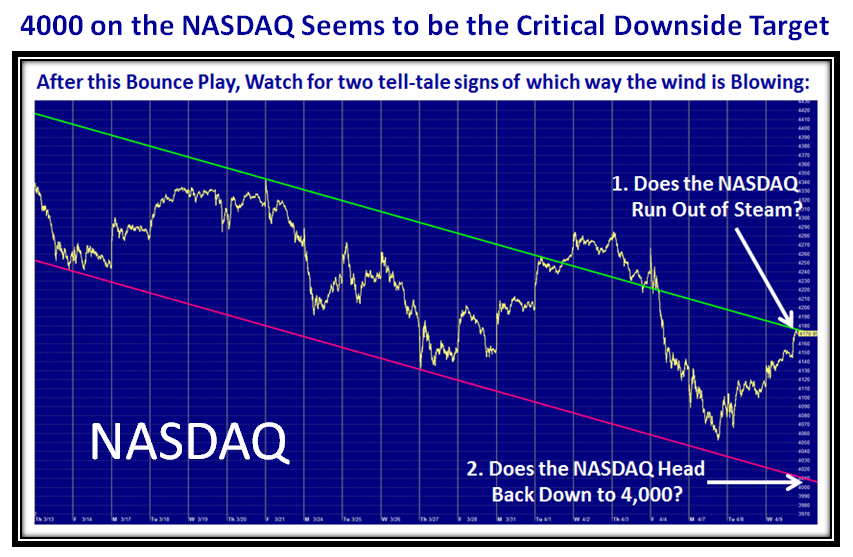
Once this Bounce Play is over, watch for the next downward thrust and the two items I list is what you need to watch for.  Ron, my partner, has mentioned 4000 on the NASDAQ as the critical target to watch and here is the picture:

Big Shoe Nasdaq

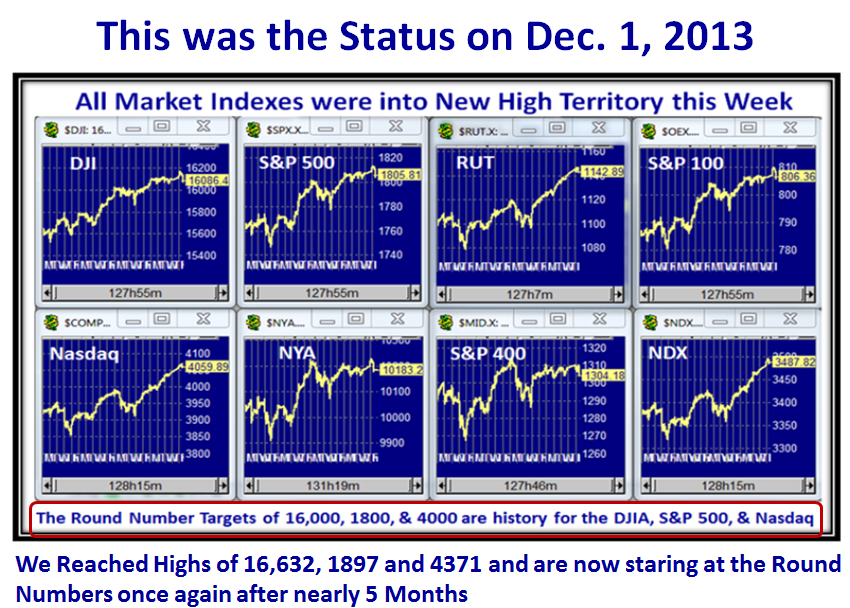
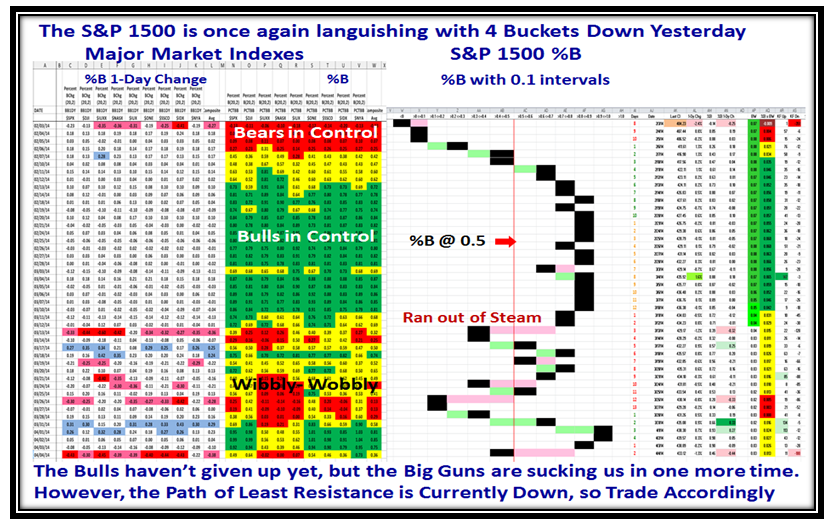
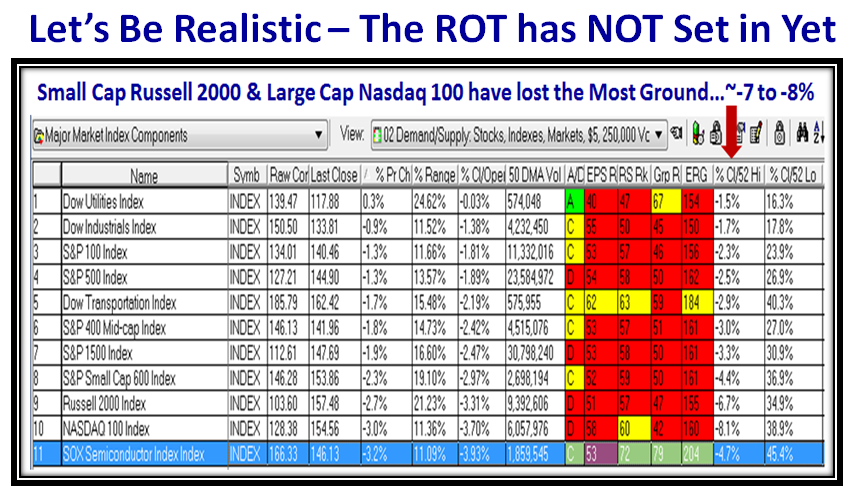
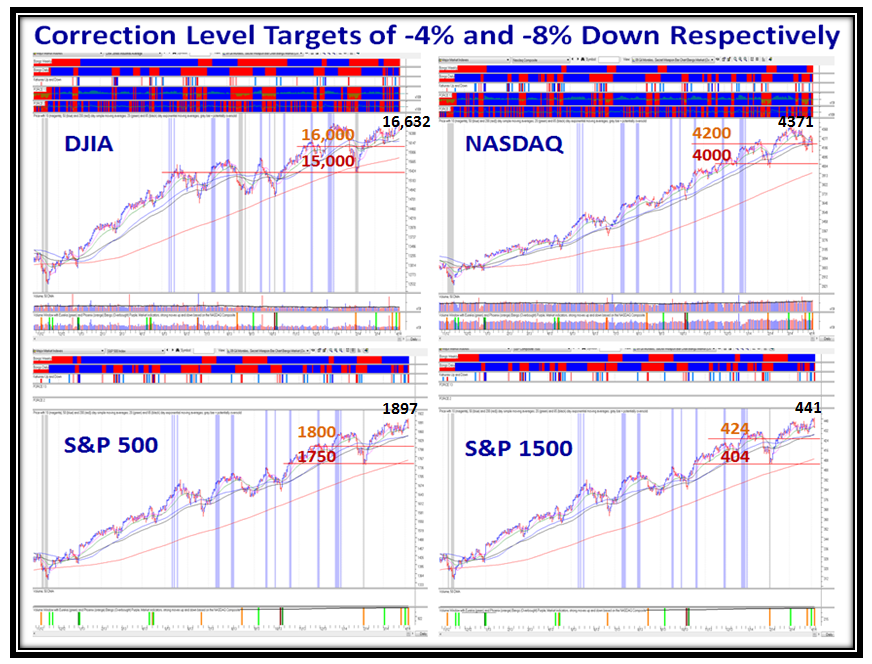
…And here are the rest of the Targets for you to keep a beady eye on, and to act accordingly:

Big Shoe targets

Stay Safe and Keep Your Powder Dry!

Best Regards,

Ian.

This Stock Market is in Code Red!

Sunday, April 6th, 2014

I suggested in my last Blog Note that a mediocre Jobs Report would send the Stock Market into a tizzy and head down, and that is what happened with most Market Indexes down 4 Buckets.  Another day like Friday and the Bears will have full control, and you and I will worry about being trampled at the exits, and saying “Coulda, Shoulda, Woulda!

Code Red Picture

We have had fifteen months of ambling along with the Jobs Report numbers, and unlike last month where the Market felt they were good, we got a trouncing for being essentially at Stalemate.  Here are the numbers for 2013 vs. 2012 and then the first three months of this year compared to last year:

Code Red Jobs1

Code Red Jobs2

Here is the picture of the Market Indexes over the past month, which shows they have been struggling:

Code Red Indexes

Needless-to-say the Canaries took a beating and are rolling over from their highs of a month ago:

Code Red Canaries

The Accumulation vs. Distribution Ratio bounced up to 2861 vs. 1842 and has slid back to 2661 vs. 2013:

Code Red abcde

After the 4 Bucket down day on Friday, the path of least resistance is down once again:

Code Red Pat

…And Grandma’s Pies show the instability with the S&P 1500 back to Stalemate in 2 days:

Code Red Pies

Here is the chart that summarizes it all and shows you why the Market is currently in Code Red!

Code Red Gil

Have a Happy!

Ian.

Stock Market: See-Saw and a Climax Run Market

Wednesday, April 2nd, 2014

I am back from an exhilarating and exhausting three day seminar at Sunny Palos Verdes, and Ron and I thank all of you our supporters for a rollicking good time.  The Newbies now know how to read my blog and the winky-winkies I give from time to time.  The first Picture chart usually spills the beans of what I think:

See-saw Picture

Unlike last Month where the Stock Market reaction to the mediocre Jobs Report was surprisingly good, this month’s report due on Friday should give us a better indication of the health of the economy here in the USA.

See-saw Indexes

Here is the performance of the Canaries which have essentially rolled over from their highs, but are still hanging in there:

See-saw Canaries

The Russell 2000 (RUT) suffered about a 5% loss from its high, but true to form turned up once again.  Before it breaks that trend-line hard is when we should all run for the hills and that should be when 1000 is broken to the downside:

See-saw RUT

We are now at that Critical Juncture I warned about of at least a 12% Correction since the Acc:Dist ratio is below 1.0 (Stalemate) and now we wait to see if there is a gigantic recovery in the Internals of the Market or it gently fades away:

See-saw abcde

Grandma’s Pies says it all…a complete turn around of 6 Buckets up in a matter of four days.  Now What?

See-saw Pies

The Path of Least Resistance is up, so play it that way until you get another Knee-jerk down.  Counting today, we are now into Day 4 of Twelve Drummers Drumming, so keep a beady eye on that count:

See-saw Pat

Here is nice new chart to digest, which shows the critical signals we have had in the past few weeks that tells the story:

See-saw Code Blue

Well, that’s it for today.  Keep your powder dry and your nest egg whole is job 1!  Write a comment to give me feedback.

Best Regards,

Ian

Copyright © 2007-2010 Ian Woodward
Disclaimer: Commentaries on this Blog are not to be construed as recommendations to buy or sell the market and/or specific securites. The consumer of the information is responsible for their own investment decisions.