Ian Woodward's Investing Blog

Archive for the ‘Uncategorized’ Category

Stock Market: Happy New Year for 2013

Tuesday, January 1st, 2013

Happy New Year to all my Supporters around the Globe…I felt you would like to see how we celebrate the New Year here:

New Year Picture

…And good wishes to my friends in Qatar as representative of those who tune in around the globe:

New Year Qatar

New Year FC

My Last Blog suggested we need a Miracle to get out of this mess, and true to form we got a Miracle yesterday:

New Year Indexes

Note how difficult it has been for even short term traders to stay on the right side of this Yo-Yo Market:

New Year Pat

Five Buckets Up in one day is a “Rare Beast”, but that is exactly what we got…it has happened just seven times in 12 Years:

New Year Pat2

The Net Result is that the Bulls are back in control, but note the one-day change in Grandma’s Pies, which is up 28%:

New Year Pies

Everything hinges on what transpires in Congress in the next few days as to whether we have a Strong January Effect or not as we are at Stalemate on the Average %B Oscillator for seven Market Indexes:

New Year Osc

All eyes turn to Congress as they will vote tomorrow on the Bill provided by the Senate and that will dictate whether we continue the Bounce or fall back into the Dumpster:

New Year Congress

Good Luck to us All!

Ian

Stock Market: What Goes Around Comes Around!

Sunday, December 16th, 2012

On this quiet Sunday as we mourn the loss of all those innocent people in Newtown, I turn to happier times when my friends around me over the years have given me a helping hand to help you help yourselves.  My Global Supporters are a trifle starved for new information, and so this Blog Note contains concepts and charts they have probably not seen before, and is my way of thanking my friends for the gems they have given me which include work by McClellan and of course, Bollinger.

Thank heavens we have come down to the last two weeks before this Fiscal Cliff mumbo jumbo is resolved for better or worse, and so I am reminded of the Days of Wine and Roses and also those of Whining and Sniveling:

So, let me pluck two charts which my good friend Mike Scott (Aloha) conjured up many moons ago, one of which tips our hat to Sherman McClellan and his son:

It goes without saying that RIGHT NOW we are Marking Time at the Pivot Point of Bouncing Back or Trotting Down once again as this next chart shows using the NASDAQ Market Index:

The above chart is dedicated to all the friends I have made who are supporters of the HGSI Team over the past 14 Years and to those who were with me at Telescan for the previous six years…time flies when you are having fun and meeting sincere people who help each other.

…And here is the latest Gem from Dr. Robert Minkowsky who has added icing on the cake of John Bollinger and my work with the two examples I show below for the first time hot off the press.  We are almost into the start of the January Effect when the Small Caps like the S&P 600 and the Russell 2000 (RUT) bloom through the first week in January and so I chose these two examples to showcase his work:

I will be discussing the fruits of these charts at the Roundtable on Tuesday afternoon, but suffice it to say that we are at a critical juncture where we either stop the skids and rebound or trot on down into the abyss which would imply that the Market did not react favorably to the Fiscal Cliff News eagerly awaited.

Although this is new work, it has great promise on several scores:

1.  The charts show that we have normalized the %B Readings to swing using Standard Deviations

2.  Options Traders will get excited as they use Std. Devs. in their work

3.  The Movement is magnified and rapid between Tops and Bottoms with hesitations in the 0.5 to -0.5 area

4.  Short Term Traders should love this stuff as Tops > 1.5 Std. Dev signals time to look for a move down

5.  Likewise, look at the sharpness of the bottoms to identify when the Market is about to go up

It won’t take long to wait to see the results based on the two conditions I have given you to look out for.

Remember, that’s what friends are for…what goes around comes around!

My Deep Appreciation to you all in the Autumn of my Years,

Ian.

Fishing for High Growth in Your Portfolio

Friday, February 3rd, 2012

I have done this Stock Market Blog for nearly five years and hope that those who fish in my pond have felt that over the years I have kept you on the right side of the market, helped you GROW your Portfolio and 401K with my ideas, and have given you the key warning signs to protect your Nest Egg in understanding Fear and Greed.  In essence Ron and I cover High Growth Strategies be they for Growth, Value, and Dividend Investors, with a prime emphasis on which way the wind is blowing in the Market Indexes.

With that preamble in mind, I have also shown you the value of using two Software Products which I use and have recommended by example after example in these blog notes.  This Blog Note shows you that  we are again at a critical juncture in the Market, and how to use the tools to your best advantage right now, especially when the examples in recent blog notes are fresh in your minds:

Talking about “Fishing” I have shown you a tool to fish for up and coming “New America” companies that become the lifeblood for continuing the growth of this country, which have a balance between strong Fundamentals and yet are in the early stages of their growth.  Those who use the HGS Investor software know it well as the Nine Box Matrix, and particularly those that meet the requirements for Strong Earnings Growth and Revenue of over 100% in the last two quarterly reports, known as Box 7 Stocks.  Better yet, these are the very stocks that invariably will enrich your Portfolio.

You will recall that the week before Christmas I gave you a long list of Box 7 stocks to keep a Beady Eye on which might help to make your Portfolio Grow and here it is posted from the Dec. 22nd, 2011 Blog note.

You will note that the list used equal lots of 100 shares each for me to keep it simple.  It would be different for Equal Dollar Weighted.  So let’s see how this bunch has performed since then, recognizing of course that the Market has been kind to us during this period, but none-the-less delivering a respectable 15.61% in a matter of 7 weeks, and up 9+% since I posted the note…if you had the temerity to take them all!  That’s more than many make in a year in their Portfolios.  Now if you were good at Technical Analysis which I assume you are and know when to buy and sell, just look at the 25 stocks that made over 10% to 98%, you might well feel this process has VALUE as a Strategy in providing High Growth to your Portfolio.

Don’t forget to either click on the chart or change the % of the view at the bottom of your Internet Explorer to get a bigger picture.  Now those who have seen me time and again use the High Jump Tool to assess “Greed and Meltups” when the market is getting “Peaky” will recall that just a week ago I gave you the “High” Targets, again a tool found only in HGSI:

This time I show you how to raise the bar as the Market rises, the Greed turns to Irrational Exuberance, and to assess the next level of Higher and/or Highest based on past expectations.  This work of mine helps you to understand “Greed and MeltUps”:

This chart was done yesterday and with today’s explosive move we have not only had the Golden Cross I predicted as the High Road Scenario, but have already surpassed the targets for the first two conditions shown above for the “Highest” Targets from recent history over the past year or so.  Not only do I give you the “How To” do it, but also provide the expected results on a silver platter.

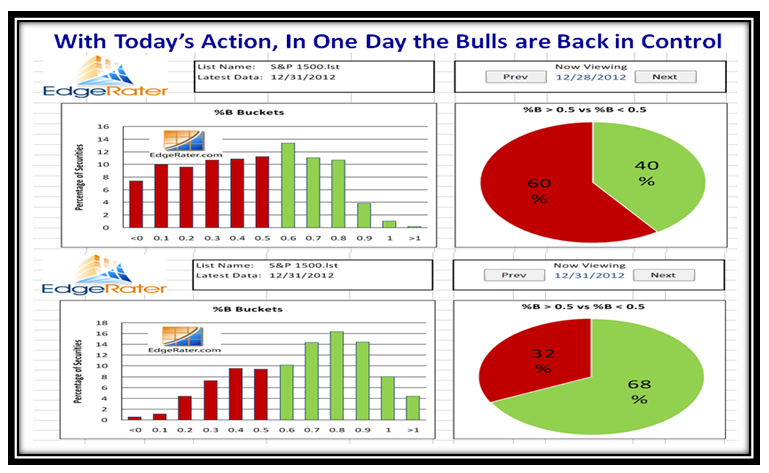
Having shown you only a smidgeon of the Value of using HGS Investor as your Analysis Tool, now let’s turn our attention to the other one I use, EdgeRater, which as you well know works hand-in-glove with HGSI and has provided me with the breakthroughs I feel I have made in using John Bollinger’s Indicators of %B and Bandwidth with a Woodward Twist!

Those who take Ron and my Monthly Newsletter were privileged to see my latest work of blending %B x BW into what my associates have dubbed the “Woody” Indicator and those who have both products are already reaping the benefits that is immediately visible.  Yes, I know that those who are good at “scraping” gems like this will immediately do so into their favorite programs, but over these past twenty years I have given generously of my research to help others help themselves.  Of course Ron and I expect some return for all the work we do by attending our Seminars and buying our Newsletter and many of you have supported us faithfully over the years for which we thank you.  However, in this day and age it is a fact of life that scraping is here to stay without nary even a Thank You!

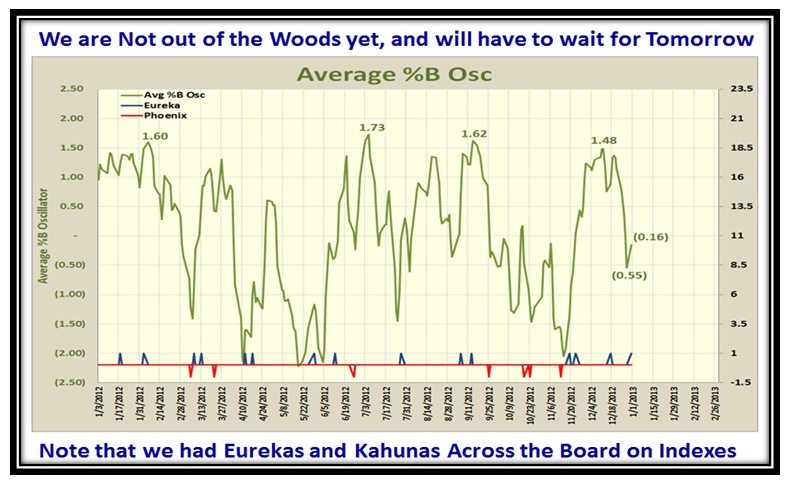
So now by any stretch of imagination the Market is Overbought and the key at this stage is to understand Fear and MeltDowns which is easy to figure out with what you see on this next slide, where I have given you the whole nine yards:

I see a lot of jabber on the HGSI Yahoo bb today about the TVIX and its value in hedging one’s Portfolio at times like these and I hope that those who are into this high risk good stuff will sit up and take note of how and when to get the best of both worlds BEFORE the TVIX takes off into the sunset:

If the cap fits, I will remind those who had promised me their third million that I am still waiting and maybe this goodie might tip the scales!

Now then…here’s a new teaser for you to ponder over when a market like this can take off into the sunset ala March 2003 and 2009, so don’t be asleep at the switch…more fun to come:

As I mentioned in my last Blog, we are holding a series of “Drip Fed” Videos that you can view at your leisure and we thank you for your enthusiastic response to our advertisement to help you help yourself.  I’m sure you enjoyed the one that Ron did a few days ago and also the introduction by Chris White to what I will do next Tuesday, so look out for that, or if you haven’t, you can still Register:

Please take a moment to register for the EdgeRater / HGSI mini-course below:

Register for the course

…And last but not least, if you like all you see, why not sign up for the Seminar on March 24 to 26 where you will get the whole nine yards:

Register for the seminar:

Register for the seminar

Best Regards, Ian

Three Road Scenario

Monday, January 30th, 2012

I see the tom-toms are beating and you are wondering what’s next, so building on my latest work here in a nutshell is the essence of the Three Road Scenario for the Stock Market based on the recent action and the anticipated announcement for a Facebook IPO, which has put the market into “Marking Time” or the Middle Road Scenario:

Those who get the newsletter and were at our usual Monthly Meeting know that I have struck oil with using %B x Bandwidth as what has now been dubbed the Woody Indicator by my associates.   But first let’s review the High Road Scenario with two slides that you are accustomed to seeing the status in a nutshell.  The first one needs no explanation and shows that although the Major Market Indexes are still mostly in their tramlines, there has been a slight pull back the last three days:

I anticipated a month ahead that the High Road Scenario would happen in Mid-February and we have two weeks to go, so let’s see if we make it:

For the Low Road Scenario, the VIX had broken below 19 as I showed in my recent blog, and as being awfully quiet, but since it dipped below the lower Bollinger Band, it is no surprise that it has begun to stir.  Better yet, for those who just want to know what to look for I have narrowed it down to a quick answer on the next two charts:

However, don’t count your chickens before they are hatched as it seems fairly obvious that the action of the last few days has been dampened by the anticipated annnouncement of the Facebook IPO, so although the VIX has begun to come alive, it looks like we have to wait for that event before we see any major push to the downside.  However, here is what to look for whenever the VIX takes off:

Now if you are wondering how to apply the Keep It Simple Strategy (KISS) approach to all of this, The HGSI and Edgerater team have put together a series of “drip fed” videos for you to digest at your leisure.  The series started on January 27, but over the course of the next couple of weeks you should find a plethora of information that you can view at your leisure so that you don’t have to be tied to watching the series every other day.  Here is a Sneak Peak that shows you that the latest Indicator I have conjured up of %B x BW will give you a Jail Free Card BEFORE the VIX gets hic-cups!

…Judge for yourself the lightening speed of %B x BW as it spies big movements in the VIX to give the red alert when the Market is caving in:

Please take a moment to register below:

Register Here

Best Regards, Ian

Stock Market: Kahuna Cannons Volleyed and Thundered!

Thursday, June 2nd, 2011

With apologies to Alfred Lord Tennyson, there was a major shot across the bow yesterday, and I wanted to get a quick blog note out before the Jobs Report descends on us tomorrow morning, so that my East Coast friends can chew on this before the opening.

I think the charts give you a decent perspective of the turn of events and it therefore does not need any dialog from me, so I will just show the charts for you to digest and enjoy:

Many thanks to all who dropped me a line of support and encouragement.  Best Regards, Ian.

Copyright © 2007-2010 Ian Woodward
Disclaimer: Commentaries on this Blog are not to be construed as recommendations to buy or sell the market and/or specific securites. The consumer of the information is responsible for their own investment decisions.