A Happy New Year to You All!
Monday, December 31st, 2007
Wishing you all a Happy New Year from the HGS Investor Team…George, Matt, Ron and Ian.
 Ian Woodward's Investing Blog
Wishing you all a Happy New Year from the HGS Investor Team…George, Matt, Ron and Ian.

The weak Year-end Rally doesn’t bode well for the New Year and we come to the last day of trading with the Stock Market in the Balance and can go either way from here. All the Indexes are at critical junctures at or near their 50-dma, their 200-dma and at support or resistance lines. Is it any wonder that the two little fellows in the picture are asking each other if they are going long or short in this market? The Sectors that have outperformed this year are essentially defensive with Energy, Materials, Utilities, Consumer Staples and Healthcare leading and smatterings of Technology, Internet and Telecommunications Stocks more recently. Chemical Specialty and Energy Alternative Stocks have been outstanding and despite their huge gains will likely confound us and go up further. Stocks like CF, MOS, POT, TNH, TRA along with FSLR, JASO, ESLR, CSIQ and new found ASTI are all defying gravity. Technology Stocks which are holding up well are MICC, CRM, VIP, SIGM (recently pummeled but starting a come-back) along with the perennial favorites such as AAPL, GOOG, RIMM, GRMN and BIDU. The Steel Producers may be waking up again and that should mean that STLD, MTL, AKS and SID should continue to lead that group. Throw in ISRG, FWLT, PCLN, and we have a well rounded group of Leaders.
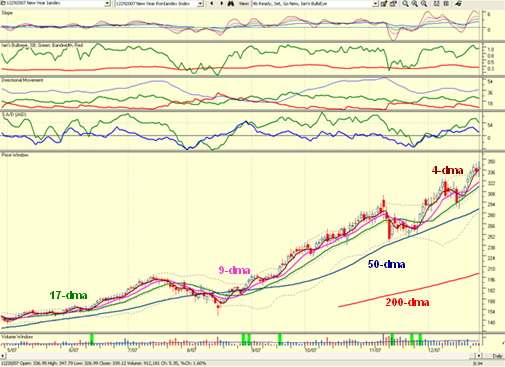
One popular theory often offered at the end of the year is that stocks laden with profits as these have provided over the year are held into the New Year before selling off to avoid Taxes in 2007 and delay them into 2008. I don’t subscribe to that notion, but for posterity sake I felt we should go out this year with our best shot at the RonIandex for 2007. If you haven’t seen Ron’s Year-end Movie which is out today I suggest you do so post haste. His focus on the Volatility Index (VIX) which as we well know has grown dramatically this past year and the “jumpy gaps up and down” these past three months demonstrates that this is a very tricky market and one must be extremely nimble and short-term oriented at the moment. There is no traction to show a continued rally or for that matter a steady decline. I have built on his ideas to develop a consolidated Index of this group of 26 stocks and we will see if they get hit hard or continue to show leadership into the New Year. As we can see the Index has risen above its 4-dma which suggests that the Index is healthy but over-extended. Note how this group has hardly come back to its 17-dma, but if it were to break it, it should show us there is rotation underway. I have brought back my Sherlock Holmes Character to show what you should look for on the third chart, where I expect the Index to emulate its past performance into the 3-std deviation area before it finally gives up the ghost. I have purposely included four or five stocks in the three groups of Energy Alternatives, Chemicals – Specialty and Steels, so that we should immediately see the rotation should that occur.
The 2008 New Year RonIandex: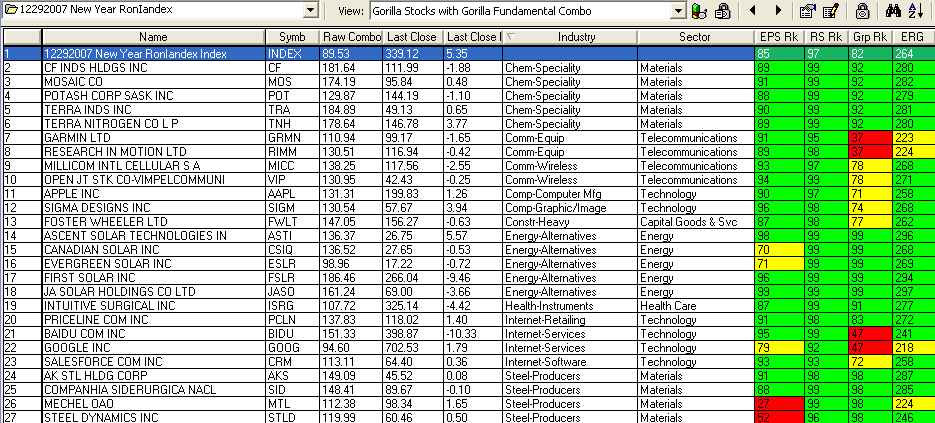
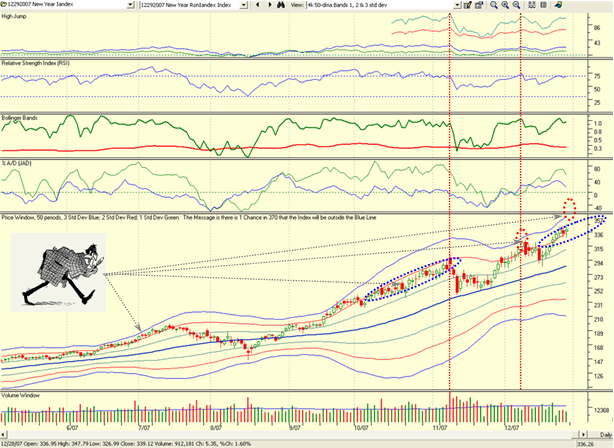
As Sherlock Holmes is showing you with his magnifying glass, we can see that ideally he would like to see the Index climb just below the 2-std deviation line (red line) as it did in the October 2007 timeframe (dotted blue ellipse), but should it stray up to touch the 3-std deviation blue line that will be a strong indication that the Index is way too extended and it would be wise to expect a correction in this Index. Happy New Year and Best regards, Ian.

There is frankly little to report of any significance or loud cheer this past week. Everyone is still buying up the bargains in the Malls at 6.00am in the morning and so there is little or no action in the Stock Market these last few days. Sure we had a tepid Santa Claus Rally, but now reality is setting in and there is little for the Bulls to cheer about. The Bears can already see that the rally is in the process of peaking and once again are licking their chops in anticipation of making money on the downside.
Technology stocks closed in the red as the sector reacted to a weaker-than-expected durable goods report and the overall market was shaken by news of the assassination of Pakistani political leader Benazir Bhutto who was killed at a political rally in the city of Rawalpindi. Before the market opened, the U.S. Commerce Department said that durable-goods orders rose just 0.1% in November. Were it not for strong orders for civilian aircraft, the durable goods totals would have fallen 0.7. The bottom line is that the DOW fell a whopping 192 points to finish at 13,359.61, and the Nasdaq was even weaker in giving up 47.62 points to close at 2679.79. In effect the Nasdaq today wiped out the gains of the last three positive sessions, and is now staring at taking out that huge gap down to 2640. I’m no soothsayer, but today’s weakness going into Friday tomorrow suggests we shall close that gap unless there is some startling positive news to prop it up.
I suspect that the Asian Markets will take a beating tonight which will add fuel to the fire for tomorrow’s session. Needless-to-say that with many still enjoying the holiday spirit the volume was down these last three sessions, but once the New Year’s celebrations are over we can settle down to full participation once again. The next important item on the cards will be the middle of the month when the first blush of Earnings Reports is due. Let’s take a deep breath, finish off the remainder of the Egg Nog and then get ready for a fresh year. Best Regards, Ian.

Santa came in on his sleigh, calmed the troubled waters for this past week and provided a bridge to the Santa Claus Rally and January Effect through glowing Earnings Reports from Research in Motion (RIMM) and Oracle Corp. Likewise, shares of Nike Inc. had their biggest gain in six months after the world’s largest athletic shoemaker posted a 10% rise in profit, led by gains in Europe and Asia. The Dow Jones Industrial Average
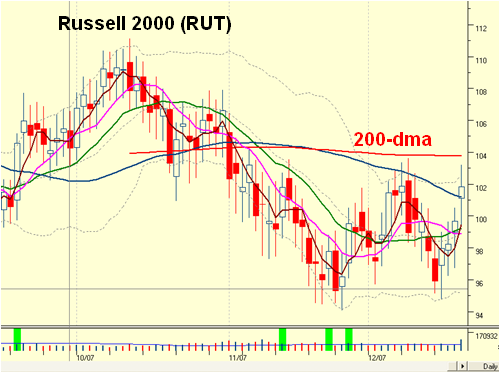
What should also stiffen the Bull’s backs is that the Small Cap Indexes such as the Russell 2000 (RUT) and the Small Cap S&P 600 Indexes had the best day on Friday and bodes well for a continuation of the rally into the January Effect. Note the following insights from the Chart of the Top’s Down Analysis that my good friend Ron Brown always uses in his weekly movies:
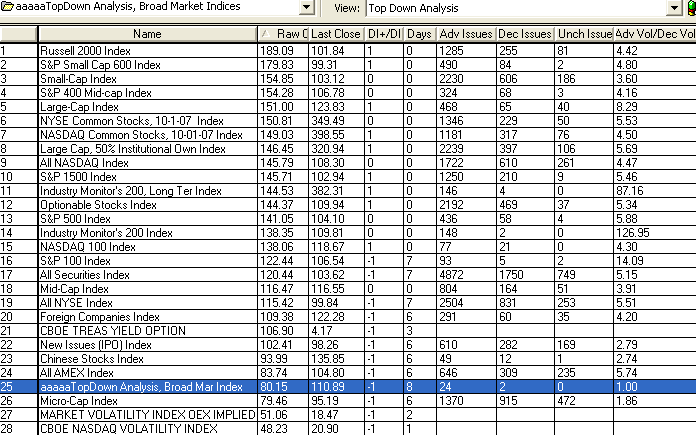
Please don’t misunderstand me in that the Large Cap Leaders are still leading…witness the explosive move naturally from RIMM. However, what I am suggesting is that if this Rally is to continue just make sure you watch the Russell 2000 for this next week or two to make sure the momentum is still fanning the January Effect. The RUT chart pattern is in a trading range and has been the weakest of most of the indexes, so it still has a ways to go to get above the 200-dma. However that is precisely what we need to watch to see if the momentum is strong enough to blow through that resistance or whether it will fizzle out as usual at or near the 200-dma. As you can see from the chart below, the 50-dma (blue line) is already below the 200-dma, red line which in itself shows how weak the small cap index is. If this Index blows through the 200-dma, that could give fillip to the entire market in the short term as the other indexes are a lot stronger.
Best regards, Ian.
Copyright © 2007-2010 Ian Woodward
Disclaimer: Commentaries on this Blog are not to be construed as recommendations to buy or sell the market and/or specific securites. The consumer of the information is responsible for their own investment decisions.