 Ian Woodward's Investing Blog
Up, Up and Away with the Bears in Dismay!
Since my last blog, I suggested that we might be “Up, Up and Away on a second leg of this rally”, and it looks as if that is in the making.

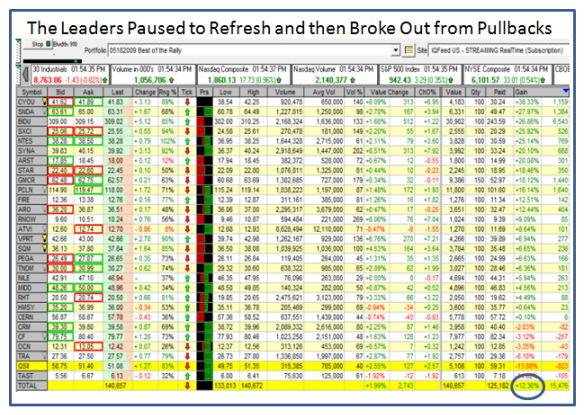
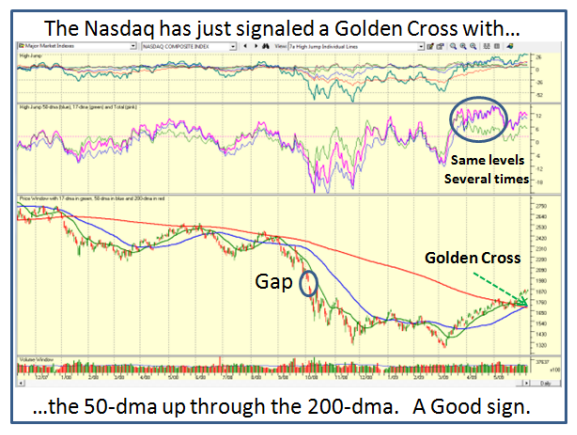
As Type 4 Buy and Hold Investors now fully know, they wait for a Golden Cross before they have some assurance that the Market has turned in their favor. We have been keeping an eye on the 50-dma crossing up through the 200-dma, and although the S&P 500, DOW and NYSE are still working their way to that goal, the Nasdaq 100 and Nasdaq have done it. That invariably bodes well for gathering momentum to the upside so it would be prudent to watch these two Indexes to see if they can make the next appropriate goals. I left you with a clue as to which way the wind was blowing by giving you some 29 Leading Stocks that had paused to refresh. That was three weeks ago and to make the point that bunch is up 12% as a group; so tuck that lesson away for the next time:
Before we get into next steps, you will also recall that I have left you with the Three Road Scenarios several times before now. The one most familiar to you would be the 840, 940 and 1000 Scenarios for the S&P 500. We are still wandering around the 940 level and are currently at 942.43, so 980 to 1000 is certainly within reach. This time I will show you what to look for on the Nasdaq, if we are to move up a further leg before we see a reasonable correction:
1. The High Jump comes into play at this stage
2. The Gap up between 1905 and 1947 presents a nice opportunity to close it
3. The Cushion to the support at the 50-dma or 200-dma is comforting at 10%
The higher it goes from here which is 1860.13, the better the cushion. Likewise, we
have only another 45 points to go before we reach the gap, so keep an eye out for
that vacuum to be filled if we get to 1905. That takes care of points “2” and “3”
above, so now we need to explore the High Jump.
As you well know, the High Jump has been a valuable tool when one gets extended
(overbought) or the reverse with the Limbo Bar for a Base Low (oversold). We use the % of the 17, 50 and 200-dma from the Index added together to give us the High Jump. Here is a trick I learned from one of my “students” many moons ago. Her name is Michelle Anvary and she alerted me that it is useful sometimes to use the 17-dma and the 50-dma only rather than all three items. This is particularly true when the sum of the 17-dma and 50-dma from the Index consistently reaches a similar level as shown in the chart. It pays to look at the highest reading of the 17-dma and the 50-dma during this period.
Given that the result for the standard 17, 50 and 200 High Jump is already higher than any reading during the past year, we have to go back all the way to the breakout of 2003 to see similar numbers. Instead of doing that (which I leave you to do as an exercise), we can zero in on the 17-dma and 50-dma combo to arrive at an estimate, as per below:
On 3/23/2009 and 4/30/2009, the Hi Jump readings for the 17-dma & 50-dma are 11.69% and 15.55% at their peaks, respectively. Applying those numbers to the current readings we get an estimate of:
a. 1.1169 x 1774.30 = 1982 for the 17-dma, or
b. 1.1555 x 1698.19 = 1962 for the 50-dma
So there you have it…three tests-of-reasonableness that suggest that this rally for the Nasdaq could have legs that can reach either 1947 (Close the Gap), 1962 or 1982 if it goes above 1905, which would be the normal resistance level.
The Ratio of S&P 500 to Nasdaq = 942.43/1860.13 = 0.5066
Target Nasdaq S&P 500 % above Base Low (667)
Current 1860 942 41.2%
Medium 1905 965 44.7%�
High 1947 986 47.8%
Higher 1962 994 49.0%
Highest 1982 1004 50.5%
The bottom line is that the original 840, 940 and 1000 Lines in the Sand were reasonable targets established months ago. We can get turned back here at the middle road scenario in which case we have a 10% Cushion to Support at the 50 and 200-dma, or go on to strive for 1000 on the high road scenario.
Best Regards, Ian.
